00008990512020FYfalseP6MP1YP6MP1Yus-gaap:OtherLiabilitiesus-gaap:OtherAssets100008990512020-01-012020-12-310000899051us-gaap:CommonStockMemberexch:XCHI2020-01-012020-12-310000899051us-gaap:CommonStockMemberexch:XNYS2020-01-012020-12-310000899051all:SubordinatedDebenturesDue2053At5.10PercentMemberexch:XNYS2020-01-012020-12-310000899051us-gaap:SeriesGPreferredStockMemberexch:XNYS2020-01-012020-12-310000899051us-gaap:SeriesHPreferredStockMemberexch:XNYS2020-01-012020-12-310000899051all:SeriesIPreferredStockMemberexch:XNYS2020-01-012020-12-31iso4217:USD00008990512020-06-30xbrli:shares00008990512021-01-290000899051us-gaap:PropertyLiabilityAndCasualtyInsuranceSegmentMember2020-01-012020-12-310000899051us-gaap:PropertyLiabilityAndCasualtyInsuranceSegmentMember2019-01-012019-12-310000899051us-gaap:PropertyLiabilityAndCasualtyInsuranceSegmentMember2018-01-012018-12-310000899051us-gaap:LifeAndAnnuityInsuranceProductLineMember2020-01-012020-12-310000899051us-gaap:LifeAndAnnuityInsuranceProductLineMember2019-01-012019-12-310000899051us-gaap:LifeAndAnnuityInsuranceProductLineMember2018-01-012018-12-310000899051us-gaap:LifeInsuranceSegmentMember2020-01-012020-12-310000899051us-gaap:LifeInsuranceSegmentMember2019-01-012019-12-310000899051us-gaap:LifeInsuranceSegmentMember2018-01-012018-12-310000899051us-gaap:ProductAndServiceOtherMember2020-01-012020-12-310000899051us-gaap:ProductAndServiceOtherMember2019-01-012019-12-310000899051us-gaap:ProductAndServiceOtherMember2018-01-012018-12-3100008990512019-01-012019-12-3100008990512018-01-012018-12-310000899051all:PropertyLiabilityInsuranceClaimsAndClaimsExpenseMember2020-01-012020-12-310000899051all:PropertyLiabilityInsuranceClaimsAndClaimsExpenseMember2019-01-012019-12-310000899051all:PropertyLiabilityInsuranceClaimsAndClaimsExpenseMember2018-01-012018-12-310000899051all:LifeAndAnnuityContractBenefitsMember2020-01-012020-12-310000899051all:LifeAndAnnuityContractBenefitsMember2019-01-012019-12-310000899051all:LifeAndAnnuityContractBenefitsMember2018-01-012018-12-310000899051all:InterestCreditedToContractholderFundsMember2020-01-012020-12-310000899051all:InterestCreditedToContractholderFundsMember2019-01-012019-12-310000899051all:InterestCreditedToContractholderFundsMember2018-01-012018-12-31iso4217:USDxbrli:shares00008990512020-12-3100008990512019-12-310000899051us-gaap:PreferredStockMember2020-12-310000899051us-gaap:PreferredStockMember2019-12-310000899051us-gaap:PreferredStockMember2018-12-310000899051us-gaap:PreferredStockIncludingAdditionalPaidInCapitalMember2019-12-310000899051us-gaap:PreferredStockIncludingAdditionalPaidInCapitalMember2018-12-310000899051us-gaap:PreferredStockIncludingAdditionalPaidInCapitalMember2017-12-310000899051us-gaap:PreferredStockIncludingAdditionalPaidInCapitalMember2020-01-012020-12-310000899051us-gaap:PreferredStockIncludingAdditionalPaidInCapitalMember2019-01-012019-12-310000899051us-gaap:PreferredStockIncludingAdditionalPaidInCapitalMember2018-01-012018-12-310000899051us-gaap:PreferredStockIncludingAdditionalPaidInCapitalMember2020-12-310000899051us-gaap:CommonStockMember2020-12-310000899051us-gaap:CommonStockMember2019-12-310000899051us-gaap:CommonStockMember2018-12-310000899051us-gaap:AdditionalPaidInCapitalMember2019-12-310000899051us-gaap:AdditionalPaidInCapitalMember2018-12-310000899051us-gaap:AdditionalPaidInCapitalMember2017-12-310000899051us-gaap:AdditionalPaidInCapitalMember2020-01-012020-12-310000899051us-gaap:AdditionalPaidInCapitalMember2019-01-012019-12-310000899051us-gaap:AdditionalPaidInCapitalMember2018-01-012018-12-310000899051us-gaap:AdditionalPaidInCapitalMember2020-12-310000899051us-gaap:RetainedEarningsMember2019-12-310000899051us-gaap:RetainedEarningsMember2018-12-310000899051us-gaap:RetainedEarningsMember2017-12-310000899051us-gaap:RetainedEarningsMembersrt:CumulativeEffectPeriodOfAdoptionAdjustmentMember2019-12-310000899051us-gaap:RetainedEarningsMembersrt:CumulativeEffectPeriodOfAdoptionAdjustmentMember2018-12-310000899051us-gaap:RetainedEarningsMembersrt:CumulativeEffectPeriodOfAdoptionAdjustmentMember2017-12-310000899051us-gaap:RetainedEarningsMember2020-01-012020-12-310000899051us-gaap:RetainedEarningsMember2019-01-012019-12-310000899051us-gaap:RetainedEarningsMember2018-01-012018-12-310000899051us-gaap:RetainedEarningsMember2020-12-310000899051all:DeferredEsopExpenseMember2019-12-310000899051all:DeferredEsopExpenseMember2018-12-310000899051all:DeferredEsopExpenseMember2017-12-310000899051all:DeferredEsopExpenseMember2020-12-310000899051us-gaap:TreasuryStockMember2019-12-310000899051us-gaap:TreasuryStockMember2018-12-310000899051us-gaap:TreasuryStockMember2017-12-310000899051us-gaap:TreasuryStockMember2020-01-012020-12-310000899051us-gaap:TreasuryStockMember2019-01-012019-12-310000899051us-gaap:TreasuryStockMember2018-01-012018-12-310000899051us-gaap:TreasuryStockMember2020-12-310000899051us-gaap:AccumulatedOtherComprehensiveIncomeMember2019-12-310000899051us-gaap:AccumulatedOtherComprehensiveIncomeMember2018-12-310000899051us-gaap:AccumulatedOtherComprehensiveIncomeMember2017-12-310000899051srt:CumulativeEffectPeriodOfAdoptionAdjustmentMemberus-gaap:AccumulatedOtherComprehensiveIncomeMember2019-12-310000899051srt:CumulativeEffectPeriodOfAdoptionAdjustmentMemberus-gaap:AccumulatedOtherComprehensiveIncomeMember2018-12-310000899051srt:CumulativeEffectPeriodOfAdoptionAdjustmentMemberus-gaap:AccumulatedOtherComprehensiveIncomeMember2017-12-310000899051us-gaap:AccumulatedOtherComprehensiveIncomeMember2020-01-012020-12-310000899051us-gaap:AccumulatedOtherComprehensiveIncomeMember2019-01-012019-12-310000899051us-gaap:AccumulatedOtherComprehensiveIncomeMember2018-01-012018-12-310000899051us-gaap:AccumulatedOtherComprehensiveIncomeMember2020-12-3100008990512018-12-3100008990512017-12-31all:segment0000899051srt:MaximumMember2020-01-012020-12-31xbrli:pure0000899051all:PersonalLinesMembersrt:MinimumMember2020-01-012020-12-310000899051all:PersonalLinesMembersrt:MaximumMember2020-01-012020-12-310000899051all:ProtectionPlansandOtherContractsMembersrt:MinimumMember2020-01-012020-12-310000899051srt:MaximumMemberall:ProtectionPlansandOtherContractsMember2020-01-012020-12-310000899051all:AllstateProtectionMember2020-12-310000899051all:AllstateProtectionMember2019-12-310000899051all:ProtectionServicesMember2020-12-310000899051all:ProtectionServicesMember2019-12-310000899051all:AllstateProtectionAndProtectionServicesMember2020-12-310000899051all:AllstateProtectionAndProtectionServicesMember2019-12-310000899051all:ProtectionServicesMemberus-gaap:PropertyLiabilityAndCasualtyInsuranceSegmentMember2020-01-012020-12-310000899051all:ProtectionServicesMemberus-gaap:PropertyLiabilityAndCasualtyInsuranceSegmentMember2019-01-012019-12-310000899051srt:MinimumMember2020-01-012020-12-310000899051srt:MinimumMemberall:InterestSensitiveLifeInsuranceMember2020-01-012020-12-310000899051srt:MaximumMemberall:InterestSensitiveLifeInsuranceMember2020-01-012020-12-310000899051all:AllstateLifeMember2020-12-310000899051all:AllstateLifeMember2019-12-310000899051all:AllstateBenefitsMember2020-12-310000899051all:AllstateBenefitsMember2019-12-310000899051srt:ScenarioForecastMember2021-01-012021-03-310000899051us-gaap:CustomerRelationshipsMember2020-01-012020-12-310000899051us-gaap:TechnologyBasedIntangibleAssetsMember2020-01-012020-12-310000899051us-gaap:OtherIntangibleAssetsMember2020-01-012020-12-310000899051us-gaap:CustomerRelationshipsMember2020-12-310000899051us-gaap:CustomerRelationshipsMember2019-12-310000899051all:TradeNamesandLicensesMember2020-12-310000899051all:TradeNamesandLicensesMember2019-12-310000899051all:TechnologyBasedandOtherIntangibleAssetsMember2020-12-310000899051all:TechnologyBasedandOtherIntangibleAssetsMember2019-12-310000899051us-gaap:EquipmentMembersrt:MinimumMember2020-01-012020-12-310000899051us-gaap:EquipmentMembersrt:MaximumMember2020-01-012020-12-310000899051us-gaap:BuildingAndBuildingImprovementsMember2020-01-012020-12-310000899051us-gaap:FixedIncomeSecuritiesMember2020-12-310000899051us-gaap:FixedIncomeSecuritiesMember2020-01-010000899051us-gaap:MortgagesMember2020-12-310000899051us-gaap:MortgagesMember2020-01-010000899051all:BankLoansMember2020-12-310000899051all:BankLoansMember2020-01-010000899051all:AgentLoansMember2020-12-310000899051all:AgentLoansMember2020-01-0100008990512020-01-010000899051srt:MinimumMember2020-12-310000899051srt:MaximumMember2020-12-310000899051us-gaap:OtherLiabilitiesMember2020-12-310000899051us-gaap:OtherLiabilitiesMember2019-12-310000899051us-gaap:OtherAssetsMember2020-12-310000899051us-gaap:OtherAssetsMember2019-12-310000899051us-gaap:RetainedEarningsMembersrt:CumulativeEffectPeriodOfAdoptionAdjustmentMemberus-gaap:AccountingStandardsUpdate201613Member2020-01-010000899051all:NationalGeneralMemberus-gaap:SubsequentEventMember2021-01-042021-01-040000899051all:SeniorNotesDue2025At0750PercentMember2020-11-190000899051all:SeniorNotesDue2030At145PercentMember2020-11-190000899051all:NationalGeneralMemberus-gaap:SubsequentEventMember2021-01-040000899051all:PlumChoiceIncMember2019-02-120000899051us-gaap:SubsequentEventMember2021-01-262021-01-26all:state0000899051all:AllstateProtectionMember2020-01-012020-12-310000899051all:AllstateProtectionMember2019-01-012019-12-310000899051all:AllstateProtectionMember2018-01-012018-12-310000899051us-gaap:NonUsMemberall:ProtectionServicesMemberall:ConsumerProductProtectionPlansMember2020-01-012020-12-310000899051us-gaap:NonUsMemberall:ProtectionServicesMemberall:ConsumerProductProtectionPlansMember2019-01-012019-12-310000899051us-gaap:NonUsMemberall:ProtectionServicesMemberall:ConsumerProductProtectionPlansMember2018-01-012018-12-310000899051all:AutoMemberall:PropertyLiabilityMember2020-01-012020-12-310000899051all:AutoMemberall:PropertyLiabilityMember2019-01-012019-12-310000899051all:AutoMemberall:PropertyLiabilityMember2018-01-012018-12-310000899051all:HomeOwnersMemberall:PropertyLiabilityMember2020-01-012020-12-310000899051all:HomeOwnersMemberall:PropertyLiabilityMember2019-01-012019-12-310000899051all:HomeOwnersMemberall:PropertyLiabilityMember2018-01-012018-12-310000899051all:OtherPersonalLinesMemberall:PropertyLiabilityMember2020-01-012020-12-310000899051all:OtherPersonalLinesMemberall:PropertyLiabilityMember2019-01-012019-12-310000899051all:OtherPersonalLinesMemberall:PropertyLiabilityMember2018-01-012018-12-310000899051us-gaap:PropertyAndCasualtyCommercialInsuranceProductLineMemberall:PropertyLiabilityMember2020-01-012020-12-310000899051us-gaap:PropertyAndCasualtyCommercialInsuranceProductLineMemberall:PropertyLiabilityMember2019-01-012019-12-310000899051us-gaap:PropertyAndCasualtyCommercialInsuranceProductLineMemberall:PropertyLiabilityMember2018-01-012018-12-310000899051all:DiscontinuedLinesAndCoveragesMember2020-01-012020-12-310000899051all:DiscontinuedLinesAndCoveragesMember2019-01-012019-12-310000899051all:DiscontinuedLinesAndCoveragesMember2018-01-012018-12-310000899051all:PropertyLiabilityMember2020-01-012020-12-310000899051all:PropertyLiabilityMember2019-01-012019-12-310000899051all:PropertyLiabilityMember2018-01-012018-12-310000899051us-gaap:OperatingSegmentsMemberall:PropertyLiabilityMember2020-01-012020-12-310000899051us-gaap:OperatingSegmentsMemberall:PropertyLiabilityMember2019-01-012019-12-310000899051us-gaap:OperatingSegmentsMemberall:PropertyLiabilityMember2018-01-012018-12-310000899051all:ProtectionServicesMemberall:ConsumerProductProtectionPlansMember2020-01-012020-12-310000899051all:ProtectionServicesMemberall:ConsumerProductProtectionPlansMember2019-01-012019-12-310000899051all:ProtectionServicesMemberall:ConsumerProductProtectionPlansMember2018-01-012018-12-310000899051all:ProtectionServicesMemberall:RoadsideAssistanceMember2020-01-012020-12-310000899051all:ProtectionServicesMemberall:RoadsideAssistanceMember2019-01-012019-12-310000899051all:ProtectionServicesMemberall:RoadsideAssistanceMember2018-01-012018-12-310000899051all:ProtectionServicesMemberall:FinanceAndInsuranceProductsMember2020-01-012020-12-310000899051all:ProtectionServicesMemberall:FinanceAndInsuranceProductsMember2019-01-012019-12-310000899051all:ProtectionServicesMemberall:FinanceAndInsuranceProductsMember2018-01-012018-12-310000899051all:ProtectionServicesMember2020-01-012020-12-310000899051all:ProtectionServicesMember2019-01-012019-12-310000899051all:ProtectionServicesMember2018-01-012018-12-310000899051all:ProtectionServicesMemberus-gaap:OperatingSegmentsMember2020-01-012020-12-310000899051all:ProtectionServicesMemberus-gaap:OperatingSegmentsMember2019-01-012019-12-310000899051all:ProtectionServicesMemberus-gaap:OperatingSegmentsMember2018-01-012018-12-310000899051all:AllstateLifeMemberall:TraditionalLifeInsuranceMember2020-01-012020-12-310000899051all:AllstateLifeMemberall:TraditionalLifeInsuranceMember2019-01-012019-12-310000899051all:AllstateLifeMemberall:TraditionalLifeInsuranceMember2018-01-012018-12-310000899051all:AccidentHealthAndOtherMemberall:AllstateLifeMember2020-01-012020-12-310000899051all:AccidentHealthAndOtherMemberall:AllstateLifeMember2019-01-012019-12-310000899051all:AccidentHealthAndOtherMemberall:AllstateLifeMember2018-01-012018-12-310000899051all:AllstateLifeMemberall:InterestSensitiveLifeInsuranceMember2020-01-012020-12-310000899051all:AllstateLifeMemberall:InterestSensitiveLifeInsuranceMember2019-01-012019-12-310000899051all:AllstateLifeMemberall:InterestSensitiveLifeInsuranceMember2018-01-012018-12-310000899051all:AllstateLifeMemberus-gaap:OperatingSegmentsMember2020-01-012020-12-310000899051all:AllstateLifeMemberus-gaap:OperatingSegmentsMember2019-01-012019-12-310000899051all:AllstateLifeMemberus-gaap:OperatingSegmentsMember2018-01-012018-12-310000899051all:AllstateLifeMember2020-01-012020-12-310000899051all:AllstateLifeMember2019-01-012019-12-310000899051all:AllstateLifeMember2018-01-012018-12-310000899051all:AllstateBenefitsMemberall:TraditionalLifeInsuranceMember2020-01-012020-12-310000899051all:AllstateBenefitsMemberall:TraditionalLifeInsuranceMember2019-01-012019-12-310000899051all:AllstateBenefitsMemberall:TraditionalLifeInsuranceMember2018-01-012018-12-310000899051all:AccidentHealthAndOtherMemberall:AllstateBenefitsMember2020-01-012020-12-310000899051all:AccidentHealthAndOtherMemberall:AllstateBenefitsMember2019-01-012019-12-310000899051all:AccidentHealthAndOtherMemberall:AllstateBenefitsMember2018-01-012018-12-310000899051all:AllstateBenefitsMemberall:InterestSensitiveLifeInsuranceMember2020-01-012020-12-310000899051all:AllstateBenefitsMemberall:InterestSensitiveLifeInsuranceMember2019-01-012019-12-310000899051all:AllstateBenefitsMemberall:InterestSensitiveLifeInsuranceMember2018-01-012018-12-310000899051all:AllstateBenefitsMember2020-01-012020-12-310000899051all:AllstateBenefitsMember2019-01-012019-12-310000899051all:AllstateBenefitsMember2018-01-012018-12-310000899051all:FixedAnnuitiesMemberall:AllstateAnnuitiesMember2020-01-012020-12-310000899051all:FixedAnnuitiesMemberall:AllstateAnnuitiesMember2019-01-012019-12-310000899051all:FixedAnnuitiesMemberall:AllstateAnnuitiesMember2018-01-012018-12-310000899051all:AllstateAnnuitiesMember2020-01-012020-12-310000899051all:AllstateAnnuitiesMember2019-01-012019-12-310000899051all:AllstateAnnuitiesMember2018-01-012018-12-310000899051us-gaap:CorporateAndOtherMember2020-01-012020-12-310000899051us-gaap:CorporateAndOtherMember2019-01-012019-12-310000899051us-gaap:CorporateAndOtherMember2018-01-012018-12-310000899051us-gaap:IntersegmentEliminationMember2020-01-012020-12-310000899051us-gaap:IntersegmentEliminationMember2019-01-012019-12-310000899051us-gaap:IntersegmentEliminationMember2018-01-012018-12-310000899051us-gaap:LifeAndAnnuityInsuranceProductLineMemberall:AllstateAnnuitiesMember2020-07-012020-09-300000899051all:PropertyLiabilityMember2020-12-310000899051all:PropertyLiabilityMember2019-12-310000899051all:AllstateAnnuitiesMember2020-12-310000899051all:AllstateAnnuitiesMember2019-12-310000899051us-gaap:CorporateAndOtherMember2020-12-310000899051us-gaap:CorporateAndOtherMember2019-12-310000899051us-gaap:USTreasuryAndGovernmentMember2020-12-310000899051us-gaap:USStatesAndPoliticalSubdivisionsMember2020-12-310000899051us-gaap:CorporateDebtSecuritiesMember2020-12-310000899051us-gaap:ForeignGovernmentDebtSecuritiesMember2020-12-310000899051us-gaap:AssetBackedSecuritiesMember2020-12-310000899051us-gaap:MortgageBackedSecuritiesMember2020-12-310000899051us-gaap:USTreasuryAndGovernmentMember2019-12-310000899051us-gaap:USStatesAndPoliticalSubdivisionsMember2019-12-310000899051us-gaap:CorporateDebtSecuritiesMember2019-12-310000899051us-gaap:ForeignGovernmentDebtSecuritiesMember2019-12-310000899051us-gaap:AssetBackedSecuritiesMember2019-12-310000899051us-gaap:MortgageBackedSecuritiesMember2019-12-310000899051us-gaap:FixedIncomeSecuritiesMember2020-01-012020-12-310000899051us-gaap:FixedIncomeSecuritiesMember2019-01-012019-12-310000899051us-gaap:FixedIncomeSecuritiesMember2018-01-012018-12-310000899051us-gaap:EquitySecuritiesMember2020-01-012020-12-310000899051us-gaap:EquitySecuritiesMember2019-01-012019-12-310000899051us-gaap:EquitySecuritiesMember2018-01-012018-12-310000899051us-gaap:MortgagesMember2020-01-012020-12-310000899051us-gaap:MortgagesMember2019-01-012019-12-310000899051us-gaap:MortgagesMember2018-01-012018-12-310000899051srt:PartnershipInterestMember2020-01-012020-12-310000899051srt:PartnershipInterestMember2019-01-012019-12-310000899051srt:PartnershipInterestMember2018-01-012018-12-310000899051us-gaap:ShortTermInvestmentsMember2020-01-012020-12-310000899051us-gaap:ShortTermInvestmentsMember2019-01-012019-12-310000899051us-gaap:ShortTermInvestmentsMember2018-01-012018-12-310000899051us-gaap:OtherThanSecuritiesInvestmentMember2020-01-012020-12-310000899051us-gaap:OtherThanSecuritiesInvestmentMember2019-01-012019-12-310000899051us-gaap:OtherThanSecuritiesInvestmentMember2018-01-012018-12-310000899051us-gaap:DerivativeMember2020-01-012020-12-310000899051us-gaap:DerivativeMember2019-01-012019-12-310000899051us-gaap:DerivativeMember2018-01-012018-12-310000899051us-gaap:AvailableforsaleSecuritiesMember2020-01-012020-12-310000899051us-gaap:AvailableforsaleSecuritiesMember2019-01-012019-12-310000899051us-gaap:AvailableforsaleSecuritiesMember2018-01-012018-12-310000899051us-gaap:CorporateDebtSecuritiesMember2020-01-012020-12-310000899051us-gaap:CorporateDebtSecuritiesMember2019-01-012019-12-310000899051us-gaap:CorporateDebtSecuritiesMember2018-01-012018-12-310000899051us-gaap:AssetBackedSecuritiesMember2020-01-012020-12-310000899051us-gaap:AssetBackedSecuritiesMember2019-01-012019-12-310000899051us-gaap:AssetBackedSecuritiesMember2018-01-012018-12-310000899051us-gaap:MortgageBackedSecuritiesMember2020-01-012020-12-310000899051us-gaap:MortgageBackedSecuritiesMember2019-01-012019-12-310000899051us-gaap:MortgageBackedSecuritiesMember2018-01-012018-12-310000899051all:BankLoansMember2020-01-012020-12-310000899051all:BankLoansMember2019-01-012019-12-310000899051all:BankLoansMember2018-01-012018-12-310000899051all:AgentLoansMember2020-01-012020-12-310000899051all:AgentLoansMember2019-01-012019-12-310000899051all:AgentLoansMember2018-01-012018-12-310000899051us-gaap:EquityMethodInvestmentsMember2020-01-012020-12-310000899051us-gaap:EquityMethodInvestmentsMember2019-01-012019-12-310000899051us-gaap:EquityMethodInvestmentsMember2018-01-012018-12-310000899051stpr:TX2020-12-310000899051stpr:TX2019-12-310000899051stpr:CA2020-12-310000899051stpr:CA2019-12-310000899051stpr:FL2020-12-310000899051stpr:FL2019-12-310000899051stpr:IL2020-12-310000899051stpr:IL2019-12-310000899051stpr:NC2020-12-310000899051stpr:NC2019-12-310000899051stpr:NJ2020-12-310000899051stpr:NJ2019-12-310000899051srt:ApartmentBuildingMember2020-12-310000899051srt:ApartmentBuildingMember2019-12-310000899051srt:OfficeBuildingMember2020-12-310000899051srt:OfficeBuildingMember2019-12-310000899051srt:WarehouseMember2020-12-310000899051srt:WarehouseMember2019-12-310000899051srt:RetailSiteMember2020-12-310000899051srt:RetailSiteMember2019-12-310000899051srt:OtherPropertyMember2020-12-310000899051srt:OtherPropertyMember2019-12-31all:loan0000899051us-gaap:MortgagesMemberall:MortgageLoansOnRealEstateMaturingInYearOneMember2020-12-310000899051us-gaap:MortgagesMemberall:MortgageLoansOnRealEstateMaturingInYearTwoMember2020-12-310000899051us-gaap:MortgagesMemberall:MortgageLoansOnRealEstateMaturingInYearThreeMember2020-12-310000899051us-gaap:MortgagesMemberall:MortgageLoansOnRealEstateMaturingInYearFourMember2020-12-310000899051all:MortgageLoansOnRealEstateMaturingAfterYearFourMemberus-gaap:MortgagesMember2020-12-310000899051all:PrivateEquityMemberus-gaap:EquityMethodInvestmentsMember2020-12-310000899051srt:PartnershipInterestMemberall:PrivateEquityMember2020-12-310000899051all:PrivateEquityMember2020-12-310000899051all:PrivateEquityMemberus-gaap:EquityMethodInvestmentsMember2019-12-310000899051srt:PartnershipInterestMemberall:PrivateEquityMember2019-12-310000899051all:PrivateEquityMember2019-12-310000899051us-gaap:RealEstateLoanMemberus-gaap:EquityMethodInvestmentsMember2020-12-310000899051us-gaap:RealEstateLoanMembersrt:PartnershipInterestMember2020-12-310000899051us-gaap:RealEstateLoanMember2020-12-310000899051us-gaap:RealEstateLoanMemberus-gaap:EquityMethodInvestmentsMember2019-12-310000899051us-gaap:RealEstateLoanMembersrt:PartnershipInterestMember2019-12-310000899051us-gaap:RealEstateLoanMember2019-12-310000899051us-gaap:OtherInvestmentsMemberus-gaap:EquityMethodInvestmentsMember2020-12-310000899051srt:PartnershipInterestMemberus-gaap:OtherInvestmentsMember2020-12-310000899051us-gaap:OtherInvestmentsMember2020-12-310000899051us-gaap:OtherInvestmentsMemberus-gaap:EquityMethodInvestmentsMember2019-12-310000899051srt:PartnershipInterestMemberus-gaap:OtherInvestmentsMember2019-12-310000899051us-gaap:OtherInvestmentsMember2019-12-310000899051us-gaap:EquityMethodInvestmentsMember2020-12-310000899051srt:PartnershipInterestMember2020-12-310000899051us-gaap:EquityMethodInvestmentsMember2019-12-310000899051srt:PartnershipInterestMember2019-12-310000899051stpr:NY2020-12-310000899051stpr:NY2019-12-310000899051stpr:CO2020-12-310000899051stpr:CO2019-12-310000899051stpr:WA2020-12-310000899051stpr:WA2019-12-310000899051all:BankLoansMember2020-12-310000899051all:BankLoansMember2019-12-310000899051us-gaap:PolicyLoansMember2020-12-310000899051us-gaap:PolicyLoansMember2019-12-310000899051all:AgentLoansMember2020-12-310000899051all:AgentLoansMember2019-12-310000899051us-gaap:FixedIncomeSecuritiesMember2019-12-31all:contract0000899051all:InvestmentGradeFixedIncomeSecuritiesMember2020-12-310000899051all:BelowInvestmentGradeFixedIncomeSecuritiesMember2020-12-310000899051all:InvestmentGradeFixedIncomeSecuritiesMember2019-12-310000899051all:BelowInvestmentGradeFixedIncomeSecuritiesMember2019-12-310000899051us-gaap:MortgagesMemberall:Acquisition2015andpriorMemberall:DebtServiceCoverageRatioBelow1Member2020-12-310000899051us-gaap:MortgagesMemberall:Acquisition2016Memberall:DebtServiceCoverageRatioBelow1Member2020-12-310000899051us-gaap:MortgagesMemberall:DebtServiceCoverageRatioBelow1Memberall:Acquisition2017Member2020-12-310000899051us-gaap:MortgagesMemberall:DebtServiceCoverageRatioBelow1Memberall:Acquisition2018Member2020-12-310000899051us-gaap:MortgagesMemberall:Acquisition2019Memberall:DebtServiceCoverageRatioBelow1Member2020-12-310000899051us-gaap:MortgagesMemberall:AcquisitionCurrentMemberall:DebtServiceCoverageRatioBelow1Member2020-12-310000899051us-gaap:MortgagesMemberall:DebtServiceCoverageRatioBelow1Member2020-12-310000899051us-gaap:MortgagesMemberall:DebtServiceCoverageRatioBelow1Member2019-12-310000899051us-gaap:MortgagesMemberall:Acquisition2015andpriorMemberall:DebtServiceCoverageRatioBelow1To1.25Member2020-12-310000899051us-gaap:MortgagesMemberall:Acquisition2016Memberall:DebtServiceCoverageRatioBelow1To1.25Member2020-12-310000899051us-gaap:MortgagesMemberall:DebtServiceCoverageRatioBelow1To1.25Memberall:Acquisition2017Member2020-12-310000899051us-gaap:MortgagesMemberall:DebtServiceCoverageRatioBelow1To1.25Memberall:Acquisition2018Member2020-12-310000899051us-gaap:MortgagesMemberall:Acquisition2019Memberall:DebtServiceCoverageRatioBelow1To1.25Member2020-12-310000899051us-gaap:MortgagesMemberall:AcquisitionCurrentMemberall:DebtServiceCoverageRatioBelow1To1.25Member2020-12-310000899051us-gaap:MortgagesMemberall:DebtServiceCoverageRatioBelow1To1.25Member2020-12-310000899051us-gaap:MortgagesMemberall:DebtServiceCoverageRatioBelow1To1.25Member2019-12-310000899051us-gaap:MortgagesMemberall:DebtServiceCoverageRatioBelow1.26To1.5Memberall:Acquisition2015andpriorMember2020-12-310000899051us-gaap:MortgagesMemberall:DebtServiceCoverageRatioBelow1.26To1.5Memberall:Acquisition2016Member2020-12-310000899051us-gaap:MortgagesMemberall:DebtServiceCoverageRatioBelow1.26To1.5Memberall:Acquisition2017Member2020-12-310000899051us-gaap:MortgagesMemberall:DebtServiceCoverageRatioBelow1.26To1.5Memberall:Acquisition2018Member2020-12-310000899051us-gaap:MortgagesMemberall:Acquisition2019Memberall:DebtServiceCoverageRatioBelow1.26To1.5Member2020-12-310000899051us-gaap:MortgagesMemberall:DebtServiceCoverageRatioBelow1.26To1.5Memberall:AcquisitionCurrentMember2020-12-310000899051us-gaap:MortgagesMemberall:DebtServiceCoverageRatioBelow1.26To1.5Member2020-12-310000899051us-gaap:MortgagesMemberall:DebtServiceCoverageRatioBelow1.26To1.5Member2019-12-310000899051us-gaap:MortgagesMemberall:Acquisition2015andpriorMemberall:DebtServiceCoverageRatioabove1.5Member2020-12-310000899051us-gaap:MortgagesMemberall:Acquisition2016Memberall:DebtServiceCoverageRatioabove1.5Member2020-12-310000899051us-gaap:MortgagesMemberall:DebtServiceCoverageRatioabove1.5Memberall:Acquisition2017Member2020-12-310000899051us-gaap:MortgagesMemberall:DebtServiceCoverageRatioabove1.5Memberall:Acquisition2018Member2020-12-310000899051us-gaap:MortgagesMemberall:Acquisition2019Memberall:DebtServiceCoverageRatioabove1.5Member2020-12-310000899051us-gaap:MortgagesMemberall:AcquisitionCurrentMemberall:DebtServiceCoverageRatioabove1.5Member2020-12-310000899051us-gaap:MortgagesMemberall:DebtServiceCoverageRatioabove1.5Member2020-12-310000899051us-gaap:MortgagesMemberall:DebtServiceCoverageRatioabove1.5Member2019-12-310000899051us-gaap:MortgagesMemberall:Acquisition2015andpriorMember2020-12-310000899051us-gaap:MortgagesMemberall:Acquisition2016Member2020-12-310000899051us-gaap:MortgagesMemberall:Acquisition2017Member2020-12-310000899051us-gaap:MortgagesMemberall:Acquisition2018Member2020-12-310000899051us-gaap:MortgagesMemberall:Acquisition2019Member2020-12-310000899051us-gaap:MortgagesMemberall:AcquisitionCurrentMember2020-12-310000899051us-gaap:MortgagesMember2020-12-310000899051us-gaap:MortgagesMember2019-12-310000899051us-gaap:MortgagesMember2020-10-012020-12-3100008990512020-10-012020-12-310000899051us-gaap:MortgagesMember2019-12-310000899051us-gaap:MortgagesMembersrt:CumulativeEffectPeriodOfAdoptionAdjustmentMember2019-12-310000899051srt:StandardPoorsBBBRatingMemberall:Acquisition2015andpriorMemberall:BankLoansMember2020-12-310000899051all:Acquisition2016Membersrt:StandardPoorsBBBRatingMemberall:BankLoansMember2020-12-310000899051all:Acquisition2017Membersrt:StandardPoorsBBBRatingMemberall:BankLoansMember2020-12-310000899051all:Acquisition2018Membersrt:StandardPoorsBBBRatingMemberall:BankLoansMember2020-12-310000899051all:Acquisition2019Membersrt:StandardPoorsBBBRatingMemberall:BankLoansMember2020-12-310000899051srt:StandardPoorsBBBRatingMemberall:BankLoansMemberall:AcquisitionCurrentMember2020-12-310000899051srt:StandardPoorsBBBRatingMemberall:BankLoansMember2020-12-310000899051all:Acquisition2015andpriorMemberall:BankLoansMembersrt:StandardPoorsBBRatingMember2020-12-310000899051all:Acquisition2016Memberall:BankLoansMembersrt:StandardPoorsBBRatingMember2020-12-310000899051all:Acquisition2017Memberall:BankLoansMembersrt:StandardPoorsBBRatingMember2020-12-310000899051all:Acquisition2018Memberall:BankLoansMembersrt:StandardPoorsBBRatingMember2020-12-310000899051all:Acquisition2019Memberall:BankLoansMembersrt:StandardPoorsBBRatingMember2020-12-310000899051all:BankLoansMemberall:AcquisitionCurrentMembersrt:StandardPoorsBBRatingMember2020-12-310000899051all:BankLoansMembersrt:StandardPoorsBBRatingMember2020-12-310000899051srt:StandardPoorsBRatingMemberall:Acquisition2015andpriorMemberall:BankLoansMember2020-12-310000899051all:Acquisition2016Membersrt:StandardPoorsBRatingMemberall:BankLoansMember2020-12-310000899051all:Acquisition2017Membersrt:StandardPoorsBRatingMemberall:BankLoansMember2020-12-310000899051srt:StandardPoorsBRatingMemberall:Acquisition2018Memberall:BankLoansMember2020-12-310000899051all:Acquisition2019Membersrt:StandardPoorsBRatingMemberall:BankLoansMember2020-12-310000899051srt:StandardPoorsBRatingMemberall:BankLoansMemberall:AcquisitionCurrentMember2020-12-310000899051srt:StandardPoorsBRatingMemberall:BankLoansMember2020-12-310000899051all:StandardPoorsCCCRatingandBelowMemberall:Acquisition2015andpriorMemberall:BankLoansMember2020-12-310000899051all:Acquisition2016Memberall:StandardPoorsCCCRatingandBelowMemberall:BankLoansMember2020-12-310000899051all:Acquisition2017Memberall:StandardPoorsCCCRatingandBelowMemberall:BankLoansMember2020-12-310000899051all:StandardPoorsCCCRatingandBelowMemberall:Acquisition2018Memberall:BankLoansMember2020-12-310000899051all:Acquisition2019Memberall:StandardPoorsCCCRatingandBelowMemberall:BankLoansMember2020-12-310000899051all:StandardPoorsCCCRatingandBelowMemberall:BankLoansMemberall:AcquisitionCurrentMember2020-12-310000899051all:StandardPoorsCCCRatingandBelowMemberall:BankLoansMember2020-12-310000899051all:Acquisition2015andpriorMemberall:BankLoansMember2020-12-310000899051all:Acquisition2016Memberall:BankLoansMember2020-12-310000899051all:Acquisition2017Memberall:BankLoansMember2020-12-310000899051all:Acquisition2018Memberall:BankLoansMember2020-12-310000899051all:Acquisition2019Memberall:BankLoansMember2020-12-310000899051all:BankLoansMemberall:AcquisitionCurrentMember2020-12-310000899051srt:CumulativeEffectPeriodOfAdoptionAdjustmentMemberall:BankLoansMember2019-12-310000899051all:BankLoansMember2020-01-012020-12-310000899051srt:MinimumMembersrt:PartnershipInterestMember2020-01-012020-12-310000899051srt:MaximumMembersrt:PartnershipInterestMember2020-01-012020-12-310000899051srt:PartnershipInterestMember2020-12-310000899051us-gaap:USTreasuryAndGovernmentMemberus-gaap:FairValueInputsLevel1Memberus-gaap:FairValueMeasurementsRecurringMember2020-12-310000899051us-gaap:FairValueInputsLevel2Memberus-gaap:USTreasuryAndGovernmentMemberus-gaap:FairValueMeasurementsRecurringMember2020-12-310000899051us-gaap:USTreasuryAndGovernmentMemberus-gaap:FairValueInputsLevel3Memberus-gaap:FairValueMeasurementsRecurringMember2020-12-310000899051us-gaap:EstimateOfFairValueFairValueDisclosureMemberus-gaap:USTreasuryAndGovernmentMemberus-gaap:FairValueMeasurementsRecurringMember2020-12-310000899051us-gaap:USStatesAndPoliticalSubdivisionsMemberus-gaap:FairValueInputsLevel1Memberus-gaap:FairValueMeasurementsRecurringMember2020-12-310000899051us-gaap:FairValueInputsLevel2Memberus-gaap:USStatesAndPoliticalSubdivisionsMemberus-gaap:FairValueMeasurementsRecurringMember2020-12-310000899051us-gaap:USStatesAndPoliticalSubdivisionsMemberus-gaap:FairValueInputsLevel3Memberus-gaap:FairValueMeasurementsRecurringMember2020-12-310000899051us-gaap:EstimateOfFairValueFairValueDisclosureMemberus-gaap:USStatesAndPoliticalSubdivisionsMemberus-gaap:FairValueMeasurementsRecurringMember2020-12-310000899051all:CorporateDebtSecuritiesPublicMemberus-gaap:FairValueInputsLevel1Memberus-gaap:FairValueMeasurementsRecurringMember2020-12-310000899051us-gaap:FairValueInputsLevel2Memberall:CorporateDebtSecuritiesPublicMemberus-gaap:FairValueMeasurementsRecurringMember2020-12-310000899051all:CorporateDebtSecuritiesPublicMemberus-gaap:FairValueInputsLevel3Memberus-gaap:FairValueMeasurementsRecurringMember2020-12-310000899051us-gaap:EstimateOfFairValueFairValueDisclosureMemberall:CorporateDebtSecuritiesPublicMemberus-gaap:FairValueMeasurementsRecurringMember2020-12-310000899051all:CorporateDebtSecuritiesPrivatePlacementMemberus-gaap:FairValueInputsLevel1Memberus-gaap:FairValueMeasurementsRecurringMember2020-12-310000899051us-gaap:FairValueInputsLevel2Memberall:CorporateDebtSecuritiesPrivatePlacementMemberus-gaap:FairValueMeasurementsRecurringMember2020-12-310000899051all:CorporateDebtSecuritiesPrivatePlacementMemberus-gaap:FairValueInputsLevel3Memberus-gaap:FairValueMeasurementsRecurringMember2020-12-310000899051us-gaap:EstimateOfFairValueFairValueDisclosureMemberall:CorporateDebtSecuritiesPrivatePlacementMemberus-gaap:FairValueMeasurementsRecurringMember2020-12-310000899051us-gaap:ForeignGovernmentDebtSecuritiesMemberus-gaap:FairValueInputsLevel1Memberus-gaap:FairValueMeasurementsRecurringMember2020-12-310000899051us-gaap:FairValueInputsLevel2Memberus-gaap:ForeignGovernmentDebtSecuritiesMemberus-gaap:FairValueMeasurementsRecurringMember2020-12-310000899051us-gaap:EstimateOfFairValueFairValueDisclosureMemberus-gaap:ForeignGovernmentDebtSecuritiesMemberus-gaap:FairValueInputsLevel3Memberus-gaap:FairValueMeasurementsRecurringMember2020-12-310000899051us-gaap:EstimateOfFairValueFairValueDisclosureMemberus-gaap:ForeignGovernmentDebtSecuritiesMemberus-gaap:FairValueMeasurementsRecurringMember2020-12-310000899051us-gaap:AssetBackedSecuritiesMemberus-gaap:FairValueInputsLevel1Memberus-gaap:FairValueMeasurementsRecurringMember2020-12-310000899051us-gaap:FairValueInputsLevel2Memberus-gaap:AssetBackedSecuritiesMemberus-gaap:FairValueMeasurementsRecurringMember2020-12-310000899051us-gaap:EstimateOfFairValueFairValueDisclosureMemberus-gaap:AssetBackedSecuritiesMemberus-gaap:FairValueInputsLevel3Memberus-gaap:FairValueMeasurementsRecurringMember2020-12-310000899051us-gaap:EstimateOfFairValueFairValueDisclosureMemberus-gaap:AssetBackedSecuritiesMemberus-gaap:FairValueMeasurementsRecurringMember2020-12-310000899051us-gaap:MortgageBackedSecuritiesMemberus-gaap:FairValueInputsLevel1Memberus-gaap:FairValueMeasurementsRecurringMember2020-12-310000899051us-gaap:FairValueInputsLevel2Memberus-gaap:MortgageBackedSecuritiesMemberus-gaap:FairValueMeasurementsRecurringMember2020-12-310000899051us-gaap:EstimateOfFairValueFairValueDisclosureMemberus-gaap:MortgageBackedSecuritiesMemberus-gaap:FairValueInputsLevel3Memberus-gaap:FairValueMeasurementsRecurringMember2020-12-310000899051us-gaap:EstimateOfFairValueFairValueDisclosureMemberus-gaap:MortgageBackedSecuritiesMemberus-gaap:FairValueMeasurementsRecurringMember2020-12-310000899051us-gaap:FairValueInputsLevel1Memberus-gaap:FairValueMeasurementsRecurringMember2020-12-310000899051us-gaap:FairValueInputsLevel2Memberus-gaap:FairValueMeasurementsRecurringMember2020-12-310000899051us-gaap:FairValueInputsLevel3Memberus-gaap:FairValueMeasurementsRecurringMember2020-12-310000899051us-gaap:EstimateOfFairValueFairValueDisclosureMemberus-gaap:FairValueMeasurementsRecurringMember2020-12-310000899051us-gaap:FairValueMeasurementsRecurringMember2020-12-310000899051us-gaap:FairValueInputsLevel1Member2020-12-310000899051us-gaap:FairValueInputsLevel2Member2020-12-310000899051us-gaap:FairValueInputsLevel3Member2020-12-310000899051us-gaap:EstimateOfFairValueFairValueDisclosureMember2020-12-310000899051us-gaap:FairValueMeasuredAtNetAssetValuePerShareMember2020-12-310000899051all:DerivativesEmbeddedInAnnuityContractsMemberus-gaap:FairValueInputsLevel1Memberus-gaap:FairValueMeasurementsRecurringMember2020-12-310000899051us-gaap:FairValueInputsLevel2Memberall:DerivativesEmbeddedInAnnuityContractsMemberus-gaap:FairValueMeasurementsRecurringMember2020-12-310000899051all:DerivativesEmbeddedInAnnuityContractsMemberus-gaap:FairValueInputsLevel3Memberus-gaap:FairValueMeasurementsRecurringMember2020-12-310000899051us-gaap:EstimateOfFairValueFairValueDisclosureMemberall:DerivativesEmbeddedInAnnuityContractsMemberus-gaap:FairValueMeasurementsRecurringMember2020-12-310000899051us-gaap:USTreasuryAndGovernmentMemberus-gaap:FairValueInputsLevel1Memberus-gaap:FairValueMeasurementsRecurringMember2019-12-310000899051us-gaap:FairValueInputsLevel2Memberus-gaap:USTreasuryAndGovernmentMemberus-gaap:FairValueMeasurementsRecurringMember2019-12-310000899051us-gaap:USTreasuryAndGovernmentMemberus-gaap:FairValueInputsLevel3Memberus-gaap:FairValueMeasurementsRecurringMember2019-12-310000899051us-gaap:EstimateOfFairValueFairValueDisclosureMemberus-gaap:USTreasuryAndGovernmentMemberus-gaap:FairValueMeasurementsRecurringMember2019-12-310000899051us-gaap:USStatesAndPoliticalSubdivisionsMemberus-gaap:FairValueInputsLevel1Memberus-gaap:FairValueMeasurementsRecurringMember2019-12-310000899051us-gaap:FairValueInputsLevel2Memberus-gaap:USStatesAndPoliticalSubdivisionsMemberus-gaap:FairValueMeasurementsRecurringMember2019-12-310000899051us-gaap:USStatesAndPoliticalSubdivisionsMemberus-gaap:FairValueInputsLevel3Memberus-gaap:FairValueMeasurementsRecurringMember2019-12-310000899051us-gaap:EstimateOfFairValueFairValueDisclosureMemberus-gaap:USStatesAndPoliticalSubdivisionsMemberus-gaap:FairValueMeasurementsRecurringMember2019-12-310000899051all:CorporateDebtSecuritiesPublicMemberus-gaap:FairValueInputsLevel1Memberus-gaap:FairValueMeasurementsRecurringMember2019-12-310000899051us-gaap:FairValueInputsLevel2Memberall:CorporateDebtSecuritiesPublicMemberus-gaap:FairValueMeasurementsRecurringMember2019-12-310000899051all:CorporateDebtSecuritiesPublicMemberus-gaap:FairValueInputsLevel3Memberus-gaap:FairValueMeasurementsRecurringMember2019-12-310000899051us-gaap:EstimateOfFairValueFairValueDisclosureMemberall:CorporateDebtSecuritiesPublicMemberus-gaap:FairValueMeasurementsRecurringMember2019-12-310000899051all:CorporateDebtSecuritiesPrivatePlacementMemberus-gaap:FairValueInputsLevel1Memberus-gaap:FairValueMeasurementsRecurringMember2019-12-310000899051us-gaap:FairValueInputsLevel2Memberall:CorporateDebtSecuritiesPrivatePlacementMemberus-gaap:FairValueMeasurementsRecurringMember2019-12-310000899051all:CorporateDebtSecuritiesPrivatePlacementMemberus-gaap:FairValueInputsLevel3Memberus-gaap:FairValueMeasurementsRecurringMember2019-12-310000899051us-gaap:EstimateOfFairValueFairValueDisclosureMemberall:CorporateDebtSecuritiesPrivatePlacementMemberus-gaap:FairValueMeasurementsRecurringMember2019-12-310000899051us-gaap:ForeignGovernmentDebtSecuritiesMemberus-gaap:FairValueInputsLevel1Memberus-gaap:FairValueMeasurementsRecurringMember2019-12-310000899051us-gaap:FairValueInputsLevel2Memberus-gaap:ForeignGovernmentDebtSecuritiesMemberus-gaap:FairValueMeasurementsRecurringMember2019-12-310000899051us-gaap:ForeignGovernmentDebtSecuritiesMemberus-gaap:FairValueInputsLevel3Memberus-gaap:FairValueMeasurementsRecurringMember2019-12-310000899051us-gaap:EstimateOfFairValueFairValueDisclosureMemberus-gaap:ForeignGovernmentDebtSecuritiesMemberus-gaap:FairValueMeasurementsRecurringMember2019-12-310000899051us-gaap:AssetBackedSecuritiesMemberus-gaap:FairValueInputsLevel1Memberus-gaap:FairValueMeasurementsRecurringMember2019-12-310000899051us-gaap:FairValueInputsLevel2Memberus-gaap:AssetBackedSecuritiesMemberus-gaap:FairValueMeasurementsRecurringMember2019-12-310000899051us-gaap:EstimateOfFairValueFairValueDisclosureMemberus-gaap:AssetBackedSecuritiesMemberus-gaap:FairValueInputsLevel3Memberus-gaap:FairValueMeasurementsRecurringMember2019-12-310000899051us-gaap:EstimateOfFairValueFairValueDisclosureMemberus-gaap:AssetBackedSecuritiesMemberus-gaap:FairValueMeasurementsRecurringMember2019-12-310000899051us-gaap:MortgageBackedSecuritiesMemberus-gaap:FairValueInputsLevel1Memberus-gaap:FairValueMeasurementsRecurringMember2019-12-310000899051us-gaap:FairValueInputsLevel2Memberus-gaap:MortgageBackedSecuritiesMemberus-gaap:FairValueMeasurementsRecurringMember2019-12-310000899051us-gaap:EstimateOfFairValueFairValueDisclosureMemberus-gaap:MortgageBackedSecuritiesMemberus-gaap:FairValueInputsLevel3Memberus-gaap:FairValueMeasurementsRecurringMember2019-12-310000899051us-gaap:EstimateOfFairValueFairValueDisclosureMemberus-gaap:MortgageBackedSecuritiesMemberus-gaap:FairValueMeasurementsRecurringMember2019-12-310000899051us-gaap:FairValueInputsLevel1Memberus-gaap:FairValueMeasurementsRecurringMember2019-12-310000899051us-gaap:FairValueInputsLevel2Memberus-gaap:FairValueMeasurementsRecurringMember2019-12-310000899051us-gaap:FairValueInputsLevel3Memberus-gaap:FairValueMeasurementsRecurringMember2019-12-310000899051us-gaap:EstimateOfFairValueFairValueDisclosureMemberus-gaap:FairValueMeasurementsRecurringMember2019-12-310000899051us-gaap:FairValueMeasurementsRecurringMember2019-12-310000899051us-gaap:FairValueInputsLevel1Member2019-12-310000899051us-gaap:FairValueInputsLevel2Member2019-12-310000899051us-gaap:FairValueInputsLevel3Member2019-12-310000899051us-gaap:EstimateOfFairValueFairValueDisclosureMember2019-12-310000899051us-gaap:FairValueMeasuredAtNetAssetValuePerShareMember2019-12-310000899051all:DerivativesEmbeddedInAnnuityContractsMemberus-gaap:FairValueInputsLevel1Memberus-gaap:FairValueMeasurementsRecurringMember2019-12-310000899051us-gaap:FairValueInputsLevel2Memberall:DerivativesEmbeddedInAnnuityContractsMemberus-gaap:FairValueMeasurementsRecurringMember2019-12-310000899051all:DerivativesEmbeddedInAnnuityContractsMemberus-gaap:FairValueInputsLevel3Memberus-gaap:FairValueMeasurementsRecurringMember2019-12-310000899051us-gaap:EstimateOfFairValueFairValueDisclosureMemberall:DerivativesEmbeddedInAnnuityContractsMemberus-gaap:FairValueMeasurementsRecurringMember2019-12-310000899051all:EmbeddedDerivativeEquityIndexedAndForwardStartingOptionsInLifeAndAnnuityProductContractMemberus-gaap:FairValueInputsLevel3Member2020-12-310000899051all:MeasurementInputProjectedOptionCostMemberall:EmbeddedDerivativeEquityIndexedAndForwardStartingOptionsInLifeAndAnnuityProductContractMembersrt:MinimumMemberus-gaap:FairValueInputsLevel3Member2020-12-310000899051all:MeasurementInputProjectedOptionCostMembersrt:MaximumMemberall:EmbeddedDerivativeEquityIndexedAndForwardStartingOptionsInLifeAndAnnuityProductContractMemberus-gaap:FairValueInputsLevel3Member2020-12-310000899051all:MeasurementInputProjectedOptionCostMembersrt:WeightedAverageMemberall:EmbeddedDerivativeEquityIndexedAndForwardStartingOptionsInLifeAndAnnuityProductContractMemberus-gaap:FairValueInputsLevel3Member2020-12-310000899051all:EmbeddedDerivativeEquityIndexedAndForwardStartingOptionsInLifeAndAnnuityProductContractMemberus-gaap:FairValueInputsLevel3Member2019-12-310000899051all:MeasurementInputProjectedOptionCostMemberall:EmbeddedDerivativeEquityIndexedAndForwardStartingOptionsInLifeAndAnnuityProductContractMembersrt:MinimumMemberus-gaap:FairValueInputsLevel3Member2019-12-310000899051all:MeasurementInputProjectedOptionCostMembersrt:MaximumMemberall:EmbeddedDerivativeEquityIndexedAndForwardStartingOptionsInLifeAndAnnuityProductContractMemberus-gaap:FairValueInputsLevel3Member2019-12-310000899051all:MeasurementInputProjectedOptionCostMembersrt:WeightedAverageMemberall:EmbeddedDerivativeEquityIndexedAndForwardStartingOptionsInLifeAndAnnuityProductContractMemberus-gaap:FairValueInputsLevel3Member2019-12-310000899051all:FixedIncomeSecuritiesValuedBasedOnNonbindingBrokerQuotesMember2020-12-310000899051all:FixedIncomeSecuritiesValuedBasedOnNonbindingBrokerQuotesMember2019-12-310000899051all:MunicipalNotRatedByThirdPartyCreditRatingAgenciesMember2020-12-310000899051all:MunicipalNotRatedByThirdPartyCreditRatingAgenciesMember2019-12-310000899051us-gaap:USStatesAndPoliticalSubdivisionsMember2019-12-310000899051us-gaap:USStatesAndPoliticalSubdivisionsMember2020-01-012020-12-310000899051us-gaap:USStatesAndPoliticalSubdivisionsMember2020-12-310000899051all:CorporateDebtSecuritiesPublicMember2019-12-310000899051all:CorporateDebtSecuritiesPublicMember2020-01-012020-12-310000899051all:CorporateDebtSecuritiesPublicMember2020-12-310000899051all:CorporateDebtSecuritiesPrivatePlacementMember2019-12-310000899051all:CorporateDebtSecuritiesPrivatePlacementMember2020-01-012020-12-310000899051all:CorporateDebtSecuritiesPrivatePlacementMember2020-12-310000899051us-gaap:AssetBackedSecuritiesMember2019-12-310000899051us-gaap:AssetBackedSecuritiesMember2020-01-012020-12-310000899051us-gaap:AssetBackedSecuritiesMember2020-12-310000899051us-gaap:MortgageBackedSecuritiesMember2019-12-310000899051us-gaap:MortgageBackedSecuritiesMember2020-01-012020-12-310000899051us-gaap:MortgageBackedSecuritiesMember2020-12-310000899051us-gaap:FixedIncomeSecuritiesMember2019-12-310000899051us-gaap:FixedIncomeSecuritiesMember2020-01-012020-12-310000899051us-gaap:FixedIncomeSecuritiesMember2020-12-310000899051us-gaap:EquitySecuritiesMember2019-12-310000899051us-gaap:EquitySecuritiesMember2020-01-012020-12-310000899051us-gaap:EquitySecuritiesMember2020-12-310000899051us-gaap:ShortTermInvestmentsMember2019-12-310000899051us-gaap:ShortTermInvestmentsMember2020-01-012020-12-310000899051us-gaap:ShortTermInvestmentsMember2020-12-310000899051all:DerivativesEmbeddedInAnnuityContractsMember2019-12-310000899051all:DerivativesEmbeddedInAnnuityContractsMember2020-01-012020-12-310000899051all:DerivativesEmbeddedInAnnuityContractsMember2020-12-310000899051all:NetInvestmentIncomeMember2020-01-012020-12-310000899051all:RealizedCapitalGainsAndLossesMember2020-01-012020-12-310000899051us-gaap:USStatesAndPoliticalSubdivisionsMember2018-12-310000899051us-gaap:USStatesAndPoliticalSubdivisionsMember2019-01-012019-12-310000899051all:CorporateDebtSecuritiesPublicMember2018-12-310000899051all:CorporateDebtSecuritiesPublicMember2019-01-012019-12-310000899051all:CorporateDebtSecuritiesPrivatePlacementMember2018-12-310000899051all:CorporateDebtSecuritiesPrivatePlacementMember2019-01-012019-12-310000899051us-gaap:AssetBackedSecuritiesMember2018-12-310000899051us-gaap:AssetBackedSecuritiesMember2019-01-012019-12-310000899051us-gaap:MortgageBackedSecuritiesMember2018-12-310000899051us-gaap:MortgageBackedSecuritiesMember2019-01-012019-12-310000899051us-gaap:FixedIncomeSecuritiesMember2018-12-310000899051us-gaap:FixedIncomeSecuritiesMember2019-01-012019-12-310000899051us-gaap:EquitySecuritiesMember2018-12-310000899051us-gaap:EquitySecuritiesMember2019-01-012019-12-310000899051us-gaap:ShortTermInvestmentsMember2018-12-310000899051us-gaap:ShortTermInvestmentsMember2019-01-012019-12-310000899051all:FreeStandingDerivativesNetMember2018-12-310000899051all:FreeStandingDerivativesNetMember2019-01-012019-12-310000899051all:FreeStandingDerivativesNetMember2019-12-310000899051all:DerivativesEmbeddedInAnnuityContractsMember2018-12-310000899051all:DerivativesEmbeddedInAnnuityContractsMember2019-01-012019-12-310000899051all:NetInvestmentIncomeMember2019-01-012019-12-310000899051all:RealizedCapitalGainsAndLossesMember2019-01-012019-12-310000899051us-gaap:USStatesAndPoliticalSubdivisionsMember2017-12-310000899051us-gaap:USStatesAndPoliticalSubdivisionsMember2018-01-012018-12-310000899051all:CorporateDebtSecuritiesPublicMember2017-12-310000899051all:CorporateDebtSecuritiesPublicMember2018-01-012018-12-310000899051all:CorporateDebtSecuritiesPrivatePlacementMember2017-12-310000899051all:CorporateDebtSecuritiesPrivatePlacementMember2018-01-012018-12-310000899051us-gaap:AssetBackedSecuritiesMember2017-12-310000899051us-gaap:AssetBackedSecuritiesMember2018-01-012018-12-310000899051us-gaap:MortgageBackedSecuritiesMember2017-12-310000899051us-gaap:MortgageBackedSecuritiesMember2018-01-012018-12-310000899051us-gaap:FixedIncomeSecuritiesMember2017-12-310000899051us-gaap:FixedIncomeSecuritiesMember2018-01-012018-12-310000899051us-gaap:EquitySecuritiesMember2017-12-310000899051us-gaap:EquitySecuritiesMember2018-01-012018-12-310000899051us-gaap:ShortTermInvestmentsMember2017-12-310000899051us-gaap:ShortTermInvestmentsMember2018-01-012018-12-310000899051all:FreeStandingDerivativesNetMember2017-12-310000899051all:FreeStandingDerivativesNetMember2018-01-012018-12-310000899051all:DerivativesEmbeddedInAnnuityContractsMember2017-12-310000899051all:DerivativesEmbeddedInAnnuityContractsMember2018-01-012018-12-310000899051all:NetInvestmentIncomeMember2018-01-012018-12-310000899051all:RealizedCapitalGainsAndLossesMember2018-01-012018-12-310000899051all:FreeStandingDerivativesNetMember2020-01-012020-12-310000899051us-gaap:CarryingReportedAmountFairValueDisclosureMemberus-gaap:FairValueInputsLevel3Member2020-12-310000899051us-gaap:EstimateOfFairValueFairValueDisclosureMemberus-gaap:FairValueInputsLevel3Member2020-12-310000899051us-gaap:CarryingReportedAmountFairValueDisclosureMemberus-gaap:FairValueInputsLevel3Member2019-12-310000899051us-gaap:EstimateOfFairValueFairValueDisclosureMemberus-gaap:FairValueInputsLevel3Member2019-12-310000899051us-gaap:FairValueInputsLevel2Memberus-gaap:CarryingReportedAmountFairValueDisclosureMember2020-12-310000899051us-gaap:FairValueInputsLevel2Memberus-gaap:EstimateOfFairValueFairValueDisclosureMember2020-12-310000899051us-gaap:FairValueInputsLevel2Memberus-gaap:CarryingReportedAmountFairValueDisclosureMember2019-12-310000899051us-gaap:FairValueInputsLevel2Memberus-gaap:EstimateOfFairValueFairValueDisclosureMember2019-12-310000899051us-gaap:OtherAssetsMemberus-gaap:OtherContractMemberus-gaap:DesignatedAsHedgingInstrumentMember2020-12-310000899051us-gaap:InterestRateCapMemberus-gaap:OtherInvestmentsMemberus-gaap:NondesignatedMember2020-12-310000899051us-gaap:OtherAssetsMemberall:InterestRateFinancialFuturesContractsMemberus-gaap:NondesignatedMember2020-12-310000899051all:EquityAndIndexContractsOptionsAndWarrantsMemberus-gaap:OtherInvestmentsMemberus-gaap:NondesignatedMember2020-12-310000899051us-gaap:OtherAssetsMemberall:EquityAndIndexContractsFinancialFuturesContractsMemberus-gaap:NondesignatedMember2020-12-310000899051all:TotalReturnSwapEquityMemberus-gaap:OtherInvestmentsMemberus-gaap:NondesignatedMember2020-12-310000899051us-gaap:OtherInvestmentsMemberall:ForeignCurrencyForwardsMemberus-gaap:NondesignatedMember2020-12-310000899051us-gaap:OtherInvestmentsMemberus-gaap:EmbeddedDerivativeFinancialInstrumentsMember2020-12-310000899051us-gaap:OtherInvestmentsMemberus-gaap:NondesignatedMemberus-gaap:CreditDefaultSwapBuyingProtectionMember2020-12-310000899051us-gaap:OtherInvestmentsMemberus-gaap:NondesignatedMemberus-gaap:CreditDefaultSwapSellingProtectionMember2020-12-310000899051us-gaap:NondesignatedMember2020-12-310000899051us-gaap:OtherLiabilitiesMemberus-gaap:InterestRateCapMemberus-gaap:NondesignatedMember2020-12-310000899051us-gaap:OtherLiabilitiesMemberall:InterestRateFinancialFuturesContractsMemberus-gaap:NondesignatedMember2020-12-310000899051us-gaap:OtherLiabilitiesMemberall:EquityAndIndexContractsOptionsMemberus-gaap:NondesignatedMember2020-12-310000899051us-gaap:OtherLiabilitiesMemberall:EquityAndIndexContractsFinancialFuturesContractsMemberus-gaap:NondesignatedMember2020-12-310000899051us-gaap:OtherLiabilitiesMemberall:TotalReturnSwapFixedIncomeMemberus-gaap:NondesignatedMember2020-12-310000899051us-gaap:OtherLiabilitiesMemberall:ForeignCurrencyForwardsMemberus-gaap:NondesignatedMember2020-12-310000899051us-gaap:ContractHolderFundsMemberus-gaap:GuaranteedMinimumAccumulationBenefitMemberus-gaap:NondesignatedMember2020-12-310000899051us-gaap:ContractHolderFundsMemberus-gaap:GuaranteedMinimumWithdrawalBenefitMemberus-gaap:NondesignatedMember2020-12-310000899051us-gaap:ContractHolderFundsMemberall:EmbeddedDerivativeEquityIndexedAndForwardStartingOptionsInLifeAndAnnuityProductContractMemberus-gaap:NondesignatedMember2020-12-310000899051us-gaap:OtherLiabilitiesMemberus-gaap:NondesignatedMemberus-gaap:CreditDefaultSwapBuyingProtectionMember2020-12-310000899051us-gaap:OtherLiabilitiesMemberus-gaap:NondesignatedMemberus-gaap:CreditDefaultSwapSellingProtectionMember2020-12-310000899051us-gaap:OtherAssetsMemberus-gaap:OtherContractMemberus-gaap:DesignatedAsHedgingInstrumentMember2019-12-310000899051us-gaap:OtherAssetsMemberall:InterestRateFinancialFuturesContractsMemberus-gaap:NondesignatedMember2019-12-310000899051all:EquityAndIndexContractsOptionsAndWarrantsMemberus-gaap:OtherInvestmentsMemberus-gaap:NondesignatedMember2019-12-310000899051us-gaap:OtherAssetsMemberall:EquityAndIndexContractsFinancialFuturesContractsMemberus-gaap:NondesignatedMember2019-12-310000899051all:TotalReturnSwapFixedIncomeMemberus-gaap:OtherInvestmentsMemberus-gaap:NondesignatedMember2019-12-310000899051us-gaap:OtherInvestmentsMemberus-gaap:NondesignatedMemberus-gaap:CreditDefaultSwapBuyingProtectionMember2019-12-310000899051us-gaap:NondesignatedMember2019-12-310000899051us-gaap:OtherLiabilitiesMemberus-gaap:InterestRateCapMemberus-gaap:NondesignatedMember2019-12-310000899051us-gaap:OtherLiabilitiesMemberus-gaap:NondesignatedMember2019-12-310000899051us-gaap:OtherLiabilitiesMemberall:EquityAndIndexContractsOptionsMemberus-gaap:NondesignatedMember2019-12-310000899051us-gaap:OtherLiabilitiesMemberall:EquityAndIndexContractsFinancialFuturesContractsMemberus-gaap:NondesignatedMember2019-12-310000899051us-gaap:OtherLiabilitiesMemberall:TotalReturnSwapFixedIncomeMemberus-gaap:NondesignatedMember2019-12-310000899051us-gaap:OtherLiabilitiesMemberall:TotalReturnSwapEquityMemberus-gaap:NondesignatedMember2019-12-310000899051us-gaap:OtherLiabilitiesMemberall:ForeignCurrencyForwardsMemberus-gaap:NondesignatedMember2019-12-310000899051us-gaap:ContractHolderFundsMemberus-gaap:GuaranteedMinimumAccumulationBenefitMemberus-gaap:NondesignatedMember2019-12-310000899051us-gaap:ContractHolderFundsMemberus-gaap:GuaranteedMinimumWithdrawalBenefitMemberus-gaap:NondesignatedMember2019-12-310000899051us-gaap:ContractHolderFundsMemberall:EmbeddedDerivativeEquityIndexedAndForwardStartingOptionsInLifeAndAnnuityProductContractMemberus-gaap:NondesignatedMember2019-12-310000899051us-gaap:OtherLiabilitiesMemberus-gaap:NondesignatedMemberus-gaap:CreditDefaultSwapBuyingProtectionMember2019-12-310000899051us-gaap:OtherLiabilitiesMemberus-gaap:NondesignatedMemberus-gaap:CreditDefaultSwapSellingProtectionMember2019-12-310000899051us-gaap:OverTheCounterMember2020-12-310000899051us-gaap:OverTheCounterMember2019-12-310000899051us-gaap:InterestRateContractMemberall:RealizedCapitalGainsAndLossesMember2020-01-012020-12-310000899051us-gaap:InterestRateContractMemberall:LifeAndAnnuityContractBenefitsMember2020-01-012020-12-310000899051us-gaap:InterestRateContractMemberall:InterestCreditedToContractholderFundsMember2020-01-012020-12-310000899051us-gaap:InterestRateContractMemberall:OtherCostAndExpenseOperatingMember2020-01-012020-12-310000899051us-gaap:InterestRateContractMember2020-01-012020-12-310000899051all:EquityAndIndexContractMemberall:RealizedCapitalGainsAndLossesMember2020-01-012020-12-310000899051all:EquityAndIndexContractMemberall:LifeAndAnnuityContractBenefitsMember2020-01-012020-12-310000899051all:EquityAndIndexContractMemberall:InterestCreditedToContractholderFundsMember2020-01-012020-12-310000899051all:EquityAndIndexContractMemberall:OtherCostAndExpenseOperatingMember2020-01-012020-12-310000899051all:EquityAndIndexContractMember2020-01-012020-12-310000899051us-gaap:EmbeddedDerivativeFinancialInstrumentsMemberall:RealizedCapitalGainsAndLossesMember2020-01-012020-12-310000899051all:LifeAndAnnuityContractBenefitsMemberus-gaap:EmbeddedDerivativeFinancialInstrumentsMember2020-01-012020-12-310000899051all:InterestCreditedToContractholderFundsMemberus-gaap:EmbeddedDerivativeFinancialInstrumentsMember2020-01-012020-12-310000899051all:OtherCostAndExpenseOperatingMemberus-gaap:EmbeddedDerivativeFinancialInstrumentsMember2020-01-012020-12-310000899051us-gaap:EmbeddedDerivativeFinancialInstrumentsMember2020-01-012020-12-310000899051us-gaap:ForeignExchangeContractMemberall:RealizedCapitalGainsAndLossesMember2020-01-012020-12-310000899051us-gaap:ForeignExchangeContractMemberall:LifeAndAnnuityContractBenefitsMember2020-01-012020-12-310000899051us-gaap:ForeignExchangeContractMemberall:InterestCreditedToContractholderFundsMember2020-01-012020-12-310000899051us-gaap:ForeignExchangeContractMemberall:OtherCostAndExpenseOperatingMember2020-01-012020-12-310000899051us-gaap:ForeignExchangeContractMember2020-01-012020-12-310000899051us-gaap:CreditDefaultSwapMemberall:RealizedCapitalGainsAndLossesMember2020-01-012020-12-310000899051us-gaap:CreditDefaultSwapMemberall:LifeAndAnnuityContractBenefitsMember2020-01-012020-12-310000899051us-gaap:CreditDefaultSwapMemberall:InterestCreditedToContractholderFundsMember2020-01-012020-12-310000899051us-gaap:CreditDefaultSwapMemberall:OtherCostAndExpenseOperatingMember2020-01-012020-12-310000899051us-gaap:CreditDefaultSwapMember2020-01-012020-12-310000899051all:TotalReturnSwapFixedIncomeMemberall:RealizedCapitalGainsAndLossesMember2020-01-012020-12-310000899051all:TotalReturnSwapFixedIncomeMemberall:LifeAndAnnuityContractBenefitsMember2020-01-012020-12-310000899051all:TotalReturnSwapFixedIncomeMemberall:InterestCreditedToContractholderFundsMember2020-01-012020-12-310000899051all:TotalReturnSwapFixedIncomeMemberall:OtherCostAndExpenseOperatingMember2020-01-012020-12-310000899051all:TotalReturnSwapFixedIncomeMember2020-01-012020-12-310000899051all:TotalReturnSwapEquityMemberall:RealizedCapitalGainsAndLossesMember2020-01-012020-12-310000899051all:TotalReturnSwapEquityMemberall:LifeAndAnnuityContractBenefitsMember2020-01-012020-12-310000899051all:TotalReturnSwapEquityMemberall:InterestCreditedToContractholderFundsMember2020-01-012020-12-310000899051all:TotalReturnSwapEquityMemberall:OtherCostAndExpenseOperatingMember2020-01-012020-12-310000899051all:TotalReturnSwapEquityMember2020-01-012020-12-310000899051all:OtherCostAndExpenseOperatingMember2020-01-012020-12-310000899051us-gaap:InterestRateContractMemberall:RealizedCapitalGainsAndLossesMember2019-01-012019-12-310000899051us-gaap:InterestRateContractMemberall:LifeAndAnnuityContractBenefitsMember2019-01-012019-12-310000899051us-gaap:InterestRateContractMemberall:InterestCreditedToContractholderFundsMember2019-01-012019-12-310000899051us-gaap:InterestRateContractMemberall:OtherCostAndExpenseOperatingMember2019-01-012019-12-310000899051us-gaap:InterestRateContractMember2019-01-012019-12-310000899051all:EquityAndIndexContractMemberall:RealizedCapitalGainsAndLossesMember2019-01-012019-12-310000899051all:EquityAndIndexContractMemberall:LifeAndAnnuityContractBenefitsMember2019-01-012019-12-310000899051all:EquityAndIndexContractMemberall:InterestCreditedToContractholderFundsMember2019-01-012019-12-310000899051all:EquityAndIndexContractMemberall:OtherCostAndExpenseOperatingMember2019-01-012019-12-310000899051all:EquityAndIndexContractMember2019-01-012019-12-310000899051us-gaap:EmbeddedDerivativeFinancialInstrumentsMemberall:RealizedCapitalGainsAndLossesMember2019-01-012019-12-310000899051all:LifeAndAnnuityContractBenefitsMemberus-gaap:EmbeddedDerivativeFinancialInstrumentsMember2019-01-012019-12-310000899051all:InterestCreditedToContractholderFundsMemberus-gaap:EmbeddedDerivativeFinancialInstrumentsMember2019-01-012019-12-310000899051all:OtherCostAndExpenseOperatingMemberus-gaap:EmbeddedDerivativeFinancialInstrumentsMember2019-01-012019-12-310000899051us-gaap:EmbeddedDerivativeFinancialInstrumentsMember2019-01-012019-12-310000899051us-gaap:ForeignExchangeContractMemberall:RealizedCapitalGainsAndLossesMember2019-01-012019-12-310000899051us-gaap:ForeignExchangeContractMemberall:LifeAndAnnuityContractBenefitsMember2019-01-012019-12-310000899051us-gaap:ForeignExchangeContractMemberall:InterestCreditedToContractholderFundsMember2019-01-012019-12-310000899051us-gaap:ForeignExchangeContractMemberall:OtherCostAndExpenseOperatingMember2019-01-012019-12-310000899051us-gaap:ForeignExchangeContractMember2019-01-012019-12-310000899051us-gaap:CreditDefaultSwapMemberall:RealizedCapitalGainsAndLossesMember2019-01-012019-12-310000899051us-gaap:CreditDefaultSwapMemberall:LifeAndAnnuityContractBenefitsMember2019-01-012019-12-310000899051us-gaap:CreditDefaultSwapMemberall:InterestCreditedToContractholderFundsMember2019-01-012019-12-310000899051us-gaap:CreditDefaultSwapMemberall:OtherCostAndExpenseOperatingMember2019-01-012019-12-310000899051us-gaap:CreditDefaultSwapMember2019-01-012019-12-310000899051all:TotalReturnSwapFixedIncomeMemberall:RealizedCapitalGainsAndLossesMember2019-01-012019-12-310000899051all:TotalReturnSwapFixedIncomeMemberall:LifeAndAnnuityContractBenefitsMember2019-01-012019-12-310000899051all:TotalReturnSwapFixedIncomeMemberall:InterestCreditedToContractholderFundsMember2019-01-012019-12-310000899051all:TotalReturnSwapFixedIncomeMemberall:OtherCostAndExpenseOperatingMember2019-01-012019-12-310000899051all:TotalReturnSwapFixedIncomeMember2019-01-012019-12-310000899051all:TotalReturnSwapEquityMemberall:RealizedCapitalGainsAndLossesMember2019-01-012019-12-310000899051all:TotalReturnSwapEquityMemberall:LifeAndAnnuityContractBenefitsMember2019-01-012019-12-310000899051all:TotalReturnSwapEquityMemberall:InterestCreditedToContractholderFundsMember2019-01-012019-12-310000899051all:TotalReturnSwapEquityMemberall:OtherCostAndExpenseOperatingMember2019-01-012019-12-310000899051all:TotalReturnSwapEquityMember2019-01-012019-12-310000899051all:OtherCostAndExpenseOperatingMember2019-01-012019-12-310000899051us-gaap:InterestRateContractMemberall:RealizedCapitalGainsAndLossesMember2018-01-012018-12-310000899051us-gaap:InterestRateContractMemberall:LifeAndAnnuityContractBenefitsMember2018-01-012018-12-310000899051us-gaap:InterestRateContractMemberall:InterestCreditedToContractholderFundsMember2018-01-012018-12-310000899051us-gaap:InterestRateContractMemberall:OtherCostAndExpenseOperatingMember2018-01-012018-12-310000899051us-gaap:InterestRateContractMember2018-01-012018-12-310000899051all:EquityAndIndexContractMemberall:RealizedCapitalGainsAndLossesMember2018-01-012018-12-310000899051all:EquityAndIndexContractMemberall:LifeAndAnnuityContractBenefitsMember2018-01-012018-12-310000899051all:EquityAndIndexContractMemberall:InterestCreditedToContractholderFundsMember2018-01-012018-12-310000899051all:EquityAndIndexContractMemberall:OtherCostAndExpenseOperatingMember2018-01-012018-12-310000899051all:EquityAndIndexContractMember2018-01-012018-12-310000899051us-gaap:EmbeddedDerivativeFinancialInstrumentsMemberall:RealizedCapitalGainsAndLossesMember2018-01-012018-12-310000899051all:LifeAndAnnuityContractBenefitsMemberus-gaap:EmbeddedDerivativeFinancialInstrumentsMember2018-01-012018-12-310000899051all:InterestCreditedToContractholderFundsMemberus-gaap:EmbeddedDerivativeFinancialInstrumentsMember2018-01-012018-12-310000899051all:OtherCostAndExpenseOperatingMemberus-gaap:EmbeddedDerivativeFinancialInstrumentsMember2018-01-012018-12-310000899051us-gaap:EmbeddedDerivativeFinancialInstrumentsMember2018-01-012018-12-310000899051us-gaap:ForeignExchangeContractMemberall:RealizedCapitalGainsAndLossesMember2018-01-012018-12-310000899051us-gaap:ForeignExchangeContractMemberall:LifeAndAnnuityContractBenefitsMember2018-01-012018-12-310000899051us-gaap:ForeignExchangeContractMemberall:InterestCreditedToContractholderFundsMember2018-01-012018-12-310000899051us-gaap:ForeignExchangeContractMemberall:OtherCostAndExpenseOperatingMember2018-01-012018-12-310000899051us-gaap:ForeignExchangeContractMember2018-01-012018-12-310000899051us-gaap:CreditDefaultSwapMemberall:RealizedCapitalGainsAndLossesMember2018-01-012018-12-310000899051us-gaap:CreditDefaultSwapMemberall:LifeAndAnnuityContractBenefitsMember2018-01-012018-12-310000899051us-gaap:CreditDefaultSwapMemberall:InterestCreditedToContractholderFundsMember2018-01-012018-12-310000899051us-gaap:CreditDefaultSwapMemberall:OtherCostAndExpenseOperatingMember2018-01-012018-12-310000899051us-gaap:CreditDefaultSwapMember2018-01-012018-12-310000899051all:TotalReturnSwapFixedIncomeMemberall:RealizedCapitalGainsAndLossesMember2018-01-012018-12-310000899051all:TotalReturnSwapFixedIncomeMemberall:LifeAndAnnuityContractBenefitsMember2018-01-012018-12-310000899051all:TotalReturnSwapFixedIncomeMemberall:InterestCreditedToContractholderFundsMember2018-01-012018-12-310000899051all:TotalReturnSwapFixedIncomeMemberall:OtherCostAndExpenseOperatingMember2018-01-012018-12-310000899051all:TotalReturnSwapFixedIncomeMember2018-01-012018-12-310000899051all:TotalReturnSwapEquityMemberall:RealizedCapitalGainsAndLossesMember2018-01-012018-12-310000899051all:TotalReturnSwapEquityMemberall:LifeAndAnnuityContractBenefitsMember2018-01-012018-12-310000899051all:TotalReturnSwapEquityMemberall:InterestCreditedToContractholderFundsMember2018-01-012018-12-310000899051all:TotalReturnSwapEquityMemberall:OtherCostAndExpenseOperatingMember2018-01-012018-12-310000899051all:TotalReturnSwapEquityMember2018-01-012018-12-310000899051all:OtherCostAndExpenseOperatingMember2018-01-012018-12-31all:counter-party0000899051srt:StandardPoorsAPlusRatingMember2020-12-310000899051srt:StandardPoorsAPlusRatingMember2019-12-310000899051us-gaap:CreditDefaultSwapMembersrt:StandardPoorsAAARatingMemberus-gaap:CorporateDebtSecuritiesMemberall:SingleNameMember2020-12-310000899051us-gaap:CreditDefaultSwapMemberus-gaap:CorporateDebtSecuritiesMembersrt:StandardPoorsAARatingMemberall:SingleNameMember2020-12-310000899051us-gaap:CreditDefaultSwapMemberus-gaap:CorporateDebtSecuritiesMembersrt:StandardPoorsARatingMemberall:SingleNameMember2020-12-310000899051us-gaap:CreditDefaultSwapMemberus-gaap:CorporateDebtSecuritiesMembersrt:StandardPoorsBBBRatingMemberall:SingleNameMember2020-12-310000899051us-gaap:CreditDefaultSwapMemberus-gaap:CorporateDebtSecuritiesMemberall:StandardPoorsBBAndLowerRatingMemberall:SingleNameMember2020-12-310000899051us-gaap:CreditDefaultSwapMemberus-gaap:CorporateDebtSecuritiesMemberall:SingleNameMember2020-12-310000899051us-gaap:CreditDefaultSwapMemberall:IndexMembersrt:StandardPoorsAAARatingMemberus-gaap:CorporateDebtSecuritiesMember2020-12-310000899051us-gaap:CreditDefaultSwapMemberall:IndexMemberus-gaap:CorporateDebtSecuritiesMembersrt:StandardPoorsAARatingMember2020-12-310000899051us-gaap:CreditDefaultSwapMemberall:IndexMemberus-gaap:CorporateDebtSecuritiesMembersrt:StandardPoorsARatingMember2020-12-310000899051us-gaap:CreditDefaultSwapMemberall:IndexMemberus-gaap:CorporateDebtSecuritiesMembersrt:StandardPoorsBBBRatingMember2020-12-310000899051us-gaap:CreditDefaultSwapMemberall:IndexMemberus-gaap:CorporateDebtSecuritiesMemberall:StandardPoorsBBAndLowerRatingMember2020-12-310000899051us-gaap:CreditDefaultSwapMemberall:IndexMemberus-gaap:CorporateDebtSecuritiesMember2020-12-310000899051us-gaap:CreditDefaultSwapMembersrt:StandardPoorsAAARatingMember2020-12-310000899051us-gaap:CreditDefaultSwapMembersrt:StandardPoorsAARatingMember2020-12-310000899051us-gaap:CreditDefaultSwapMembersrt:StandardPoorsARatingMember2020-12-310000899051us-gaap:CreditDefaultSwapMembersrt:StandardPoorsBBBRatingMember2020-12-310000899051us-gaap:CreditDefaultSwapMemberall:StandardPoorsBBAndLowerRatingMember2020-12-310000899051us-gaap:CreditDefaultSwapMember2020-12-310000899051us-gaap:CreditDefaultSwapMembersrt:StandardPoorsAAARatingMemberus-gaap:CorporateDebtSecuritiesMemberall:SingleNameMember2019-12-310000899051us-gaap:CreditDefaultSwapMemberus-gaap:CorporateDebtSecuritiesMembersrt:StandardPoorsAARatingMemberall:SingleNameMember2019-12-310000899051us-gaap:CreditDefaultSwapMemberus-gaap:CorporateDebtSecuritiesMembersrt:StandardPoorsARatingMemberall:SingleNameMember2019-12-310000899051us-gaap:CreditDefaultSwapMemberus-gaap:CorporateDebtSecuritiesMembersrt:StandardPoorsBBBRatingMemberall:SingleNameMember2019-12-310000899051us-gaap:CreditDefaultSwapMemberus-gaap:CorporateDebtSecuritiesMemberall:StandardPoorsBBAndLowerRatingMemberall:SingleNameMember2019-12-310000899051us-gaap:CreditDefaultSwapMemberus-gaap:CorporateDebtSecuritiesMemberall:SingleNameMember2019-12-310000899051us-gaap:CreditDefaultSwapMembersrt:StandardPoorsAAARatingMember2019-12-310000899051us-gaap:CreditDefaultSwapMembersrt:StandardPoorsAARatingMember2019-12-310000899051us-gaap:CreditDefaultSwapMembersrt:StandardPoorsARatingMember2019-12-310000899051us-gaap:CreditDefaultSwapMembersrt:StandardPoorsBBBRatingMember2019-12-310000899051us-gaap:CreditDefaultSwapMemberall:StandardPoorsBBAndLowerRatingMember2019-12-310000899051us-gaap:CreditDefaultSwapMember2019-12-310000899051all:PropertyLiabilityMember2018-12-310000899051all:PropertyLiabilityMember2017-12-310000899051all:AutoInsuranceLiabilityCoverageMember2020-01-012020-12-310000899051all:AutoInsurancePhysicalDamageCoverageMember2020-01-012020-12-310000899051all:HomeOwnersMember2020-01-012020-12-310000899051all:AutoandHomeownersInsuranceMember2020-01-012020-12-310000899051all:OtherPersonalLinesMember2020-01-012020-12-310000899051us-gaap:PropertyAndCasualtyCommercialInsuranceProductLineMember2020-01-012020-12-310000899051all:ProtectionServicesMember2020-01-012020-12-310000899051all:UnallocatedLossAdjustmentExpensesMember2020-01-012020-12-310000899051all:ShortDurationInsuranceContractsAccidentYearBefore2016Member2020-01-012020-12-310000899051us-gaap:OtherInsuranceProductLineMember2020-01-012020-12-310000899051us-gaap:CatastropheMember2020-01-012020-12-310000899051us-gaap:CatastropheMember2019-01-012019-12-310000899051us-gaap:CatastropheMember2018-01-012018-12-310000899051all:AutoMemberall:NonCatastropheReestimatesMember2020-01-012020-12-310000899051all:AutoMemberall:NonCatastropheReestimatesMember2019-01-012019-12-310000899051all:AutoMemberall:NonCatastropheReestimatesMember2018-01-012018-12-310000899051all:AutoMemberus-gaap:CatastropheMember2020-01-012020-12-310000899051all:AutoMemberus-gaap:CatastropheMember2019-01-012019-12-310000899051all:AutoMemberus-gaap:CatastropheMember2018-01-012018-12-310000899051all:AutoMember2020-01-012020-12-310000899051all:AutoMember2019-01-012019-12-310000899051all:AutoMember2018-01-012018-12-310000899051all:HomeOwnersMemberall:NonCatastropheReestimatesMember2020-01-012020-12-310000899051all:HomeOwnersMemberall:NonCatastropheReestimatesMember2019-01-012019-12-310000899051all:HomeOwnersMemberall:NonCatastropheReestimatesMember2018-01-012018-12-310000899051all:HomeOwnersMemberus-gaap:CatastropheMember2020-01-012020-12-310000899051all:HomeOwnersMemberus-gaap:CatastropheMember2019-01-012019-12-310000899051all:HomeOwnersMemberus-gaap:CatastropheMember2018-01-012018-12-310000899051all:HomeOwnersMember2019-01-012019-12-310000899051all:HomeOwnersMember2018-01-012018-12-310000899051all:NonCatastropheReestimatesMemberall:OtherPersonalLinesMember2020-01-012020-12-310000899051all:NonCatastropheReestimatesMemberall:OtherPersonalLinesMember2019-01-012019-12-310000899051all:NonCatastropheReestimatesMemberall:OtherPersonalLinesMember2018-01-012018-12-310000899051all:OtherPersonalLinesMemberus-gaap:CatastropheMember2020-01-012020-12-310000899051all:OtherPersonalLinesMemberus-gaap:CatastropheMember2019-01-012019-12-310000899051all:OtherPersonalLinesMemberus-gaap:CatastropheMember2018-01-012018-12-310000899051all:OtherPersonalLinesMember2019-01-012019-12-310000899051all:OtherPersonalLinesMember2018-01-012018-12-310000899051all:NonCatastropheReestimatesMemberus-gaap:PropertyAndCasualtyCommercialInsuranceProductLineMember2020-01-012020-12-310000899051all:NonCatastropheReestimatesMemberus-gaap:PropertyAndCasualtyCommercialInsuranceProductLineMember2019-01-012019-12-310000899051all:NonCatastropheReestimatesMemberus-gaap:PropertyAndCasualtyCommercialInsuranceProductLineMember2018-01-012018-12-310000899051us-gaap:CatastropheMemberus-gaap:PropertyAndCasualtyCommercialInsuranceProductLineMember2020-01-012020-12-310000899051us-gaap:CatastropheMemberus-gaap:PropertyAndCasualtyCommercialInsuranceProductLineMember2019-01-012019-12-310000899051us-gaap:CatastropheMemberus-gaap:PropertyAndCasualtyCommercialInsuranceProductLineMember2018-01-012018-12-310000899051us-gaap:PropertyAndCasualtyCommercialInsuranceProductLineMember2019-01-012019-12-310000899051us-gaap:PropertyAndCasualtyCommercialInsuranceProductLineMember2018-01-012018-12-310000899051all:DiscontinuedLinesAndCoveragesMemberall:NonCatastropheReestimatesMember2020-01-012020-12-310000899051all:DiscontinuedLinesAndCoveragesMemberall:NonCatastropheReestimatesMember2019-01-012019-12-310000899051all:DiscontinuedLinesAndCoveragesMemberall:NonCatastropheReestimatesMember2018-01-012018-12-310000899051all:DiscontinuedLinesAndCoveragesMemberus-gaap:CatastropheMember2020-01-012020-12-310000899051all:DiscontinuedLinesAndCoveragesMemberus-gaap:CatastropheMember2019-01-012019-12-310000899051all:DiscontinuedLinesAndCoveragesMemberus-gaap:CatastropheMember2018-01-012018-12-310000899051all:DiscontinuedLinesAndCoveragesMember2020-01-012020-12-310000899051all:DiscontinuedLinesAndCoveragesMember2019-01-012019-12-310000899051all:DiscontinuedLinesAndCoveragesMember2018-01-012018-12-310000899051all:CommercialLinesDiscontinuedLinesandCoveragesandOtherPersonalLinesMemberall:NonCatastropheReestimatesMember2020-01-012020-12-310000899051all:CommercialLinesDiscontinuedLinesandCoveragesandOtherPersonalLinesMemberall:NonCatastropheReestimatesMember2019-01-012019-12-310000899051all:CommercialLinesDiscontinuedLinesandCoveragesandOtherPersonalLinesMemberall:NonCatastropheReestimatesMember2018-01-012018-12-310000899051all:CommercialLinesDiscontinuedLinesandCoveragesandOtherPersonalLinesMemberus-gaap:CatastropheMember2020-01-012020-12-310000899051all:CommercialLinesDiscontinuedLinesandCoveragesandOtherPersonalLinesMemberus-gaap:CatastropheMember2019-01-012019-12-310000899051all:CommercialLinesDiscontinuedLinesandCoveragesandOtherPersonalLinesMemberus-gaap:CatastropheMember2018-01-012018-12-310000899051all:CommercialLinesDiscontinuedLinesandCoveragesandOtherPersonalLinesMember2020-01-012020-12-310000899051all:CommercialLinesDiscontinuedLinesandCoveragesandOtherPersonalLinesMember2019-01-012019-12-310000899051all:CommercialLinesDiscontinuedLinesandCoveragesandOtherPersonalLinesMember2018-01-012018-12-310000899051all:NonCatastropheReestimatesMember2020-01-012020-12-310000899051all:NonCatastropheReestimatesMember2019-01-012019-12-310000899051all:NonCatastropheReestimatesMember2018-01-012018-12-310000899051all:DiscontinuedLinesAndCoveragesMemberall:AnnualReserveReviewMember2020-01-012020-12-310000899051us-gaap:CatastropheMember2020-07-012020-09-30all:settlement0000899051us-gaap:CatastropheMember2020-09-300000899051us-gaap:FireMemberall:PacificGasAndElectricMember2020-06-200000899051us-gaap:FireMemberall:PacificGasAndElectricMember2020-07-012020-07-0100008990512020-07-010000899051us-gaap:FireMemberall:SouthernCaliforniaEdisonMember2020-09-140000899051us-gaap:FireMemberall:SouthernCaliforniaEdisonMember2020-09-142020-09-140000899051us-gaap:FireMemberall:SouthernCaliforniaEdisonMemberus-gaap:SubsequentEventMember2021-01-220000899051us-gaap:FireMembersrt:ScenarioForecastMemberall:SouthernCaliforniaEdisonMember2021-01-012021-03-310000899051all:AutoInsuranceLiabilityCoverageMemberus-gaap:ShortdurationInsuranceContractsAccidentYear2016Member2016-12-310000899051all:AutoInsuranceLiabilityCoverageMemberus-gaap:ShortdurationInsuranceContractsAccidentYear2016Member2017-12-310000899051all:AutoInsuranceLiabilityCoverageMemberus-gaap:ShortdurationInsuranceContractsAccidentYear2016Member2018-12-310000899051all:AutoInsuranceLiabilityCoverageMemberus-gaap:ShortdurationInsuranceContractsAccidentYear2016Member2019-12-310000899051all:AutoInsuranceLiabilityCoverageMemberus-gaap:ShortdurationInsuranceContractsAccidentYear2016Member2020-12-310000899051all:AutoInsuranceLiabilityCoverageMemberus-gaap:ShortdurationInsuranceContractsAccidentYear2016Member2020-01-012020-12-31all:claim0000899051all:AutoInsuranceLiabilityCoverageMemberus-gaap:ShortDurationInsuranceContractsAccidentYear2017Member2017-12-310000899051all:AutoInsuranceLiabilityCoverageMemberus-gaap:ShortDurationInsuranceContractsAccidentYear2017Member2018-12-310000899051all:AutoInsuranceLiabilityCoverageMemberus-gaap:ShortDurationInsuranceContractsAccidentYear2017Member2019-12-310000899051all:AutoInsuranceLiabilityCoverageMemberus-gaap:ShortDurationInsuranceContractsAccidentYear2017Member2020-12-310000899051all:AutoInsuranceLiabilityCoverageMemberus-gaap:ShortDurationInsuranceContractsAccidentYear2017Member2020-01-012020-12-310000899051us-gaap:ShortDurationInsuranceContractsAccidentYear2018Memberall:AutoInsuranceLiabilityCoverageMember2018-12-310000899051us-gaap:ShortDurationInsuranceContractsAccidentYear2018Memberall:AutoInsuranceLiabilityCoverageMember2019-12-310000899051us-gaap:ShortDurationInsuranceContractsAccidentYear2018Memberall:AutoInsuranceLiabilityCoverageMember2020-12-310000899051us-gaap:ShortDurationInsuranceContractsAccidentYear2018Memberall:AutoInsuranceLiabilityCoverageMember2020-01-012020-12-310000899051all:ShortDurationInsuranceContractsAccidentYear2019Memberall:AutoInsuranceLiabilityCoverageMember2019-12-310000899051all:ShortDurationInsuranceContractsAccidentYear2019Memberall:AutoInsuranceLiabilityCoverageMember2020-12-310000899051all:ShortDurationInsuranceContractsAccidentYear2019Memberall:AutoInsuranceLiabilityCoverageMember2020-01-012020-12-310000899051us-gaap:ShortDurationInsuranceContractAccidentYear2020Memberall:AutoInsuranceLiabilityCoverageMember2020-12-310000899051all:AutoInsuranceLiabilityCoverageMember2020-12-310000899051all:AutoInsuranceLiabilityCoverageMemberall:ShortDurationInsuranceContractsAccidentYearBefore2016Member2020-01-012020-12-310000899051all:UnallocatedLossAdjustmentExpensesMemberall:AutoInsuranceLiabilityCoverageMember2020-01-012020-12-310000899051all:OtherReserveReestimatesMemberall:AutoInsuranceLiabilityCoverageMember2020-01-012020-12-310000899051all:AutoInsurancePhysicalDamageCoverageMemberus-gaap:ShortdurationInsuranceContractsAccidentYear2016Member2016-12-310000899051all:AutoInsurancePhysicalDamageCoverageMemberus-gaap:ShortdurationInsuranceContractsAccidentYear2016Member2017-12-310000899051all:AutoInsurancePhysicalDamageCoverageMemberus-gaap:ShortdurationInsuranceContractsAccidentYear2016Member2018-12-310000899051all:AutoInsurancePhysicalDamageCoverageMemberus-gaap:ShortdurationInsuranceContractsAccidentYear2016Member2019-12-310000899051all:AutoInsurancePhysicalDamageCoverageMemberus-gaap:ShortdurationInsuranceContractsAccidentYear2016Member2020-12-310000899051all:AutoInsurancePhysicalDamageCoverageMemberus-gaap:ShortdurationInsuranceContractsAccidentYear2016Member2020-01-012020-12-310000899051all:AutoInsurancePhysicalDamageCoverageMemberus-gaap:ShortDurationInsuranceContractsAccidentYear2017Member2017-12-310000899051all:AutoInsurancePhysicalDamageCoverageMemberus-gaap:ShortDurationInsuranceContractsAccidentYear2017Member2018-12-310000899051all:AutoInsurancePhysicalDamageCoverageMemberus-gaap:ShortDurationInsuranceContractsAccidentYear2017Member2019-12-310000899051all:AutoInsurancePhysicalDamageCoverageMemberus-gaap:ShortDurationInsuranceContractsAccidentYear2017Member2020-12-310000899051all:AutoInsurancePhysicalDamageCoverageMemberus-gaap:ShortDurationInsuranceContractsAccidentYear2017Member2020-01-012020-12-310000899051all:AutoInsurancePhysicalDamageCoverageMemberus-gaap:ShortDurationInsuranceContractsAccidentYear2018Member2018-12-310000899051all:AutoInsurancePhysicalDamageCoverageMemberus-gaap:ShortDurationInsuranceContractsAccidentYear2018Member2019-12-310000899051all:AutoInsurancePhysicalDamageCoverageMemberus-gaap:ShortDurationInsuranceContractsAccidentYear2018Member2020-12-310000899051all:AutoInsurancePhysicalDamageCoverageMemberus-gaap:ShortDurationInsuranceContractsAccidentYear2018Member2020-01-012020-12-310000899051all:ShortDurationInsuranceContractsAccidentYear2019Memberall:AutoInsurancePhysicalDamageCoverageMember2019-12-310000899051all:ShortDurationInsuranceContractsAccidentYear2019Memberall:AutoInsurancePhysicalDamageCoverageMember2020-12-310000899051all:ShortDurationInsuranceContractsAccidentYear2019Memberall:AutoInsurancePhysicalDamageCoverageMember2020-01-012020-12-310000899051us-gaap:ShortDurationInsuranceContractAccidentYear2020Memberall:AutoInsurancePhysicalDamageCoverageMember2020-12-310000899051all:AutoInsurancePhysicalDamageCoverageMember2020-12-310000899051all:AutoInsurancePhysicalDamageCoverageMemberall:ShortDurationInsuranceContractsAccidentYearBefore2016Member2020-01-012020-12-310000899051all:UnallocatedLossAdjustmentExpensesMemberall:AutoInsurancePhysicalDamageCoverageMember2020-01-012020-12-310000899051all:AutoInsurancePhysicalDamageCoverageMemberall:OtherReserveReestimatesMember2020-01-012020-12-310000899051all:HomeOwnersMemberus-gaap:ShortdurationInsuranceContractsAccidentYear2016Member2016-12-310000899051all:HomeOwnersMemberus-gaap:ShortdurationInsuranceContractsAccidentYear2016Member2017-12-310000899051all:HomeOwnersMemberus-gaap:ShortdurationInsuranceContractsAccidentYear2016Member2018-12-310000899051all:HomeOwnersMemberus-gaap:ShortdurationInsuranceContractsAccidentYear2016Member2019-12-310000899051all:HomeOwnersMemberus-gaap:ShortdurationInsuranceContractsAccidentYear2016Member2020-12-310000899051all:HomeOwnersMemberus-gaap:ShortdurationInsuranceContractsAccidentYear2016Member2020-01-012020-12-310000899051all:HomeOwnersMemberus-gaap:ShortDurationInsuranceContractsAccidentYear2017Member2017-12-310000899051all:HomeOwnersMemberus-gaap:ShortDurationInsuranceContractsAccidentYear2017Member2018-12-310000899051all:HomeOwnersMemberus-gaap:ShortDurationInsuranceContractsAccidentYear2017Member2019-12-310000899051all:HomeOwnersMemberus-gaap:ShortDurationInsuranceContractsAccidentYear2017Member2020-12-310000899051all:HomeOwnersMemberus-gaap:ShortDurationInsuranceContractsAccidentYear2017Member2020-01-012020-12-310000899051all:HomeOwnersMemberus-gaap:ShortDurationInsuranceContractsAccidentYear2018Member2018-12-310000899051all:HomeOwnersMemberus-gaap:ShortDurationInsuranceContractsAccidentYear2018Member2019-12-310000899051all:HomeOwnersMemberus-gaap:ShortDurationInsuranceContractsAccidentYear2018Member2020-12-310000899051all:HomeOwnersMemberus-gaap:ShortDurationInsuranceContractsAccidentYear2018Member2020-01-012020-12-310000899051all:ShortDurationInsuranceContractsAccidentYear2019Memberall:HomeOwnersMember2019-12-310000899051all:ShortDurationInsuranceContractsAccidentYear2019Memberall:HomeOwnersMember2020-12-310000899051all:ShortDurationInsuranceContractsAccidentYear2019Memberall:HomeOwnersMember2020-01-012020-12-310000899051us-gaap:ShortDurationInsuranceContractAccidentYear2020Memberall:HomeOwnersMember2020-12-310000899051all:HomeOwnersMember2020-12-310000899051all:HomeOwnersMemberall:ShortDurationInsuranceContractsAccidentYearBefore2016Member2020-01-012020-12-310000899051all:UnallocatedLossAdjustmentExpensesMemberall:HomeOwnersMember2020-01-012020-12-310000899051all:HomeOwnersMemberall:OtherReserveReestimatesMember2020-01-012020-12-310000899051all:OtherPersonalLinesMember2020-12-310000899051us-gaap:PropertyAndCasualtyCommercialInsuranceProductLineMember2020-12-310000899051all:ProtectionServicesMember2020-12-310000899051all:DiscontinuedLinesAndCoveragesMember2020-12-310000899051all:StructuredSettlementAnnuitiesMember2020-12-310000899051all:StructuredSettlementAnnuitiesMember2019-12-310000899051all:OtherImmediateFixedAnnuitiesMember2020-12-310000899051all:OtherImmediateFixedAnnuitiesMember2019-12-310000899051all:TraditionalLifeInsuranceMember2020-12-310000899051all:TraditionalLifeInsuranceMember2019-12-310000899051all:AccidentAndHealthInsuranceMember2020-12-310000899051all:AccidentAndHealthInsuranceMember2019-12-310000899051all:OtherLifeContingentProductsMember2020-12-310000899051all:OtherLifeContingentProductsMember2019-12-310000899051all:StructuredSettlementAnnuitiesMembersrt:MinimumMember2020-01-012020-12-310000899051all:OtherImmediateFixedAnnuitiesMembersrt:MinimumMember2020-01-012020-12-310000899051srt:MinimumMemberall:TraditionalLifeInsuranceMember2020-01-012020-12-310000899051srt:MaximumMemberall:TraditionalLifeInsuranceMember2020-01-012020-12-310000899051srt:MinimumMemberall:AccidentAndHealthInsuranceMember2020-01-012020-12-310000899051srt:MaximumMemberall:AccidentAndHealthInsuranceMember2020-01-012020-12-310000899051srt:MinimumMemberall:OtherLifeContingentProductsMember2020-01-012020-12-310000899051srt:MaximumMemberall:OtherLifeContingentProductsMember2020-01-012020-12-310000899051all:InterestSensitiveLifeInsuranceMember2020-12-310000899051all:InterestSensitiveLifeInsuranceMember2019-12-310000899051all:FixedAnnuitiesMember2020-12-310000899051all:FixedAnnuitiesMember2019-12-310000899051all:OtherInvestmentContractsMember2020-12-310000899051all:OtherInvestmentContractsMember2019-12-310000899051srt:MinimumMemberall:EquityIndexedLifeInsuranceMember2020-01-012020-12-310000899051srt:MaximumMemberall:EquityIndexedLifeInsuranceMember2020-01-012020-12-310000899051all:OtherLifeInsuranceMembersrt:MinimumMember2020-01-012020-12-310000899051all:OtherLifeInsuranceMembersrt:MaximumMember2020-01-012020-12-310000899051srt:MinimumMemberall:ImmediateFixedAnnuitiesMember2020-01-012020-12-310000899051srt:MaximumMemberall:ImmediateFixedAnnuitiesMember2020-01-012020-12-310000899051all:EquityIndexedFixedAnnuitiesMembersrt:MinimumMember2020-01-012020-12-310000899051srt:MaximumMemberall:EquityIndexedFixedAnnuitiesMember2020-01-012020-12-310000899051all:OtherFixedAnnuitiesMembersrt:MinimumMember2020-01-012020-12-310000899051all:OtherFixedAnnuitiesMembersrt:MaximumMember2020-01-012020-12-310000899051srt:MinimumMemberall:OtherInvestmentContractsMember2020-01-012020-12-310000899051srt:MaximumMemberall:OtherInvestmentContractsMember2020-01-012020-12-310000899051all:VariableAnnuitiesMember2020-12-310000899051all:VariableAnnuitiesMember2019-12-310000899051all:VariableAnnuitiesMemberus-gaap:GuaranteedMinimumDeathBenefitMember2020-12-310000899051all:VariableAnnuitiesMemberus-gaap:GuaranteedMinimumDeathBenefitMember2019-12-310000899051all:VariableAnnuitiesMemberus-gaap:GuaranteedMinimumDeathBenefitMember2020-01-012020-12-310000899051all:VariableAnnuitiesMemberus-gaap:GuaranteedMinimumDeathBenefitMember2019-01-012019-12-310000899051all:VariableAnnuitiesMemberus-gaap:GuaranteedMinimumIncomeBenefitMember2020-12-310000899051all:VariableAnnuitiesMemberus-gaap:GuaranteedMinimumIncomeBenefitMember2019-12-310000899051us-gaap:GuaranteedLifetimeWithdrawalBenefitMemberall:VariableAnnuitiesMember2020-12-310000899051us-gaap:GuaranteedLifetimeWithdrawalBenefitMemberall:VariableAnnuitiesMember2019-12-310000899051all:VariableAnnuitiesMemberus-gaap:GuaranteedMinimumAccumulationBenefitMember2020-12-310000899051all:VariableAnnuitiesMemberus-gaap:GuaranteedMinimumAccumulationBenefitMember2019-12-310000899051all:VariableAnnuitiesMemberus-gaap:GuaranteedMinimumAccumulationBenefitMember2020-01-012020-12-310000899051all:VariableAnnuitiesMemberus-gaap:GuaranteedMinimumAccumulationBenefitMember2019-01-012019-12-310000899051all:GuaranteedMinimumDeathBenefitAndInterestSensitiveLifeInsuranceGuaranteesMember2019-12-310000899051us-gaap:GuaranteedMinimumIncomeBenefitMember2019-12-310000899051all:GuaranteedAccumulationAndWithdrawalBenefitsMember2019-12-310000899051all:GuaranteedMinimumDeathBenefitAndInterestSensitiveLifeInsuranceGuaranteesMember2020-01-012020-12-310000899051us-gaap:GuaranteedMinimumIncomeBenefitMember2020-01-012020-12-310000899051all:GuaranteedAccumulationAndWithdrawalBenefitsMember2020-01-012020-12-310000899051all:GuaranteedMinimumDeathBenefitAndInterestSensitiveLifeInsuranceGuaranteesMember2020-12-310000899051us-gaap:GuaranteedMinimumIncomeBenefitMember2020-12-310000899051all:GuaranteedAccumulationAndWithdrawalBenefitsMember2020-12-310000899051all:GuaranteedMinimumDeathBenefitAndInterestSensitiveLifeInsuranceGuaranteesMember2018-12-310000899051us-gaap:GuaranteedMinimumIncomeBenefitMember2018-12-310000899051all:GuaranteedAccumulationAndWithdrawalBenefitsMember2018-12-310000899051all:GuaranteedMinimumDeathBenefitAndInterestSensitiveLifeInsuranceGuaranteesMember2019-01-012019-12-310000899051us-gaap:GuaranteedMinimumIncomeBenefitMember2019-01-012019-12-310000899051all:GuaranteedAccumulationAndWithdrawalBenefitsMember2019-01-012019-12-310000899051us-gaap:GuaranteedMinimumDeathBenefitMemberall:VariableAnnuitiesMember2020-12-310000899051us-gaap:GuaranteedMinimumDeathBenefitMemberall:VariableAnnuitiesMember2019-12-310000899051us-gaap:GuaranteedMinimumDeathBenefitMemberall:VariableAnnuitiesMember2018-12-310000899051all:VariableAnnuitiesMemberus-gaap:GuaranteedMinimumIncomeBenefitMember2020-12-310000899051all:VariableAnnuitiesMemberus-gaap:GuaranteedMinimumIncomeBenefitMember2019-12-310000899051all:VariableAnnuitiesMemberus-gaap:GuaranteedMinimumIncomeBenefitMember2018-12-310000899051all:VariableAnnuitiesMemberus-gaap:GuaranteedMinimumAccumulationBenefitMember2020-12-310000899051all:VariableAnnuitiesMemberus-gaap:GuaranteedMinimumAccumulationBenefitMember2019-12-310000899051all:VariableAnnuitiesMemberus-gaap:GuaranteedMinimumAccumulationBenefitMember2018-12-310000899051all:VariableAnnuitiesMemberus-gaap:GuaranteedLifetimeWithdrawalBenefitMember2020-12-310000899051all:VariableAnnuitiesMemberus-gaap:GuaranteedLifetimeWithdrawalBenefitMember2019-12-310000899051all:VariableAnnuitiesMemberus-gaap:GuaranteedLifetimeWithdrawalBenefitMember2018-12-310000899051all:VariableAnnuitiesMemberall:OtherGuaranteesMember2020-12-310000899051all:VariableAnnuitiesMemberall:OtherGuaranteesMember2019-12-310000899051all:VariableAnnuitiesMemberall:OtherGuaranteesMember2018-12-310000899051all:VariableAnnuitiesMember2018-12-310000899051us-gaap:ReinsurerConcentrationRiskMembersrt:StandardPoorsAMinusRatingMember2020-01-012020-12-310000899051us-gaap:ReinsurerConcentrationRiskMembersrt:StandardPoorsAMinusRatingMember2019-01-012019-12-310000899051all:AllstateAnnuitiesAllstateLifeAndAllstateBenefitsMember2019-12-310000899051srt:CumulativeEffectPeriodOfAdoptionAdjustmentMemberall:AllstateAnnuitiesAllstateLifeAndAllstateBenefitsMember2019-12-310000899051all:AllstateAnnuitiesAllstateLifeAndAllstateBenefitsMember2020-01-012020-12-310000899051all:AllstateAnnuitiesAllstateLifeAndAllstateBenefitsMember2020-12-310000899051all:MichiganCatastrophicClaimAssociationMember2020-12-310000899051all:MichiganCatastrophicClaimAssociationMember2019-12-310000899051all:MichiganCatastrophicClaimAssociationMember2020-01-012020-12-310000899051all:MichiganCatastrophicClaimAssociationMemberus-gaap:SubsequentEventMember2020-07-012022-06-300000899051all:MichiganCatastrophicClaimAssociationMember2018-07-012020-06-300000899051all:MichiganCatastrophicClaimAssociationMember2020-06-300000899051all:MichiganCatastrophicClaimAssociationMember2020-01-012020-06-300000899051all:NewJerseyUnsatisfiedClaimJudgmentFundMember2020-01-012020-12-310000899051all:NewJerseyUnsatisfiedClaimJudgmentFundMember2020-12-310000899051all:NewJerseyUnsatisfiedClaimJudgmentFundMember2019-12-310000899051all:PLGIAMember2020-12-310000899051all:NorthCarolinaReinsuranceFacilityMember2020-09-300000899051all:NorthCarolinaReinsuranceFacilityMember2019-10-012020-09-300000899051all:PrivatePassengerAutoRiskRecoupmentMemberall:NorthCarolinaReinsuranceFacilityMember2019-10-012020-09-300000899051all:NorthCarolinaReinsuranceFacilityMemberall:MemberLossRecoupmentsMember2019-10-012020-09-300000899051all:NorthCarolinaReinsuranceFacilityMember2020-12-310000899051all:FloridaHurricaneCatastropheFundMember2020-12-310000899051all:FloridaHurricaneCatastropheFundMember2018-01-012018-12-310000899051all:FloridaHurricaneCatastropheFundMember2020-01-012020-12-310000899051all:FloridaHurricaneCatastropheFundMember2019-01-012019-12-310000899051all:FloridaHurricaneCatastropheFundMember2018-01-012018-12-310000899051all:FloridaHurricaneCatastropheFundMember2019-06-012020-05-31all:hurricane0000899051all:FloridaHurricaneCatastropheFundMember2020-12-310000899051all:FloridaHurricaneCatastropheFundMember2019-12-310000899051all:NationalFloodInsuranceProgramMember2020-12-310000899051all:NationalFloodInsuranceProgramMember2019-12-310000899051all:NationalFloodInsuranceProgramMember2020-01-012020-12-310000899051all:NationalFloodInsuranceProgramMember2019-01-012019-12-310000899051all:NationalFloodInsuranceProgramMember2018-01-012018-12-310000899051all:CatastropheReinsuranceProgramMember2020-01-012020-12-310000899051all:CatastropheReinsuranceProgramMemberall:TraditionalMarketMember2020-01-012020-12-31all:reinstatement0000899051all:CatastropheReinsuranceProgramMemberall:ContractOneMember2020-01-012020-12-310000899051all:CatastropheReinsuranceProgramMemberall:ContractTwoMember2020-01-012020-12-310000899051all:CatastropheReinsuranceProgramMemberall:InsuranceLinkedSecuritiesMember2020-01-012020-12-310000899051all:CatastropheReinsuranceProgramMembersrt:MinimumMember2020-01-012020-12-310000899051all:CatastropheReinsuranceProgramMembersrt:MaximumMember2020-01-012020-12-310000899051all:NewJerseyAgreementMember2020-01-012020-12-310000899051all:KentuckyAgreementMember2020-01-012020-12-310000899051all:FloridaHurricaneCatastropheFundMemberall:InsuranceLinkedSecuritiesMember2020-01-012020-12-310000899051all:CatastropheReinsuranceProgramMember2019-01-012019-12-310000899051all:CatastropheReinsuranceProgramMember2018-01-012018-12-310000899051all:LloydsOfLondonMember2020-12-310000899051all:LloydsOfLondonMember2019-12-310000899051all:AlekaInsuranceIncMember2020-01-012020-12-310000899051all:AlekaInsuranceIncMember2019-01-012019-12-310000899051all:AllstateFinancialMember2020-01-012020-12-31all:reinsurer0000899051all:AllstateFinancialMemberall:SingleLifeInsuranceMember2015-04-012020-12-310000899051all:AllstateFinancialMemberall:SingleLifeInsuranceMember2011-04-012015-03-310000899051all:AllstateFinancialMemberall:JointLifeInsuranceMember2011-04-012015-03-310000899051all:AllstateFinancialMember2007-07-012011-03-310000899051all:AllstateFinancialMember1998-09-012007-06-300000899051all:AllstateFinancialMember1998-08-011998-08-310000899051all:AllstateFinancialMemberall:PrudentialMember2020-12-310000899051all:AllstateFinancialMemberall:PrudentialMember2019-12-310000899051all:AllstateFinancialMemberall:LifeAndAnnuityPremiumsAndContractChargesMemberall:PrudentialMember2020-01-012020-12-310000899051all:AllstateFinancialMemberall:LifeAndAnnuityPremiumsAndContractChargesMemberall:PrudentialMember2019-01-012019-12-310000899051all:AllstateFinancialMemberall:LifeAndAnnuityPremiumsAndContractChargesMemberall:PrudentialMember2018-01-012018-12-310000899051all:AllstateFinancialMemberall:LifeAndAnnuityContractBenefitsMemberall:PrudentialMember2020-01-012020-12-310000899051all:AllstateFinancialMemberall:LifeAndAnnuityContractBenefitsMemberall:PrudentialMember2019-01-012019-12-310000899051all:AllstateFinancialMemberall:LifeAndAnnuityContractBenefitsMemberall:PrudentialMember2018-01-012018-12-310000899051all:AllstateFinancialMemberall:InterestCreditedToContractholderFundsMemberall:PrudentialMember2020-01-012020-12-310000899051all:AllstateFinancialMemberall:InterestCreditedToContractholderFundsMemberall:PrudentialMember2019-01-012019-12-310000899051all:AllstateFinancialMemberall:InterestCreditedToContractholderFundsMemberall:PrudentialMember2018-01-012018-12-310000899051all:AllstateFinancialMemberall:OtherCostAndExpenseOperatingMemberall:PrudentialMember2020-01-012020-12-310000899051all:AllstateFinancialMemberall:OtherCostAndExpenseOperatingMemberall:PrudentialMember2019-01-012019-12-310000899051all:AllstateFinancialMemberall:OtherCostAndExpenseOperatingMemberall:PrudentialMember2018-01-012018-12-310000899051all:AllstateFinancialMemberall:CitigroupAndScottishReMemberall:OtherCostAndExpenseOperatingMember2020-12-310000899051all:AllstateFinancialMemberall:CitigroupAndScottishReMemberall:OtherCostAndExpenseOperatingMember2019-12-310000899051all:LincolnBenefitLifeCompanyMember2020-12-310000899051all:AllstateFinancialMember2020-12-310000899051all:SeniorNotesDue2021Member2020-12-310000899051all:SeniorNotesDue2021Member2019-12-310000899051all:SeniorNotesDue2023Member2020-12-310000899051all:SeniorNotesDue2023Member2019-12-310000899051all:SeniorNotesDue2023At3.15PercentMember2020-12-310000899051all:SeniorNotesDue2023At3.15PercentMember2019-12-310000899051all:SeniorNotesDue2025At0750PercentMember2020-12-310000899051all:SeniorNotesDue2025At0750PercentMember2019-12-310000899051all:SeniorNotesDue2026at3.28PercentMember2020-12-310000899051all:SeniorNotesDue2026at3.28PercentMember2019-12-310000899051all:SeniorNotesDue2030At145PercentMember2020-12-310000899051all:SeniorNotesDue2030At145PercentMember2019-12-310000899051all:SeniorNotesDue2032At6.125PercentMember2020-12-310000899051all:SeniorNotesDue2032At6.125PercentMember2019-12-310000899051all:SeniorNotesDue2033At5.35PercentMember2020-12-310000899051all:SeniorNotesDue2033At5.35PercentMember2019-12-310000899051all:SeniorNotesDue2035At5.55PercentMember2020-12-310000899051all:SeniorNotesDue2035At5.55PercentMember2019-12-310000899051all:SeniorNotesDue2036At5.95PercentMember2020-12-310000899051all:SeniorNotesDue2036At5.95PercentMember2019-12-310000899051all:SeniorDebenturesDue2038At6.90PercentMember2020-12-310000899051all:SeniorDebenturesDue2038At6.90PercentMember2019-12-310000899051all:SeniorNotesDue2042At5.20PercentMember2020-12-310000899051all:SeniorNotesDue2042At5.20PercentMember2019-12-310000899051all:SeniorNotesDue2043At4.50PercentMember2020-12-310000899051all:SeniorNotesDue2043At4.50PercentMember2019-12-310000899051all:SeniorNotesDue2046at4.20PercentMember2020-12-310000899051all:SeniorNotesDue2046at4.20PercentMember2019-12-310000899051all:SeniorNotesDue2049at3.85percentMember2020-12-310000899051all:SeniorNotesDue2049at3.85percentMember2019-12-310000899051all:SubordinatedDebenturesDue2053At5.10PercentMember2020-12-310000899051all:SubordinatedDebenturesDue2053At5.10PercentMember2019-12-310000899051all:SubordinatedDebenturesDue2053At5.75PercentMember2020-12-310000899051all:SubordinatedDebenturesDue2053At5.75PercentMember2019-12-310000899051all:JuniorSubordinatedDebenturesDue2067At6.50PercentMember2020-12-310000899051all:JuniorSubordinatedDebenturesDue2067At6.50PercentMember2019-12-310000899051all:SeniorNotesDue2021Member2020-01-012020-12-310000899051all:SeniorNotesDue2023Member2020-01-012020-12-310000899051us-gaap:SubordinatedDebtMember2020-12-310000899051us-gaap:SubordinatedDebtMember2020-01-012020-12-310000899051all:SubordinatedDebenturesDue2053At5.10PercentMemberus-gaap:LondonInterbankOfferedRateLIBORMember2020-01-012020-12-310000899051us-gaap:LondonInterbankOfferedRateLIBORMemberall:SubordinatedDebenturesDue2053At5.75PercentMember2020-01-012020-12-310000899051all:JuniorSubordinatedDebenturesDue2067At6.50PercentMemberus-gaap:LondonInterbankOfferedRateLIBORMember2020-01-012020-12-310000899051all:JuniorSubordinatedDebenturesDue2067At6.125PercentAndJuniorSubordinatedDebenturesDue2067At6.50PercentMember2020-01-012020-12-310000899051all:SeniorNotesDue2019At7.45PercentMember2020-01-012020-12-310000899051srt:MaximumMemberall:SeniorNotesDue2019At7.45PercentMember2020-01-012020-12-310000899051us-gaap:CommercialPaperMember2020-12-3100008990512020-11-300000899051us-gaap:CommercialPaperMember2019-12-310000899051us-gaap:NoncumulativePreferredStockMember2020-12-310000899051all:SeriesANoncumulativePreferredStockMember2020-12-310000899051all:SeriesANoncumulativePreferredStockMember2019-12-310000899051all:SeriesANoncumulativePreferredStockMember2020-01-012020-12-310000899051all:SeriesANoncumulativePreferredStockMember2019-01-012019-12-310000899051all:SeriesANoncumulativePreferredStockMember2018-12-310000899051all:SeriesANoncumulativePreferredStockMember2018-01-012018-12-310000899051all:SeriesCNoncumulativePreferredStockMember2020-12-310000899051all:SeriesCNoncumulativePreferredStockMember2019-12-310000899051all:SeriesCNoncumulativePreferredStockMember2020-01-012020-12-310000899051all:SeriesCNoncumulativePreferredStockMember2019-01-012019-12-310000899051all:SeriesCNoncumulativePreferredStockMember2018-12-310000899051all:SeriesCNoncumulativePreferredStockMember2018-01-012018-12-310000899051all:SeriesDNoncumulativePreferredStockMember2020-12-310000899051all:SeriesDNoncumulativePreferredStockMember2019-12-310000899051all:SeriesDNoncumulativePreferredStockMember2020-01-012020-12-310000899051all:SeriesDNoncumulativePreferredStockMember2019-01-012019-12-310000899051all:SeriesDNoncumulativePreferredStockMember2018-12-310000899051all:SeriesDNoncumulativePreferredStockMember2018-01-012018-12-310000899051all:SeriesENoncumulativePreferredStockMember2020-12-310000899051all:SeriesENoncumulativePreferredStockMember2019-12-310000899051all:SeriesENoncumulativePreferredStockMember2020-01-012020-12-310000899051all:SeriesENoncumulativePreferredStockMember2019-01-012019-12-310000899051all:SeriesENoncumulativePreferredStockMember2018-12-310000899051all:SeriesENoncumulativePreferredStockMember2018-01-012018-12-310000899051all:SeriesFNoncumulativePreferredStockMember2020-12-310000899051all:SeriesFNoncumulativePreferredStockMember2019-12-310000899051all:SeriesFNoncumulativePreferredStockMember2020-01-012020-12-310000899051all:SeriesFNoncumulativePreferredStockMember2019-01-012019-12-310000899051all:SeriesFNoncumulativePreferredStockMember2018-12-310000899051all:SeriesFNoncumulativePreferredStockMember2018-01-012018-12-310000899051all:SeriesGNoncumulativePreferredStockMember2020-12-310000899051all:SeriesGNoncumulativePreferredStockMember2019-12-310000899051all:SeriesGNoncumulativePreferredStockMember2020-01-012020-12-310000899051all:SeriesGNoncumulativePreferredStockMember2019-01-012019-12-310000899051all:SeriesGNoncumulativePreferredStockMember2018-12-310000899051all:SeriesGNoncumulativePreferredStockMember2018-01-012018-12-310000899051us-gaap:SeriesHPreferredStockMember2020-12-310000899051us-gaap:SeriesHPreferredStockMember2019-12-310000899051us-gaap:SeriesHPreferredStockMember2020-01-012020-12-310000899051us-gaap:SeriesHPreferredStockMember2019-01-012019-12-310000899051us-gaap:SeriesHPreferredStockMember2018-12-310000899051us-gaap:SeriesHPreferredStockMember2018-01-012018-12-310000899051all:SeriesIPreferredStockMember2020-12-310000899051all:SeriesIPreferredStockMember2019-12-310000899051all:SeriesIPreferredStockMember2020-01-012020-12-310000899051all:SeriesIPreferredStockMember2019-01-012019-12-310000899051all:SeriesIPreferredStockMember2018-12-310000899051all:SeriesIPreferredStockMember2018-01-012018-12-310000899051us-gaap:SeriesAPreferredStockMember2020-01-152020-01-150000899051us-gaap:SeriesAPreferredStockMember2020-01-1500008990512020-01-152020-01-15all:director0000899051srt:MaximumMemberus-gaap:NoncumulativePreferredStockMember2020-12-310000899051us-gaap:NoncumulativePreferredStockMember2020-01-012020-12-310000899051srt:MinimumMemberus-gaap:NoncumulativePreferredStockMember2020-12-310000899051srt:ScenarioForecastMemberall:TransformativeGrowthPlanMember2021-01-012021-12-310000899051all:TransformativeGrowthPlanMember2020-01-012020-12-310000899051us-gaap:EmployeeSeveranceMember2019-12-310000899051us-gaap:FacilityClosingMember2019-12-310000899051us-gaap:EmployeeSeveranceMember2020-01-012020-12-310000899051us-gaap:FacilityClosingMember2020-01-012020-12-310000899051us-gaap:EmployeeSeveranceMember2020-12-310000899051us-gaap:FacilityClosingMember2020-12-310000899051all:FLCitizensMember2020-12-310000899051all:FLCitizensMember2020-01-012020-12-310000899051all:LACitizensMember2020-12-310000899051all:CaliforniaEarthquakeAuthorityMember2020-10-310000899051all:CaliforniaEarthquakeAuthorityMember2020-10-312020-10-310000899051all:CaliforniaEarthquakeAuthorityMember2019-12-310000899051all:CaliforniaEarthquakeAuthorityMember2020-12-310000899051all:TexasFairPlanAssociationMember2020-12-310000899051all:NorthCarolinaJointUnderwritersAssociationMember2020-12-310000899051all:NorthCarolinaInsuranceUnderwritingAssociationMember2020-12-310000899051all:NorthCarolinaInsuranceUnderwritingAssociationMember2020-01-012020-12-310000899051all:GuarantyFundsMember2020-01-012020-12-310000899051all:GuarantyFundsMember2019-01-012019-12-310000899051all:GuarantyFundsMember2020-12-310000899051all:GuarantyFundsMember2019-12-310000899051us-gaap:DomesticCountryMember2020-12-310000899051us-gaap:ForeignCountryMember2020-12-310000899051all:A20YearCarryforwardExpiresin20252036Memberus-gaap:DomesticCountryMember2020-12-310000899051all:IndefiniteCarryforwardPeriodMemberus-gaap:DomesticCountryMember2020-12-310000899051us-gaap:ForeignCountryMemberall:A20YearCarryforwardExpiresin20252036Member2020-12-310000899051us-gaap:ForeignCountryMemberall:IndefiniteCarryforwardPeriodMember2020-12-310000899051all:A20YearCarryforwardExpiresin20252036Member2020-12-310000899051all:IndefiniteCarryforwardPeriodMember2020-12-310000899051all:AllstateFinancialMember2019-01-012019-12-310000899051all:AllstateFinancialMember2018-01-012018-12-310000899051all:AllstateFinancialMember2019-12-310000899051all:AllstateInsuranceCompanyMember2020-01-012020-12-310000899051all:AllstateInsuranceCompanyMember2020-12-31all:pension_plan00008990512019-01-012019-03-310000899051us-gaap:PensionPlansDefinedBenefitMember2019-12-310000899051us-gaap:PensionPlansDefinedBenefitMember2018-12-310000899051us-gaap:OtherPostretirementBenefitPlansDefinedBenefitMember2019-12-310000899051us-gaap:OtherPostretirementBenefitPlansDefinedBenefitMember2018-12-310000899051us-gaap:PensionPlansDefinedBenefitMember2020-01-012020-12-310000899051us-gaap:PensionPlansDefinedBenefitMember2019-01-012019-12-310000899051us-gaap:OtherPostretirementBenefitPlansDefinedBenefitMember2020-01-012020-12-310000899051us-gaap:OtherPostretirementBenefitPlansDefinedBenefitMember2019-01-012019-12-310000899051us-gaap:PensionPlansDefinedBenefitMember2020-12-310000899051us-gaap:OtherPostretirementBenefitPlansDefinedBenefitMember2020-12-310000899051us-gaap:PensionPlansDefinedBenefitMember2018-01-012018-12-310000899051us-gaap:OtherPostretirementBenefitPlansDefinedBenefitMember2018-01-012018-12-310000899051us-gaap:PensionPlansDefinedBenefitMembersrt:MinimumMemberus-gaap:DefinedBenefitPlanEquitySecuritiesMember2020-12-310000899051srt:MaximumMemberus-gaap:PensionPlansDefinedBenefitMemberus-gaap:DefinedBenefitPlanEquitySecuritiesMember2020-12-310000899051us-gaap:PensionPlansDefinedBenefitMemberus-gaap:DefinedBenefitPlanEquitySecuritiesMember2020-12-310000899051us-gaap:PensionPlansDefinedBenefitMemberus-gaap:DefinedBenefitPlanEquitySecuritiesMember2019-12-310000899051us-gaap:DefinedBenefitPlanDebtSecurityMemberus-gaap:PensionPlansDefinedBenefitMembersrt:MinimumMember2020-12-310000899051us-gaap:DefinedBenefitPlanDebtSecurityMembersrt:MaximumMemberus-gaap:PensionPlansDefinedBenefitMember2020-12-310000899051us-gaap:DefinedBenefitPlanDebtSecurityMemberus-gaap:PensionPlansDefinedBenefitMember2020-12-310000899051us-gaap:DefinedBenefitPlanDebtSecurityMemberus-gaap:PensionPlansDefinedBenefitMember2019-12-310000899051srt:PartnershipInterestMemberus-gaap:PensionPlansDefinedBenefitMembersrt:MinimumMember2020-12-310000899051srt:MaximumMembersrt:PartnershipInterestMemberus-gaap:PensionPlansDefinedBenefitMember2020-12-310000899051us-gaap:PensionPlansDefinedBenefitMembersrt:PartnershipInterestMember2020-12-310000899051us-gaap:PensionPlansDefinedBenefitMembersrt:PartnershipInterestMember2019-12-310000899051all:ShortTermAndOtherInvestmentsMemberus-gaap:PensionPlansDefinedBenefitMember2020-12-310000899051all:ShortTermAndOtherInvestmentsMemberus-gaap:PensionPlansDefinedBenefitMember2019-12-310000899051us-gaap:PrivateEquityFundsMember2020-12-310000899051us-gaap:PrivateEquityFundsMember2019-12-310000899051us-gaap:MutualFundMember2020-12-310000899051us-gaap:MutualFundMember2019-12-310000899051all:DefinedBenefitPlanSecuritiesLendingCollateralMemberus-gaap:PensionPlansDefinedBenefitMember2020-12-310000899051all:DefinedBenefitPlanSecuritiesLendingCollateralMemberus-gaap:PensionPlansDefinedBenefitMember2019-12-310000899051us-gaap:PensionPlansDefinedBenefitMemberus-gaap:FairValueInputsLevel1Memberus-gaap:DefinedBenefitPlanEquitySecuritiesMember2020-12-310000899051us-gaap:FairValueInputsLevel2Memberus-gaap:PensionPlansDefinedBenefitMemberus-gaap:DefinedBenefitPlanEquitySecuritiesMember2020-12-310000899051us-gaap:PensionPlansDefinedBenefitMemberus-gaap:FairValueInputsLevel3Memberus-gaap:DefinedBenefitPlanEquitySecuritiesMember2020-12-310000899051us-gaap:USTreasuryAndGovernmentMemberus-gaap:PensionPlansDefinedBenefitMemberus-gaap:FairValueInputsLevel1Member2020-12-310000899051us-gaap:FairValueInputsLevel2Memberus-gaap:USTreasuryAndGovernmentMemberus-gaap:PensionPlansDefinedBenefitMember2020-12-310000899051us-gaap:USTreasuryAndGovernmentMemberus-gaap:PensionPlansDefinedBenefitMemberus-gaap:FairValueInputsLevel3Member2020-12-310000899051us-gaap:PensionPlansDefinedBenefitMemberus-gaap:USTreasuryAndGovernmentMember2020-12-310000899051us-gaap:PensionPlansDefinedBenefitMemberus-gaap:CorporateDebtSecuritiesMemberus-gaap:FairValueInputsLevel1Member2020-12-310000899051us-gaap:FairValueInputsLevel2Memberus-gaap:PensionPlansDefinedBenefitMemberus-gaap:CorporateDebtSecuritiesMember2020-12-310000899051us-gaap:PensionPlansDefinedBenefitMemberus-gaap:CorporateDebtSecuritiesMemberus-gaap:FairValueInputsLevel3Member2020-12-310000899051us-gaap:PensionPlansDefinedBenefitMemberus-gaap:CorporateDebtSecuritiesMember2020-12-310000899051all:DefinedBenefitPlanShorttermInvestmentsMemberus-gaap:PensionPlansDefinedBenefitMemberus-gaap:FairValueInputsLevel1Member2020-12-310000899051us-gaap:FairValueInputsLevel2Memberall:DefinedBenefitPlanShorttermInvestmentsMemberus-gaap:PensionPlansDefinedBenefitMember2020-12-310000899051all:DefinedBenefitPlanShorttermInvestmentsMemberus-gaap:PensionPlansDefinedBenefitMemberus-gaap:FairValueInputsLevel3Member2020-12-310000899051all:DefinedBenefitPlanShorttermInvestmentsMemberus-gaap:PensionPlansDefinedBenefitMember2020-12-310000899051all:FreeStandingDerivativeAssetsMemberus-gaap:PensionPlansDefinedBenefitMemberus-gaap:FairValueInputsLevel1Member2020-12-310000899051us-gaap:FairValueInputsLevel2Memberall:FreeStandingDerivativeAssetsMemberus-gaap:PensionPlansDefinedBenefitMember2020-12-310000899051all:FreeStandingDerivativeAssetsMemberus-gaap:PensionPlansDefinedBenefitMemberus-gaap:FairValueInputsLevel3Member2020-12-310000899051all:FreeStandingDerivativeAssetsMemberus-gaap:PensionPlansDefinedBenefitMember2020-12-310000899051us-gaap:PensionPlansDefinedBenefitMemberall:FreeStandingDerivativeLiabilitiesMemberus-gaap:FairValueInputsLevel1Member2020-12-310000899051us-gaap:FairValueInputsLevel2Memberus-gaap:PensionPlansDefinedBenefitMemberall:FreeStandingDerivativeLiabilitiesMember2020-12-310000899051us-gaap:PensionPlansDefinedBenefitMemberus-gaap:FairValueInputsLevel3Memberall:FreeStandingDerivativeLiabilitiesMember2020-12-310000899051us-gaap:PensionPlansDefinedBenefitMemberall:FreeStandingDerivativeLiabilitiesMember2020-12-310000899051all:FreeStandingDerivativeOtherAssetsMemberus-gaap:PensionPlansDefinedBenefitMemberus-gaap:FairValueInputsLevel1Member2020-12-310000899051us-gaap:FairValueInputsLevel2Memberall:FreeStandingDerivativeOtherAssetsMemberus-gaap:PensionPlansDefinedBenefitMember2020-12-310000899051all:FreeStandingDerivativeOtherAssetsMemberus-gaap:PensionPlansDefinedBenefitMemberus-gaap:FairValueInputsLevel3Member2020-12-310000899051us-gaap:PensionPlansDefinedBenefitMemberall:FreeStandingDerivativeOtherAssetsMember2020-12-310000899051us-gaap:PensionPlansDefinedBenefitMemberus-gaap:FairValueInputsLevel1Member2020-12-310000899051us-gaap:FairValueInputsLevel2Memberus-gaap:PensionPlansDefinedBenefitMember2020-12-310000899051us-gaap:PensionPlansDefinedBenefitMemberus-gaap:FairValueInputsLevel3Member2020-12-310000899051us-gaap:PensionPlansDefinedBenefitMemberus-gaap:FairValueInputsLevel1Member2020-01-012020-12-310000899051us-gaap:FairValueInputsLevel2Memberus-gaap:PensionPlansDefinedBenefitMember2020-01-012020-12-310000899051us-gaap:PensionPlansDefinedBenefitMemberus-gaap:FairValueInputsLevel3Member2020-01-012020-12-310000899051us-gaap:PensionPlansDefinedBenefitMemberus-gaap:FairValueInputsLevel1Memberus-gaap:DefinedBenefitPlanEquitySecuritiesMember2019-12-310000899051us-gaap:FairValueInputsLevel2Memberus-gaap:PensionPlansDefinedBenefitMemberus-gaap:DefinedBenefitPlanEquitySecuritiesMember2019-12-310000899051us-gaap:PensionPlansDefinedBenefitMemberus-gaap:FairValueInputsLevel3Memberus-gaap:DefinedBenefitPlanEquitySecuritiesMember2019-12-310000899051us-gaap:USTreasuryAndGovernmentMemberus-gaap:PensionPlansDefinedBenefitMemberus-gaap:FairValueInputsLevel1Member2019-12-310000899051us-gaap:FairValueInputsLevel2Memberus-gaap:USTreasuryAndGovernmentMemberus-gaap:PensionPlansDefinedBenefitMember2019-12-310000899051us-gaap:USTreasuryAndGovernmentMemberus-gaap:PensionPlansDefinedBenefitMemberus-gaap:FairValueInputsLevel3Member2019-12-310000899051us-gaap:PensionPlansDefinedBenefitMemberus-gaap:USTreasuryAndGovernmentMember2019-12-310000899051us-gaap:PensionPlansDefinedBenefitMemberus-gaap:CorporateDebtSecuritiesMemberus-gaap:FairValueInputsLevel1Member2019-12-310000899051us-gaap:FairValueInputsLevel2Memberus-gaap:PensionPlansDefinedBenefitMemberus-gaap:CorporateDebtSecuritiesMember2019-12-310000899051us-gaap:PensionPlansDefinedBenefitMemberus-gaap:CorporateDebtSecuritiesMemberus-gaap:FairValueInputsLevel3Member2019-12-310000899051us-gaap:PensionPlansDefinedBenefitMemberus-gaap:CorporateDebtSecuritiesMember2019-12-310000899051all:DefinedBenefitPlanShorttermInvestmentsMemberus-gaap:PensionPlansDefinedBenefitMemberus-gaap:FairValueInputsLevel1Member2019-12-310000899051us-gaap:FairValueInputsLevel2Memberall:DefinedBenefitPlanShorttermInvestmentsMemberus-gaap:PensionPlansDefinedBenefitMember2019-12-310000899051all:DefinedBenefitPlanShorttermInvestmentsMemberus-gaap:PensionPlansDefinedBenefitMemberus-gaap:FairValueInputsLevel3Member2019-12-310000899051all:DefinedBenefitPlanShorttermInvestmentsMemberus-gaap:PensionPlansDefinedBenefitMember2019-12-310000899051all:FreeStandingDerivativeAssetsMemberus-gaap:PensionPlansDefinedBenefitMemberus-gaap:FairValueInputsLevel1Member2019-12-310000899051us-gaap:FairValueInputsLevel2Memberall:FreeStandingDerivativeAssetsMemberus-gaap:PensionPlansDefinedBenefitMember2019-12-310000899051all:FreeStandingDerivativeAssetsMemberus-gaap:PensionPlansDefinedBenefitMemberus-gaap:FairValueInputsLevel3Member2019-12-310000899051all:FreeStandingDerivativeAssetsMemberus-gaap:PensionPlansDefinedBenefitMember2019-12-310000899051all:FreeStandingDerivativeLiabilitiesMemberus-gaap:FairValueInputsLevel1Member2019-12-310000899051us-gaap:FairValueInputsLevel2Memberall:FreeStandingDerivativeLiabilitiesMember2019-12-310000899051us-gaap:FairValueInputsLevel3Memberall:FreeStandingDerivativeLiabilitiesMember2019-12-310000899051us-gaap:PensionPlansDefinedBenefitMemberall:FreeStandingDerivativeLiabilitiesMember2019-12-310000899051us-gaap:PensionPlansDefinedBenefitMemberus-gaap:FairValueInputsLevel1Member2019-12-310000899051us-gaap:FairValueInputsLevel2Memberus-gaap:PensionPlansDefinedBenefitMember2019-12-310000899051us-gaap:PensionPlansDefinedBenefitMemberus-gaap:FairValueInputsLevel3Member2019-12-310000899051us-gaap:PensionPlansDefinedBenefitMemberus-gaap:FairValueInputsLevel1Member2019-01-012019-12-310000899051us-gaap:FairValueInputsLevel2Memberus-gaap:PensionPlansDefinedBenefitMember2019-01-012019-12-310000899051us-gaap:PensionPlansDefinedBenefitMemberus-gaap:FairValueInputsLevel3Member2019-01-012019-12-310000899051us-gaap:PensionPlansDefinedBenefitMemberus-gaap:CorporateDebtSecuritiesMemberus-gaap:FairValueInputsLevel3Member2020-01-012020-12-310000899051us-gaap:PensionPlansDefinedBenefitMemberus-gaap:CorporateDebtSecuritiesMemberus-gaap:FairValueInputsLevel3Member2018-12-310000899051us-gaap:PensionPlansDefinedBenefitMemberus-gaap:CorporateDebtSecuritiesMemberus-gaap:FairValueInputsLevel3Member2019-01-012019-12-310000899051us-gaap:PensionPlansDefinedBenefitMemberus-gaap:FairValueInputsLevel3Member2018-12-310000899051us-gaap:PensionPlansDefinedBenefitMemberus-gaap:FairValueInputsLevel3Memberus-gaap:DefinedBenefitPlanEquitySecuritiesMember2017-12-310000899051us-gaap:PensionPlansDefinedBenefitMemberus-gaap:FairValueInputsLevel3Memberus-gaap:DefinedBenefitPlanEquitySecuritiesMember2018-01-012018-12-310000899051us-gaap:PensionPlansDefinedBenefitMemberus-gaap:FairValueInputsLevel3Memberus-gaap:DefinedBenefitPlanEquitySecuritiesMember2018-12-310000899051us-gaap:PensionPlansDefinedBenefitMemberus-gaap:CorporateDebtSecuritiesMemberus-gaap:FairValueInputsLevel3Member2017-12-310000899051us-gaap:PensionPlansDefinedBenefitMemberus-gaap:CorporateDebtSecuritiesMemberus-gaap:FairValueInputsLevel3Member2018-01-012018-12-310000899051us-gaap:PensionPlansDefinedBenefitMemberus-gaap:FairValueInputsLevel3Member2017-12-310000899051us-gaap:PensionPlansDefinedBenefitMemberus-gaap:FairValueInputsLevel3Member2018-01-012018-12-310000899051us-gaap:OtherPensionPlansDefinedBenefitMember2020-12-310000899051all:NonQualifiedStockOptionsMember2020-12-310000899051all:NonQualifiedStockOptionsMember2020-01-012020-12-310000899051us-gaap:RestrictedStockUnitsRSUMember2020-12-310000899051us-gaap:RestrictedStockUnitsRSUMember2020-01-012020-12-310000899051us-gaap:PerformanceSharesMember2020-12-310000899051us-gaap:PerformanceSharesMember2020-01-012020-12-310000899051us-gaap:EmployeeStockOptionMember2020-01-012020-12-310000899051us-gaap:EmployeeStockOptionMember2014-02-172014-02-170000899051us-gaap:EmployeeStockOptionMember2019-01-012019-12-310000899051us-gaap:EmployeeStockOptionMember2018-01-012018-12-310000899051us-gaap:EmployeeStockOptionMember2019-12-310000899051us-gaap:EmployeeStockOptionMember2020-12-310000899051us-gaap:RestrictedStockUnitsRSUMember2019-12-310000899051us-gaap:RestrictedStockUnitsRSUMember2019-01-012019-12-310000899051us-gaap:RestrictedStockUnitsRSUMember2018-01-012018-12-310000899051us-gaap:PerformanceSharesMember2019-12-310000899051us-gaap:PerformanceSharesMember2019-01-012019-12-310000899051us-gaap:PerformanceSharesMember2018-01-012018-12-310000899051us-gaap:AccountingStandardsUpdate201602Member2019-01-012019-12-310000899051us-gaap:AccumulatedNetUnrealizedInvestmentGainLossMember2020-01-012020-12-310000899051us-gaap:AccumulatedNetUnrealizedInvestmentGainLossMember2019-01-012019-12-310000899051us-gaap:AccumulatedNetUnrealizedInvestmentGainLossMember2018-01-012018-12-310000899051us-gaap:AccumulatedTranslationAdjustmentMember2020-01-012020-12-310000899051us-gaap:AccumulatedTranslationAdjustmentMember2019-01-012019-12-310000899051us-gaap:AccumulatedTranslationAdjustmentMember2018-01-012018-12-310000899051us-gaap:AccumulatedDefinedBenefitPlansAdjustmentMember2020-01-012020-12-310000899051us-gaap:AccumulatedDefinedBenefitPlansAdjustmentMember2019-01-012019-12-310000899051us-gaap:AccumulatedDefinedBenefitPlansAdjustmentMember2018-01-012018-12-3100008990512020-01-012020-03-3100008990512020-04-012020-06-3000008990512019-04-012019-06-3000008990512020-07-012020-09-3000008990512019-07-012019-09-3000008990512019-10-012019-12-310000899051us-gaap:USTreasuryAndGovernmentMember2020-12-310000899051us-gaap:USStatesAndPoliticalSubdivisionsMember2020-12-310000899051us-gaap:ForeignGovernmentDebtSecuritiesMember2020-12-310000899051us-gaap:PublicUtilityBondsMember2020-12-310000899051us-gaap:AllOtherCorporateBondsMember2020-12-310000899051us-gaap:AssetBackedSecuritiesMember2020-12-310000899051us-gaap:MortgageBackedSecuritiesMember2020-12-310000899051us-gaap:FixedIncomeSecuritiesMember2020-12-310000899051us-gaap:PublicUtilityEquitiesMember2020-12-310000899051us-gaap:BanksTrustAndInsuranceEquitiesMember2020-12-310000899051us-gaap:IndustrialMiscellaneousAndAllOthersMember2020-12-310000899051us-gaap:NonredeemablePreferredStockMember2020-12-310000899051us-gaap:EquitySecuritiesMember2020-12-310000899051us-gaap:MortgagesMember2020-12-310000899051us-gaap:RealEstateInvestmentMember2020-12-310000899051us-gaap:PolicyLoansMember2020-12-310000899051us-gaap:DerivativeMember2020-12-310000899051us-gaap:OtherLongTermInvestmentsMember2020-12-310000899051us-gaap:ShortTermInvestmentsMember2020-12-310000899051srt:ParentCompanyMember2020-01-012020-12-310000899051srt:ParentCompanyMember2019-01-012019-12-310000899051srt:ParentCompanyMember2018-01-012018-12-310000899051srt:ParentCompanyMember2020-12-310000899051srt:ParentCompanyMember2019-12-310000899051srt:ParentCompanyMember2018-12-310000899051srt:ParentCompanyMember2017-12-310000899051srt:SubsidiariesMemberall:KennettCapitalIncMembersrt:ParentCompanyMember2020-06-180000899051srt:SubsidiariesMemberall:KennettCapitalIncMembersrt:ParentCompanyMember2020-12-290000899051srt:SubsidiariesMemberall:KennettCapitalIncMembersrt:ParentCompanyMember2019-06-190000899051srt:SubsidiariesMemberall:KennettCapitalIncMembersrt:ParentCompanyMember2020-06-182020-06-180000899051all:AllstateProtectionMemberus-gaap:OperatingSegmentsMember2020-12-310000899051all:AllstateProtectionMemberus-gaap:OperatingSegmentsMember2020-01-012020-12-310000899051all:DiscontinuedLinesAndCoveragesMemberus-gaap:OperatingSegmentsMember2020-12-310000899051all:DiscontinuedLinesAndCoveragesMemberus-gaap:OperatingSegmentsMember2020-01-012020-12-310000899051us-gaap:OperatingSegmentsMemberall:PropertyLiabilityMember2020-12-310000899051all:ProtectionServicesMemberus-gaap:OperatingSegmentsMember2020-12-310000899051all:AllstateLifeMemberus-gaap:OperatingSegmentsMember2020-12-310000899051all:AllstateBenefitsMemberus-gaap:OperatingSegmentsMember2020-12-310000899051all:AllstateBenefitsMemberus-gaap:OperatingSegmentsMember2020-01-012020-12-310000899051us-gaap:OperatingSegmentsMemberall:AllstateAnnuitiesMember2020-12-310000899051us-gaap:OperatingSegmentsMemberall:AllstateAnnuitiesMember2020-01-012020-12-310000899051us-gaap:CorporateAndOtherMemberus-gaap:OperatingSegmentsMember2020-12-310000899051us-gaap:CorporateAndOtherMemberus-gaap:OperatingSegmentsMember2020-01-012020-12-310000899051us-gaap:IntersegmentEliminationMember2020-12-310000899051all:AllstateProtectionMemberus-gaap:OperatingSegmentsMember2019-12-310000899051all:AllstateProtectionMemberus-gaap:OperatingSegmentsMember2019-01-012019-12-310000899051all:DiscontinuedLinesAndCoveragesMemberus-gaap:OperatingSegmentsMember2019-12-310000899051all:DiscontinuedLinesAndCoveragesMemberus-gaap:OperatingSegmentsMember2019-01-012019-12-310000899051us-gaap:OperatingSegmentsMemberall:PropertyLiabilityMember2019-12-310000899051all:ProtectionServicesMemberus-gaap:OperatingSegmentsMember2019-12-310000899051all:AllstateLifeMemberus-gaap:OperatingSegmentsMember2019-12-310000899051all:AllstateBenefitsMemberus-gaap:OperatingSegmentsMember2019-12-310000899051all:AllstateBenefitsMemberus-gaap:OperatingSegmentsMember2019-01-012019-12-310000899051us-gaap:OperatingSegmentsMemberall:AllstateAnnuitiesMember2019-12-310000899051us-gaap:OperatingSegmentsMemberall:AllstateAnnuitiesMember2019-01-012019-12-310000899051us-gaap:CorporateAndOtherMemberus-gaap:OperatingSegmentsMember2019-12-310000899051us-gaap:CorporateAndOtherMemberus-gaap:OperatingSegmentsMember2019-01-012019-12-310000899051us-gaap:IntersegmentEliminationMember2019-12-310000899051all:AllstateProtectionMemberus-gaap:OperatingSegmentsMember2018-12-310000899051all:AllstateProtectionMemberus-gaap:OperatingSegmentsMember2018-01-012018-12-310000899051all:DiscontinuedLinesAndCoveragesMemberus-gaap:OperatingSegmentsMember2018-12-310000899051all:DiscontinuedLinesAndCoveragesMemberus-gaap:OperatingSegmentsMember2018-01-012018-12-310000899051us-gaap:OperatingSegmentsMemberall:PropertyLiabilityMember2018-12-310000899051all:ProtectionServicesMemberus-gaap:OperatingSegmentsMember2018-12-310000899051all:AllstateLifeMemberus-gaap:OperatingSegmentsMember2018-12-310000899051all:AllstateBenefitsMemberus-gaap:OperatingSegmentsMember2018-12-310000899051all:AllstateBenefitsMemberus-gaap:OperatingSegmentsMember2018-01-012018-12-310000899051us-gaap:OperatingSegmentsMemberall:AllstateAnnuitiesMember2018-12-310000899051us-gaap:OperatingSegmentsMemberall:AllstateAnnuitiesMember2018-01-012018-12-310000899051us-gaap:CorporateAndOtherMemberus-gaap:OperatingSegmentsMember2018-12-310000899051us-gaap:CorporateAndOtherMemberus-gaap:OperatingSegmentsMember2018-01-012018-12-310000899051us-gaap:IntersegmentEliminationMember2018-12-310000899051us-gaap:AccidentAndHealthInsuranceSegmentMember2020-01-012020-12-310000899051us-gaap:AccidentAndHealthInsuranceSegmentMember2019-01-012019-12-310000899051us-gaap:AccidentAndHealthInsuranceSegmentMember2018-01-012018-12-310000899051srt:CumulativeEffectPeriodOfAdoptionAdjustedBalanceMemberall:SECSchedule1209AllowanceFixedIncomeSecuritiesMember2019-12-310000899051all:SECSchedule1209AllowanceFixedIncomeSecuritiesMember2020-01-012020-12-310000899051all:SECSchedule1209AllowanceFixedIncomeSecuritiesMember2020-12-310000899051srt:CumulativeEffectPeriodOfAdoptionAdjustedBalanceMemberus-gaap:AllowanceForLoanAndLeaseLossesRealEstateMember2019-12-310000899051us-gaap:AllowanceForLoanAndLeaseLossesRealEstateMember2020-01-012020-12-310000899051us-gaap:AllowanceForLoanAndLeaseLossesRealEstateMember2020-12-310000899051all:SECSchedule1209AllowanceLoanAndLeaseLossBankLoansMembersrt:CumulativeEffectPeriodOfAdoptionAdjustedBalanceMember2019-12-310000899051all:SECSchedule1209AllowanceLoanAndLeaseLossBankLoansMember2020-01-012020-12-310000899051all:SECSchedule1209AllowanceLoanAndLeaseLossBankLoansMember2020-12-310000899051all:SECSchedule1209AllowanceLoanandLeaseLossAgentLoansMembersrt:CumulativeEffectPeriodOfAdoptionAdjustedBalanceMember2019-12-310000899051all:SECSchedule1209AllowanceLoanandLeaseLossAgentLoansMember2020-01-012020-12-310000899051all:SECSchedule1209AllowanceLoanandLeaseLossAgentLoansMember2020-12-310000899051all:SECSchedule1209AllowanceInvestmentsMembersrt:CumulativeEffectPeriodOfAdoptionAdjustedBalanceMember2019-12-310000899051all:SECSchedule1209AllowanceInvestmentsMember2020-01-012020-12-310000899051all:SECSchedule1209AllowanceInvestmentsMember2020-12-310000899051srt:CumulativeEffectPeriodOfAdoptionAdjustedBalanceMemberus-gaap:AllowanceForUncollectiblePremiumsReceivableMember2019-12-310000899051us-gaap:AllowanceForUncollectiblePremiumsReceivableMember2020-01-012020-12-310000899051us-gaap:AllowanceForUncollectiblePremiumsReceivableMember2020-12-310000899051srt:CumulativeEffectPeriodOfAdoptionAdjustedBalanceMemberus-gaap:AllowanceForReinsuranceRecoverableMember2019-12-310000899051us-gaap:AllowanceForReinsuranceRecoverableMember2020-01-012020-12-310000899051us-gaap:AllowanceForReinsuranceRecoverableMember2020-12-310000899051srt:CumulativeEffectPeriodOfAdoptionAdjustedBalanceMemberall:SECSchedule1209ValuationAllowanceOtherAssetsMember2019-12-310000899051all:SECSchedule1209ValuationAllowanceOtherAssetsMember2020-01-012020-12-310000899051all:SECSchedule1209ValuationAllowanceOtherAssetsMember2020-12-310000899051srt:CumulativeEffectPeriodOfAdoptionAdjustedBalanceMemberus-gaap:AssetsMember2019-12-310000899051us-gaap:AssetsMember2020-01-012020-12-310000899051us-gaap:AssetsMember2020-12-310000899051us-gaap:LoanOriginationCommitmentsMembersrt:CumulativeEffectPeriodOfAdoptionAdjustedBalanceMember2019-12-310000899051us-gaap:LoanOriginationCommitmentsMember2020-01-012020-12-310000899051us-gaap:LoanOriginationCommitmentsMember2020-12-310000899051srt:CumulativeEffectPeriodOfAdoptionAdjustedBalanceMemberus-gaap:LiabilityMember2019-12-310000899051us-gaap:LiabilityMember2020-01-012020-12-310000899051us-gaap:LiabilityMember2020-12-310000899051srt:CumulativeEffectPeriodOfAdoptionAdjustedBalanceMember2019-12-310000899051us-gaap:AllowanceForReinsuranceRecoverableMember2018-12-310000899051us-gaap:AllowanceForReinsuranceRecoverableMember2019-01-012019-12-310000899051us-gaap:AllowanceForReinsuranceRecoverableMember2019-12-310000899051us-gaap:AllowanceForUncollectiblePremiumsReceivableMember2018-12-310000899051us-gaap:AllowanceForUncollectiblePremiumsReceivableMember2019-01-012019-12-310000899051us-gaap:AllowanceForUncollectiblePremiumsReceivableMember2019-12-310000899051us-gaap:ValuationAllowanceOfDeferredTaxAssetsMember2018-12-310000899051us-gaap:ValuationAllowanceOfDeferredTaxAssetsMember2019-01-012019-12-310000899051us-gaap:ValuationAllowanceOfDeferredTaxAssetsMember2019-12-310000899051us-gaap:AllowanceForLoanAndLeaseLossesRealEstateMember2018-12-310000899051us-gaap:AllowanceForLoanAndLeaseLossesRealEstateMember2019-01-012019-12-310000899051us-gaap:AllowanceForLoanAndLeaseLossesRealEstateMember2019-12-310000899051all:SECSchedule1209AllowanceLoanandLeaseLossAgentLoansMember2018-12-310000899051all:SECSchedule1209AllowanceLoanandLeaseLossAgentLoansMember2019-01-012019-12-310000899051all:SECSchedule1209AllowanceLoanandLeaseLossAgentLoansMember2019-12-310000899051us-gaap:AllowanceForReinsuranceRecoverableMember2017-12-310000899051us-gaap:AllowanceForReinsuranceRecoverableMember2018-01-012018-12-310000899051us-gaap:AllowanceForUncollectiblePremiumsReceivableMember2017-12-310000899051us-gaap:AllowanceForUncollectiblePremiumsReceivableMember2018-01-012018-12-310000899051us-gaap:ValuationAllowanceOfDeferredTaxAssetsMember2017-12-310000899051us-gaap:ValuationAllowanceOfDeferredTaxAssetsMember2018-01-012018-12-310000899051us-gaap:AllowanceForLoanAndLeaseLossesRealEstateMember2017-12-310000899051us-gaap:AllowanceForLoanAndLeaseLossesRealEstateMember2018-01-012018-12-310000899051all:SECSchedule1209AllowanceLoanandLeaseLossAgentLoansMember2017-12-310000899051all:SECSchedule1209AllowanceLoanandLeaseLossAgentLoansMember2018-01-012018-12-31
UNITED STATES
SECURITIES AND EXCHANGE COMMISSION
Washington, D.C. 20549
FORM 10-K
☒ ANNUAL REPORT PURSUANT TO SECTION 13 OR 15(d) OF THE SECURITIES EXCHANGE ACT OF 1934
For the fiscal year ended December 31, 2020
OR
☐ TRANSITION REPORT PURSUANT TO SECTION 13 OR 15(d) OF THE SECURITIES EXCHANGE ACT OF 1934
For the transition period from to
Commission file number 1-11840
THE ALLSTATE CORPORATION
(Exact name of registrant as specified in its charter)
| | | | | | | | |
Delaware | | 36-3871531 |
| (State or Other Jurisdiction of Incorporation or Organization) | | (I.R.S. Employer Identification No.) |
2775 Sanders Road, Northbrook, Illinois 60062
(Address of principal executive offices) (Zip Code)
Registrant’s telephone number, including area code: (847) 402-5000
Securities registered pursuant to Section 12(b) of the Act:
| | | | | | | | |
| Title of each class | Trading Symbols | Name of each exchange on which registered |
| Common Stock, par value $0.01 per share | ALL | New York Stock Exchange Chicago Stock Exchange |
| 5.100% Fixed-to-Floating Rate Subordinated Debentures due 2053 | ALL.PR.B | New York Stock Exchange |
| Depositary Shares represent 1/1,000th of a share of 5.625% Noncumulative Preferred Stock, Series G | ALL PR G | New York Stock Exchange |
| Depositary Shares represent 1/1,000th of a share of 5.100% Noncumulative Preferred Stock, Series H | ALL PR H | New York Stock Exchange |
| Depositary Shares represent 1/1,000th of a share of 4.750% Noncumulative Preferred Stock, Series I | ALL PR I | New York Stock Exchange |
Securities registered pursuant to Section 12(g) of the Act: None
Indicate by check mark if the registrant is a well-known seasoned issuer, as defined in Rule 405 of the Securities Act. Yes ☒ No ☐
Indicate by check mark if the registrant is not required to file reports pursuant to Section 13 or Section 15(d) of the Act. Yes ☐ No ☒
Indicate by check mark whether the registrant (1) has filed all reports required to be filed by Section 13 or 15(d) of the Securities Exchange Act of 1934 during the preceding 12 months (or for such shorter period that the registrant was required to file such reports), and (2) has been subject to such filing requirements for the past 90 days. Yes ☒ No ☐
Indicate by check mark whether the registrant has submitted electronically every Interactive Data File required to be submitted pursuant to Rule 405 of Regulation S-T (§ 232.405 of this chapter) during the preceding 12 months (or for such shorter period that the registrant was required to submit such files). Yes ☒ No ☐
Indicate by check mark whether the registrant is a large accelerated filer, an accelerated filer, a non-accelerated filer, a smaller reporting company, or an emerging growth company. See the definitions of “large accelerated filer,” “accelerated filer,” “smaller reporting company,” and “emerging growth company” in Rule 12b-2 of the Exchange Act.
| | | | | | | | | | | |
Large accelerated filer | ☒ | Accelerated filer | ☐ |
| | | |
| Non-accelerated filer | ☐ | Smaller reporting company | ☐ |
| | | |
| | Emerging growth company | ☐ |
If an emerging growth company, indicate by check mark if the registrant has elected not to use the extended transition period for complying with any new or revised financial accounting standards provided pursuant to Section 13(a) of the Exchange Act. ☐
Indicate by check mark whether the registrant has filed a report on and attestation to its management’s assessment of the effectiveness of its internal control over financial reporting under Section 404(b) of the Sarbanes-Oxley Act (15 U.S.C. 7262(b)) by the registered public accounting firm that prepared or issued its audit report. ☒
Indicate by check mark whether the registrant is a shell company (as defined in Rule 12b-2 of the Exchange Act). Yes ☐ No ☒
The aggregate market value of the common stock held by non-affiliates of the registrant, computed by reference to the closing price as of the last business day of the registrant’s most recently completed second fiscal quarter, June 30, 2020, was approximately $29.94 billion.
As of January 29, 2021, the registrant had 302,873,426 shares of common stock outstanding.
Documents Incorporated By Reference
Portions of the following documents are incorporated herein by reference as follows:
Part III of this Form 10-K incorporates by reference certain information from the registrant’s definitive proxy statement for its annual stockholders meeting to be held on May 25, 2021, (the “Proxy Statement”) to be filed not later than 120 days after the end of the fiscal year covered by this Form 10-K.
Table of Contents
| | | | | | | | | | | | | | |
| | | | |
| Part I | | | | Page |
| | | | |
| | | | |
| | • Overview | | |
| | • Strategy and Segment Information | | |
| | | | |
| | – Protection Services (previously Service Businesses) | | |
| | | | |
| | | | |
| | – Allstate Annuities | | |
| | | | |
| | | | |
| | | | |
| | | | |
| | | | |
| | | | |
| | | | |
| | | | |
| | | | |
| | | | |
| | | | |
| | | | |
| | | | |
| Part II | | | | |
| | | | |
| | | | |
| | | | |
| | | | |
| | | | |
| | | | |
| | | | |
| | | | |
| | | | |
| Part III | | | | |
| | | | |
| | | | |
| | | | |
| | | | |
| | | | |
| | | | |
| Part IV | | | | |
| | | | |
| | | | |
| | | | |
| | |
2020 Form 10-K Item 1. Business
Part I
Item 1. Business
The Allstate Corporation was incorporated under the laws of the State of Delaware on November 5, 1992, to serve as the holding company for Allstate Insurance Company. Its business is conducted principally through Allstate Insurance Company, Allstate Life Insurance Company and other subsidiaries (collectively, including The Allstate Corporation, “Allstate”).
Allstate protects people from life’s uncertainties with a wide array of protection for autos, homes, electronic devices and identity theft. Allstate is primarily engaged in the property and casualty insurance business in the United States and Canada. Additionally, Allstate provides customers other protection solutions such as life, accident and health insurance and protection plans that cover electronic devices and personal identities.
The Allstate Corporation is one of the largest publicly held personal lines insurers in the United States. Allstate’s personal property-liability strategy is to increase market share by offering consumers a broad suite of personal lines solutions and a competitive value proposition across distribution channels. The Allstate brand is widely known through the “You’re In Good Hands With Allstate®” slogan. Allstate is the fourth largest personal property and casualty insurer in the United States on the basis of 2019 statutory direct premiums written according to A.M. Best.
Allstate also has strong market positions in other protection solutions. Allstate Benefits provides accident, health and life insurance through employers and is one of the top voluntary benefits carriers in the market based on a 2019 voluntary/worksite industry survey. Allstate Protection Plans provides protection plans on a wide variety of consumer goods such as cell phones, tablets, computers, furniture and appliances, and has a leading position in distribution through major retailers. Allstate Identity Protection, which provides identity protection, has a leading position in worksite distribution. In total, Allstate had 175.9 million policies in force (“PIF”) as of December 31, 2020.
In this Annual Report on Form 10-K, we occasionally refer to statutory financial information. All domestic United States insurance companies are required to prepare statutory-basis financial statements. As a result, industry data is available that enables comparisons between insurance companies, including competitors that are not required to prepare financial statements in conformity with accounting principles generally accepted in the United States of America (“GAAP”). We frequently use industry publications containing statutory financial information to assess our competitive position.
Subsequent event On January 26, 2021, Allstate announced an agreement to sell Allstate Life Insurance Company (“ALIC”) and certain affiliates for $2.8 billion to Antelope US Holdings Company, an affiliate of an investment fund associated with The Blackstone Group Inc. Allstate will retain ownership of Allstate Life Insurance Company of New York (“ALNY”) while pursuing alternatives to sell or otherwise transfer risk to a third party. ALIC and certain affiliates represent approximately 80% of Allstate Life and Allstate Annuity reserves for life-contingent contract benefits and contractholder funds as of December 31, 2020 and generated net income of approximately $290 million and $470 million in 2020 and 2019, respectively. A loss on disposition estimated at $3 billion, after-tax, will be recorded in the first quarter of 2021. The ultimate amount of the loss on sale will be impacted by purchase price adjustments associated with certain pre-close transactions specified in the stock purchase agreement, changes in statutory capital and surplus prior to the closing date and the closing date equity of ALIC determined under GAAP, excluding unrealized gains and losses. The transaction is expected to close in the second half of 2021, subject to regulatory approvals and other customary closing conditions.
On January 4, 2021, Allstate completed the acquisition of National General Holdings Corp. (“National General”), expanding its independent agent channel business.
For additional information, see Part II, Item 8 - Note 3 of the consolidated financial statements of this report.
The Allstate Corporation 1
2020 Form 10-K Item 1. Business
Strategy, Transformative Growth, Our Shared Purpose and Segment Information
Our strategy has two components: increase personal property-liability market share (see Allstate Protection segment) and expand protection offerings by leveraging the Allstate brand, customer base and capabilities.
Transformative Growth is about creating a business model, capabilities and culture that continually transform to deliver market share. This is done by focusing on the customer by expanding access and improving value. The ultimate objective is to create continuous transformative growth in all businesses by delivering affordable, simple and connected protection solutions.
We are expanding protection businesses utilizing enterprise capabilities and resources such as distribution, analytics, claims, investment expertise, talent and capital. Using innovative growth platforms (such as telematics and identity protection) and broad distribution including: Allstate exclusive agents, independent agents, contact centers, online, retailers, workplace benefits brokers, auto dealers, original equipment manufacturers and telecom providers further enhance our customer value proposition.
Allstate has thrived for 89 years by adapting to better serve customers. Our two-part strategy builds on this success by leveraging the Allstate brand, people and technology to improve our long-term competitive position and accelerate growth.
(1)ALIC and certain affiliates to be divested and we will broaden non-proprietary product distribution to include life insurance.
2020 Form 10-K Item 1. Business
| | | | | | | | | | | | | | | | | | | | | | | |
| Our Shared Purpose |
| As the good hands... | | our values | | our operating standards | | our behaviors | |
•We empower customers with protection to help them achieve their hopes and dreams. •We provide affordable, simple and connected protection solutions. •We create opportunity for our team, economic value for our shareholders and improve communities. | | •Integrity is non-negotiable. •Inclusive Diversity & Equity values and leverages unique identities with equitable opportunity and rewards. •Collective Success is achieved through empathy and prioritizing enterprise outcomes ahead of individuals. | | •Focus on Customers by anticipating and exceeding service expectations at low costs. •Be the Best at protecting customers, developing talent and running our businesses. •Be Bold with original ideas using speed and conviction to beat the competition. •Earn Attractive Returns by providing customer value, proactively accepting risk and using analytics. | | •Collaborate early and often to develop and implement comprehensive solutions and share learnings. •Challenge Ideas to leverage collective expertise, evaluate multiple alternatives and create the best path forward. •Provide Clarity for expected outcomes, decision authority and accountability. •Provide Feedback that is candid, actionable, independent of hierarchy and safe. | |
| | | | | | | | |
| Reportable segments |
Allstate Protection (1) | | Includes the Allstate and Encompass brands and Answer Financial. Offers private passenger auto, homeowners, other personal lines and commercial insurance through agents, contact centers and online. Esurance results were combined into the Allstate brand in the third quarter of 2020. |
Protection Services (previously Service Businesses) | | Includes Allstate Protection Plans, Allstate Dealer Services, Allstate Roadside, Arity and Allstate Identity Protection, which offer a broad range of solutions and services that expand and enhance our customer value propositions. |
Allstate Life (2) | | Consists of traditional, interest-sensitive and variable life insurance products primarily through Allstate exclusive agents and exclusive financial specialists. |
Allstate Benefits | | Offers voluntary benefits products, including life, accident, critical illness, short-term disability and other health insurance products sold through independent agents, benefits brokers and Allstate exclusive agents. |
| | |
Allstate Annuities (2) | | Consists of deferred fixed annuities and immediate fixed annuities (including standard and sub-standard structured settlements) in run-off. |
Discontinued Lines and Coverages (1) | | Relates to property and casualty insurance policies written during the 1960's through the mid-1980's with exposure to asbestos, environmental and other claims in run-off. |
Corporate and Other | | Includes holding company activities and certain non-insurance operations. |
(1)Allstate Protection and Discontinued Lines and Coverages segments comprise Property-Liability.
(2)The pending sale of ALIC and certain affiliates represents approximately 90% of Allstate Life and 75% of Allstate Annuities reserves for life-contingent contract benefits and contractholder funds.
2020 Form 10-K Item 1. Business
Allstate Protection Segment
Our Allstate Protection segment accounted for 90.0% of Allstate’s 2020 consolidated insurance premiums and contract charges and 19.1% of Allstate’s December 31, 2020 PIF. Private passenger auto, homeowners, other personal lines and commercial insurance products offered through both exclusive and independent agents and directly through contact centers and online are included in this segment. Our strategy is to provide open access and choice of interaction, while offering affordable, simple and connected solutions to meet customers’ evolving needs and protect them from life’s uncertainties.
Strategy Allstate Protection segment is key to the strategy of increasing personal lines market share through Transformative Growth focusing on:
•Allstate brand growth, while making it easier to do business with us and reducing our cost structure
•Expanding Independent Agency channel business with the acquisition of National General in January 2021
We have three market-facing property-liability businesses, Allstate brand, Encompass brand and Answer Financial with products and services that cater to different customer preferences for advice and brand recognition. Starting in 2021, Allstate Independent Agency and Encompass organizations will be integrated into National General.
We serve our consumers using differentiated products, analytical expertise, telematics and an integrated digital enterprise that leverages data and technology to execute processes with a focus on greater effectiveness and efficiency.
| | | | | | | | | | | | | | | | | |
Transformative Growth |
| | | | | |
| Expanding Customer Access | | Expanding open access and customer choice of solutions under the Allstate brand across multiple channels, including Exclusive Agency and direct (online or call centers) |
| Driving direct growth through improving online quote flow and enhancing call center practices |
| Continuing to emphasize growth and customer service in existing Exclusive Agencies |
| Stopped appointing new agents while building and scaling new agent models, such as the Allstate Sales Agent, to offer different access points to Allstate brand products at a lower distribution cost |
| Lowering the Allstate brand distribution expense ratio |
| Establishing a market leading position in the independent agency channel as a top five personal lines carrier with the National General acquisition, utilizing its broad range of products and strong technology platform |
| Improving Customer Value | | Building affordable, simple and connected protection solutions |
| Improving the competitive prices of products through efficiencies, automation, optimized vendor management, lower distribution costs, and retirement of legacy technologies |
| Enhancing pricing sophistication to price products based on customer needs and risks and improving our purchase process with automated decision support |
| Increasing engagement with the Allstate Mobile app and new business penetration of telematics products, including pay-per-mile insurance |
| Leveraging our circle of protection to provide added protection solutions |
| | |
| |
| |
Item 1. Business 2020 Form 10-K
Additional Information and Strategy Updates
Commercial lines strategy We continue to focus on profitable expansion of our shared economy commercial lines business, which is primarily comprised of transportation network companies. Traditional small business commercial insurance is being enhanced through new product development using technology to improve customer experience and reduce costs while leveraging enterprise capabilities. Profit improvement actions continue for our traditional commercial lines insurance products, emphasizing pricing, claims, governance and operational improvements.
Independent agent strategy On January 4, 2021, we completed the acquisition of National General, significantly enhancing our strategic position in the independent agency channel. The transaction will increase our market share in personal property-liability by over one percentage point and enhance our independent agent-facing technology. It will significantly expand our distribution footprint, leading us to be a top five personal lines carrier in the independent agency distribution channel. Additional expansion opportunities through independent agents also exist in standard auto and homeowners insurance by leveraging Allstate’s capabilities.
National General provides personal and commercial automobile, homeowners, umbrella, recreational vehicle, motorcycle, lender-placed property, supplemental health and other niche insurance products. Auto insurance represents approximately 60% of premium with a significant presence in the non-standard auto market.
As part of the acquisition, Allstate Independent Agency and Encompass organizations will be integrated into National General by:
•Migrating Encompass policyholders and business operations to National General and sunset Encompass infrastructure
•Transitioning Allstate Independent Agent new business to National General as mid-market products roll out
Answer Financial strategy Answer Financial is an insurance agency that sells other insurance companies’ products directly to customers online. Our strategy as a technology-enabled insurance agency is to provide comparison shopping and related services for businesses, offering customers choice, convenience and ease of use.
Allstate Protection pricing and risk management strategies Our pricing and underwriting strategies and decisions are designed to generate sustainable profitable growth.
A proprietary database of underwriting and loss experience enables sophisticated pricing algorithms and methodologies to more accurately price risks while also seeking to attract and retain customers in multiple risk segments.
•For auto insurance, risk evaluation factors can include, but are not limited to: vehicle make, model and year; driver age and marital status; territory; years licensed; loss history; years insured with prior carrier; prior liability limits; prior lapse in coverage; and insurance scoring utilizing telematics data and other consumer information.
•For property insurance, risk evaluation factors can include, but are not limited to: the amount of insurance purchased; geographic location of the property; loss history; age, condition and construction characteristics of the property; and characteristics of the insured including insurance scoring utilizing other consumer information.
A combination of underwriting information, pricing and discounts are also used to achieve a more competitive position and growth. The pricing strategy involves local marketplace pricing and underwriting decisions based on risk evaluation factors to the extent permissible by applicable law and an evaluation of competitors.
Pricing of property products is intended to generate risk-adjusted returns that are acceptable over a long-term period. Rate increases are pursued to keep pace with loss trends, including losses from catastrophic events and those that are weather-related (such as wind, hail, lightning and freeze not meeting our criteria to be declared a catastrophe). We also take into consideration potential customer disruption, the impact on our ability to market our products, regulatory limitations, our competitive position and profitability.
In any reporting period, loss experience from catastrophic events and weather-related losses may contribute to negative or positive underwriting performance relative to the expectations incorporated into product pricing.
Property catastrophe exposure is managed with the goal of providing shareholders an acceptable return on the risks assumed in the property business. Catastrophe exposure management includes purchasing reinsurance to provide coverage for known exposure to hurricanes, earthquakes and fires following earthquakes, wildfires and other catastrophes. Our current catastrophe reinsurance program supports our risk tolerance framework that targets less than a 1% likelihood of annual aggregate catastrophe losses from hurricanes and earthquakes, excluding other catastrophe losses and, net of reinsurance, exceeding $2 billion.
The use of different assumptions and updates to industry models and to our risk transfer program could materially change the projected loss. Growth strategies include areas where we believe diversification can be enhanced and an appropriate return can be earned for the risk. As a result, our modeled exposure may increase, but in aggregate remain lower than $2 billion as noted above. In addition, we have exposure to other severe weather events and wildfires, which impact catastrophe losses.
The Allstate Corporation 5
2020 Form 10-K Item 1. Business
We are promoting measures to prevent and mitigate losses and make homes and communities more resilient, including enactment of stronger building codes and effective enforcement of those
codes, adoption of sensible land use policies, and development of effective and affordable methods of improving the resilience of existing structures.
Products and distribution
Allstate Protection differentiates itself by offering solutions to meet broad-based household protection needs and a comprehensive range of innovative product options and features across distribution channels that best suit each consumer segment.
| | | | | | | | | | | | | | |
| Products |
Insurance products (1) | | Auto |
| Homeowners |
| Specialty auto (motorcycle, trailer, motor home and off-road vehicle) |
| Other personal lines (renters, condominium, landlord, boat, umbrella, manufactured home and stand-alone scheduled personal property) |
| Commercial lines |
| Answer Financial | | Comparison quotes and sales of non-proprietary auto, homeowners and other personal lines (condominium, renters, motorcycle, recreational vehicle and boat) |
(1)Insurance products are offered by the Allstate and Encompass brands.
| | | | | |
| Distribution |
| Allstate brand | In the U.S., we offer products through 10,400 Allstate exclusive agents operating in 10,300 locations, supported by 23,900 licensed sales professionals, and 1,000 exclusive financial specialists. We also offer products through 5,200 independent agents, contact centers and online. In Canada, we offer Allstate brand products through 1,000 employee sales agents. |
| Encompass brand | Distributed through 3,100 independent agents. |
| Answer Financial | Comparison quotes and sales offered to customers online or through contact centers. |
Allstate exclusive agents also support the Protection Services, Allstate Life and Allstate Benefits segments through offering roadside assistance, consumer protection plans, identity protection, life insurance and voluntary benefits products. We expect to discontinue sales of proprietary life insurance products during the second quarter of 2021, and will expand the non-proprietary product suite to include a range of life insurance products offered by third-party providers.
Exclusive agent compensation structure The compensation structure for Allstate exclusive agents rewards them for delivering high value to customers and achieving certain business outcomes such as profitable growth and household penetration. Allstate exclusive agent remuneration comprises a base commission, variable compensation and a bonus.
•Agents receive a monthly base commission payment as a percentage of their total eligible written premium.
•Variable compensation rewards agents for acquiring new customers by exceeding a base production goal.
•Bonus compensation is based on a percentage of premiums and can be earned by agents who are meeting certain sales goals and selling additional policies to meet customer needs profitably.
Compensation for 2021 includes a shift in variable compensation toward new business, including homeowners, and eliminates variable compensation for renewing customers. We are aligning agent compensation to emphasize growth while simultaneously improving customer service consistency.
Agents have the ability to earn commissions and additional bonuses on non-proprietary products provided to customers when an Allstate product is not available through Ivantage, a leading provider of property and casualty brokerage services, and arrangements made with other companies, agencies, and brokers. As of December 31, 2020, Ivantage had $1.94 billion non-proprietary premiums under management, consisting of approximately $1.72 billion of personal insurance premiums primarily related to property business in hurricane exposed areas, and approximately $222 million of commercial insurance premiums.
Item 1. Business 2020 Form 10-K
Additionally, we offer a homeowners product through our excess and surplus lines carrier, North Light Specialty Insurance Company, in certain areas with higher risk of catastrophes or where customers do not meet the Allstate brand standard underwriting profile.
Allstate agents and exclusive financial specialists receive commissions for proprietary and non-proprietary life and retirement sales and are eligible for a quarterly bonus based on the volume of non-proprietary sales.
Allstate independent agent remuneration comprises a base commission and a bonus that can be earned by agents who achieve sales goals and a target loss ratio.
| | | | | | | | | | | |
| Innovative product offerings and features |
| Market-leading solutions |
| Allstate brand | Your Choice Auto® | | Qualified customers choose from a variety of options, such as Accident Forgiveness, Deductible Rewards®, Safe Driving Bonus® and New Car Replacement. |
Allstate House and Home® | | Featured options include Claim RateGuard®, Claim-Free Bonus, Deductible Rewards® and flexibility in options and coverages, including graduated roof coverage and pricing based on roof type and age for damage related to wind and hail events. |
Claim Satisfaction Guarantee® | | Promised return of premium to standard auto insurance customers dissatisfied with their claims experience. |
| Bundling Benefits | | Auto customers with a qualifying property policy are provided an auto renewal guarantee and a deductible waiver (when the same event, with the same covered cause of loss, damages both auto and property). Offered in 47 states and District of Columbia (“D.C.”) as of December 31, 2020. |
New Car Replacement
Protection | | Replaces a qualifying customer’s vehicle (two model years old or less) involved in a total loss accident with a vehicle of the same or similar make and model. Offered in 50 states and D.C. as of December 31, 2020. |
| Encompass brand | EncompassOne® Policy | | Packaged insurance product with one premium, one bill, one policy deductible and one renewal date. Broad coverage options include customizable features such as enhanced accident forgiveness, new-car replacement coverage, walk-away home coverage option should the insured decide not to rebuild, flexible additional living expense coverage, water-sewer backup coverage options and roadside assistance. This product is offered in 36 states and the District of Columbia (“D.C.”) as of December 31, 2020. |
Surround Solutions by Encompass® | | Offers auto (6-months), homeowner and specialty lines products, pricing, services and support designed to provide flexibility and be customized based on consumer needs. Offered exclusively in four states for Encompass as of December 31, 2020. |
| Telematics solutions |
| Allstate brand | Drivewise® | | Telematics-based program, available in 50 states and the District of Columbia as of December 31, 2020, that uses a mobile application or an in-car device to capture driving behaviors and encourage safe driving. It provides customers with information and tools, incentives and driving challenges. For example, in most states, Allstate Rewards® provides reward points for safe driving. |
Milewise® | | Usage-based insurance product, available in 17 states as of December 31, 2020, that gives customers flexibility to customize their insurance and pay based on the number of miles they drive. |
DriveSense® | | Telematics-based insurance program offered by Esurance, available in 37 states as of December 31, 2020, that primarily uses a mobile application to capture driving behaviors and reward customers for safe driving. |
| Encompass brand | Routely® | | Telematics application, available in 18 states as of December 31, 2020, used to capture driving behaviors and reward customer participation. |
| Shared economy solutions |
| Allstate brand | Transportation Network Company Commercial Auto | | Commercial coverage of transportation networking company independent drivers during various phases of the ride sharing service. |
| | |
Allstate Ride for Hire®/ HostAdvantage® | | Supplemental personal insurance coverage for those using their vehicle to drive for a transportation network company or their house for peer-to-peer property sharing. |
The Allstate Corporation 7
2020 Form 10-K Item 1. Business
Competition
The personal lines insurance markets, including private passenger auto and homeowners insurance, are highly competitive. The following charts provide Allstate Protection’s combined market share compared to our principal U.S. competitors using statutory direct written premium for the year ended December 31, 2019, according to A.M. Best.
On January 4, 2021, we completed the acquisition of National General and we estimate that our market share in personal lines insurance will increase by 1.1%, totaling 10.0%, ranking Allstate as the second largest personal lines insurer in the United States, based on statutory direct written premium for the year ended December 31, 2019, according to A.M. Best.
Geographic markets
We primarily operate in the U.S (all 50 states and D.C.) and Canada. Our top geographic markets based on 2020 statutory direct premiums are reflected below. The geographic distribution does not include National General results.
Item 1. Business 2020 Form 10-K
Protection Services Segment
Our Protection Services segment accounted for 4.3% of Allstate’s 2020 consolidated total revenue and 77.5% of Allstate’s December 31, 2020 PIF. Protection Services includes AllstateSM Protection Plans, Allstate Dealer Services®, Allstate Roadside, Arity® and AllstateSM Identity Protection, which offer a broad range of products and services that expand and enhance customer value propositions.
Strategy - Protection Services are a key part of our strategy by expanding other protection businesses and increasing our total addressable market by delivering superior value propositions and building strategic platforms to connect and engage with customers and effectively address their changing needs and preferences.
| | | | | | | | |
| Allstate Protection Plans | | Expand distribution of consumer protection plan and technical support products through new and existing retail and mobile operator accounts while increasing profitability and returns. |
| Allstate Dealer Services | | Expand distribution of Allstate branded finance and insurance products and services through auto dealerships. |
| Allstate Roadside | | Modernize the roadside assistance business through technology and enhance capabilities to deliver a superior customer experience while improving efficiency and returns. |
| Arity | | Leverage analytics and deep understanding of driver risk to create a strategic platform. The platform will be used by those industries affected most by the changing face of transportation, including insurance companies, shared mobility companies and the automotive ecosystem. |
| Allstate Identity Protection | | Create a leading position in the identity protection market, offering full identity protection monitoring with proactive alerts, digital exposure reporting and identity theft reimbursement as well as expanding into other distribution channels. |
Products and distribution
| | | | | | | | |
| Products and services |
| Allstate Protection Plans | | Provides consumer protection plans and related technical support for mobile phones, consumer electronics, furniture and appliances which provide customers protection from mechanical or electrical failure, and in certain cases, accidental damage from handling. |
| Allstate Dealer Services | | Offers finance and insurance products, including vehicle service contracts, guaranteed asset protection waivers, road hazard tire and wheel protection, and paintless dent repair protection. |
Allstate Roadside | | Offers towing, jump-start, lockout, fuel delivery and tire change services to retail customers and customers of our wholesale partners. |
Arity | | Provides data and analytics solutions with the Arity platform using automotive telematics information. Customers receive value from our solutions either by using web-based software tools, white labeled mobile applications or through embedding our technology in their mobile applications. |
| Allstate Identity Protection | | Provides identity protection services including monitoring, alerts, remediation and a proprietary indicator of identity health. |
| | | | | | | | |
| Distribution channels |
| Allstate Protection Plans | | Major retailers in the U.S. and mobile operators in Europe. |
| Allstate Dealer Services | | Independent agents and brokers through auto dealerships in the U.S. in conjunction with the purchase of a new or used vehicle. |
| Allstate Roadside | | Allstate exclusive agents, wholesale partners, affinity groups and a mobile application. |
| Arity | | Sells directly to affiliate and non-affiliate customers and through strategic partners. |
| Allstate Identity Protection | | Primarily through workplace benefit programs and direct to consumer using the mobile application and online. |
Geographic markets
Protection Services primarily operate in the U.S. and Canada, with Allstate Protection Plans also offering services in Europe and Japan.
Competition
We compete on a variety of factors, including product offerings, brand recognition, financial strength, price, distribution and the customer experience. The market for these services is highly fragmented and competitive.
The Allstate Corporation 9
2020 Form 10-K Item 1. Business
Allstate Benefits Segment
Strategy
Our Allstate Benefits segment accounted for 2.6% of Allstate’s 2020 consolidated total revenue and 2.2% of Allstate’s December 31, 2020 PIF. The Allstate Benefits segment provides consumers with financial protection against the risk of accidents, illness and mortality. We are among the industry leaders in the growing and highly competitive voluntary benefits market, offering a broad range of products through workplace enrollment. Our life insurance portfolio includes individual and group permanent life solutions. Target customers are middle market consumers with family and financial protection needs employed by small, medium and large sized firms. Allstate Benefits is well represented in all market segments and is a leader in the large and mega (over 10,000 employees) market segments.
Our products are offered through independent agents, benefits brokers and Allstate exclusive agents. Allstate Benefits is differentiated through its broad product portfolio, flexible enrollment solutions, strong national accounts team and well-recognized brand.
Our strategy for growth is to deliver substantially more value through innovative products and technology, tailored solutions and exceptional service through investments in future-state technologies and data and analytics capabilities.
Products and distribution
| | | | | | | | |
| Voluntary benefits products |
| Life | | Hospital |
| Accident | | Short-term disability |
Critical illness
| | Other health |
| | |
| Distribution channels |
| 4,160 workplace enrolling independent agents and benefits brokers. |
| Allstate exclusive agents, focusing on small employers. |
On January 4, 2021, we completed the acquisition of National General. National General’s accident and health products include accident and non-major medical health insurance products and will be included in the Allstate Benefits segment. These products are offered direct to consumers through call centers and the internet, and through independent agents, general agencies, affinity relationships and the workplace.
Competition
We compete on a wide variety of factors, including product offerings, brand recognition, financial strength and ratings, price, distribution and customer service.
The market for voluntary benefits is growing as these products help employees fill the increasing gaps associated with continued medical cost inflation and the shifting of costs from employers to employees to cover co-pays and deductibles. Favorable industry and economic trends have increased competitive pressure and attracted new traditional and non-traditional entrants to the voluntary benefits market. Recent entrants, including large group medical, life and disability insurance carriers, are leveraging core benefit capabilities by bundling and discounting to capture voluntary market share.
Geographic markets
We primarily operate in the U.S. (all 50 states and D.C.) and Canada. The top geographic markets based on 2020 statutory direct premiums are reflected below. 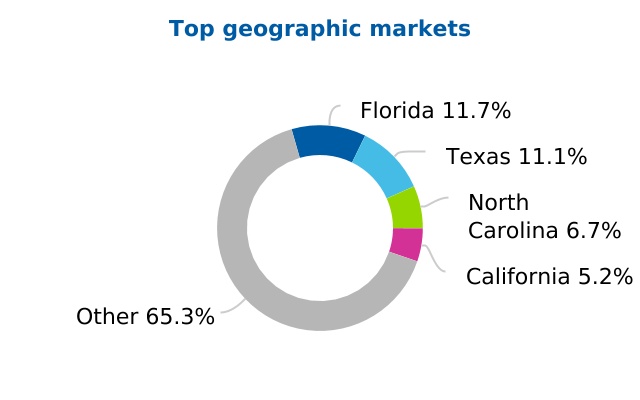
Item 1. Business 2020 Form 10-K
Pending Sale of ALIC and Certain Affiliates
We announced the pending sale of ALIC and certain affiliates, which represents approximately 90% of Allstate Life and 75% of Allstate Annuities reserves for life-contingent contract benefits and contractholder funds. Allstate will retain ownership of ALNY while pursuing alternatives to sell or otherwise transfer risk to a third party. We expect to discontinue sales of proprietary life insurance products during the second quarter of 2021.
Allstate Life Segment
Strategy
Our Allstate Life segment accounted for 4.4% of Allstate’s 2020 consolidated total revenue and 1.1% of Allstate’s December 31, 2020 PIF.
Our strategy is to broaden Allstate’s customer relationships and value proposition. Target customers are middle market consumers with family and financial protection needs. Our business consists of traditional, interest-sensitive and variable life insurance sold through Allstate exclusive agents and exclusive financial specialists. Allstate exclusive agents and exclusive financial specialists also sell certain non-proprietary products offered by third-party providers, including mutual funds, fixed and variable annuities, disability insurance, and long-term care insurance to provide a broad suite of protection and retirement products. As of December 31, 2020, Allstate agencies had approximately $17.9 billion of non-proprietary mutual funds and fixed and variable annuity account balances under management. New and additional deposits into these non-proprietary products were $2.2 billion in 2020.
We will expand the non-proprietary product suite available for distribution to include a range of life insurance products offered by third-party providers.
Competition
We compete on a variety of factors, including product offerings, brand recognition, financial strength and ratings, price, distribution and customer service. The market for life insurance continues to be highly fragmented and competitive. As of December 31, 2019, there were approximately 335 groups of life insurance companies in the United States.
Geographic markets
We operate in the U.S. (all 50 states and D.C.). Our top geographic markets based on 2020 statutory direct premiums are reflected below.
Allstate Annuities Segment
Strategy
Our Allstate Annuities segment accounted for 2.3% of Allstate’s 2020 consolidated total revenue and 0.1% of Allstate’s December 31, 2020 PIF. The Allstate Annuities segment consists primarily of deferred fixed annuities and immediate fixed annuities (including standard and sub-standard structured settlements).
The segment is in run-off and is focused on increasing lifetime economic value. Both the deferred and immediate annuity businesses have been adversely impacted by the historically low interest rate environment. Our immediate annuity business has also been impacted by medical advancements that have resulted in annuitants living longer than anticipated when many of these contracts were originated.
Allstate Annuities focuses on the distinct risk and return profiles of the specific products when developing investment and liability management strategies. The level of legacy deferred annuities in force has been significantly reduced and the investment portfolio and crediting rates are proactively managed to improve profitability of the business while providing appropriate levels of liquidity.
The investment portfolio supporting our immediate annuities is managed to ensure the assets match the characteristics of the liabilities and provide the long-term returns needed to support this business. To better match the long-term nature of our immediate annuities, we use performance-based investments (primarily limited partnership investments) in which we have ownership interests and a greater proportion of return is derived from idiosyncratic asset or operating performance.
The Allstate Corporation 11
2020 Form 10-K Item 1. Business
Other Business Segments
Discontinued Lines and Coverages Segment
The Discontinued Lines and Coverages segment includes results from property and casualty insurance coverage that primarily relates to policies written during the 1960s through the mid-1980s.
Strategy Management of this segment has been assigned to a designated group of professionals with expertise in claims handling, policy coverage interpretation, exposure identification, litigation and reinsurance collection. As part of its responsibilities, this group pursues settlement agreements including policy buybacks on direct excess commercial business when appropriate to improve the certainty of the liabilities. At the end of 2020, 67.0% of the direct excess gross case reserves were attributable to settlement agreements. This group also manages other direct commercial and assumed reinsurance business in runoff and engages in reinsurance ceded and assumed commutations as required or when considered economically advantageous.
Changes in the reserves established for asbestos, environmental and other discontinued lines losses have occurred and may continue. Reserve changes can be caused by new information relating to new and additional claims, new exposures or the impact of resolving unsettled claims based on unanticipated events such as arbitrations, litigation, legislative, judicial or regulatory actions. Environmental losses may also increase as the result of additional funding for environmental site clean-up.
Challenges related to the concentration of insurance and reinsurance claims from companies who specialize in this business continue to be addressed.
Corporate and Other Segment
Our Corporate and Other segment is comprised of holding company activities and certain non-insurance operations, including expenses associated with strategic initiatives.
Item 1. Business 2020 Form 10-K
Regulation
Allstate is subject to extensive regulation, primarily at the state level. The method, extent and substance of such regulation vary by state but generally have their source in statutes that establish standards and requirements for conducting the business of insurance and that also delegate regulatory authority to a state agency. These rules have a substantial effect on our business and relate to a wide variety of matters, including insurer solvency and statutory surplus sufficiency, reserve adequacy, insurance company licensing and examination, agent and adjuster licensing, agent and broker compensation, policy forms, rate setting, the nature and amount of investments, claims practices, participation in shared markets and guaranty funds, transactions with affiliates, the payment of dividends, underwriting standards, statutory accounting methods, trade practices, privacy regulation and data security, corporate governance and risk management. In addition, state legislators and insurance regulators continue to examine the appropriate nature and scope of state insurance regulation. For a discussion of statutory financial information, see Note 16 of the consolidated financial statements.
 For a discussion of regulatory contingencies, see Note 14 of the consolidated financial statements. Notes 14 and 16 are incorporated in this Part I, Item 1 by reference.
As part of an effort to strengthen the regulation of the financial services market, the Dodd-Frank Wall Street Reform and Consumer Protection Act (“Dodd-Frank”) was enacted in 2010. Dodd-Frank created the Federal Insurance Office (“FIO”) within the U.S. Department of the Treasury (“Treasury”). The FIO monitors the insurance industry, provides advice to the Financial Stability Oversight Council (“FSOC”), represents the U.S. on international insurance matters, and studies the current regulatory system.
Additional regulations or new requirements may emerge from the activities of various regulatory entities, including the Federal Reserve Board, FIO, FSOC, the National Association of Insurance Commissioners (“NAIC”), and the International Association of Insurance Supervisors (“IAIS”), that are evaluating solvency and capital standards for insurance company groups. In addition, the NAIC has adopted amendments to its model holding company law that have been adopted by some jurisdictions. The outcome of these actions is uncertain; however, these actions may result in an increase in the level of capital and liquidity required by insurance holding companies.
We cannot predict whether any specific state or federal measures will be adopted to change the nature or scope of the regulation of insurance or what effect any such measures would have on Allstate. We are working for changes in the regulatory environment to make insurance more available and affordable for customers, encourage market innovation, improve driving safety, strengthen cybersecurity, promote better catastrophe preparedness and loss mitigation
and advocate for appropriate long-term capital standards to support optimal risk adjusted returns.
Limitations on Dividends by Insurance Subsidiaries. As a holding company with no significant business operations of its own, The Allstate Corporation relies on dividends from Allstate Insurance Company as one of the principal sources of cash to pay dividends and to meet its obligations, including the payment of principal and interest on debt or to fund non-insurance-related businesses. Allstate Insurance Company is regulated as an insurance company in Illinois, and its ability to pay dividends is restricted by Illinois law. The laws of the other jurisdictions that generally govern our other insurance subsidiaries contain similar limitations on the payment of dividends. However, such laws in some jurisdictions may be more restrictive.
For additional information regarding limitations, see Part II, Item 7 - Management’s Discussion and Analysis of Financial Condition and Results of Operations of this report. In addition, the NAIC has formed a working group for the development of a group capital calculation covering all entities of the insurance company group for use in solvency monitoring activities. The calculation is intended to provide analytical information and we do not expect potential revisions to impact our current dividend plans, any increase in the amount of capital or reserves our insurance subsidiaries are required to hold could reduce the amount of future dividends such subsidiaries are able to distribute to the holding company. Any reduction in the RBC ratios of our insurance subsidiaries could also adversely affect their financial strength ratings as determined by statistical rating agencies.
Insurance Holding Company Regulation – Change of Control. The Allstate Corporation and Allstate Insurance Company are insurance holding companies subject to regulation in the jurisdictions in which their insurance subsidiaries, including the insurance subsidiaries of National General, do business. In the U.S., these subsidiaries are organized under the insurance codes of Alabama, California, Florida, Illinois, Indiana, Massachusetts, Michigan, Mississippi, Missouri, New Jersey, New York, North Carolina, South Carolina and Texas. Additionally, some of these subsidiaries are considered commercially domiciled in California and Florida.
Generally, the insurance codes in these states provide that the acquisition or change of “control” of a domestic or commercially domiciled insurer or of any person that controls such an insurer cannot be consummated without the prior approval of the relevant insurance regulator. In general, a presumption of “control” arises from the ownership, control, possession with the power to vote, or possession of proxies with respect to ten percent or more of the voting securities of an insurer or of a person who controls an insurer. In addition, certain state insurance laws require pre-acquisition notification to state
The Allstate Corporation 13
2020 Form 10-K Item 1. Business
agencies of a change in control with respect to a non-domestic insurance company licensed to do business in that state. While such pre-acquisition notification statutes do not authorize the state agency to disapprove the change of control, such statutes do authorize certain remedies, including the issuance of a cease-and-desist order with respect to the non-domestic insurer if certain conditions exist, such as undue market concentration.
Thus, any transaction involving the acquisition of ten percent or more of The Allstate Corporation’s common stock would generally require prior approval by the state insurance departments in Alabama (where the threshold is five percent or more of The Allstate Corporation’s common stock), California, Florida, Illinois, Indiana, Massachusetts, Michigan, Mississippi, Missouri, New Jersey, New York, North Carolina, South Carolina and Texas. Moreover, notification would be required in those other states that have adopted pre-acquisition notification provisions and where the insurance subsidiaries are admitted to transact business. Such approval requirements may deter, delay or prevent certain transactions affecting the ownership of The Allstate Corporation’s common stock.
Rate Regulation. Nearly all states have insurance laws requiring personal property and casualty insurers to file rating plans, policy or coverage forms, and other information with the state’s regulatory authority. In many cases, such rating plans, policy forms, or both must be approved prior to use.
The speed with which an insurer can change rates in response to competition or increasing costs depends on the state rating laws, which include the following categories:
•Prior approval — Regulators must approve a rate before the insurer may use it
•File-and-use — Insurers do not have to wait for the regulator’s approval to use a rate, but the rate must be filed with the regulatory authority prior to being used
•Use-and-file — Requires an insurer to file rates within a certain period of time after the insurer begins using them
•No approval — One state, with an immaterial amount of written premiums, does not impose a rate filing requirement
Under these rating laws, the regulator has the authority to disapprove a rate filing. The percentage of 2020 statutory direct written premiums based on state rating laws are reflected below.
An insurer’s ability to adjust its rates in response to competition or to changing costs is dependent on an insurer’s ability to demonstrate to the regulator that its rates or proposed rating plan meets the requirements of the rating laws. In those states that significantly restrict an insurer’s discretion in selecting the business that it wants to underwrite, an insurer can manage its risk of loss by charging a rate that reflects the cost and expense of providing the insurance. In those states that significantly restrict an insurer’s ability to charge a rate that reflects the cost and expense of providing the insurance, the insurer can manage its risk of loss by being more selective in the type of business it underwrites. When a state significantly restricts both underwriting and pricing, it becomes more difficult for an insurer to maintain its profitability.
From time to time, the personal lines insurance industry comes under pressure from state regulators, legislators, and special-interest groups to reduce, freeze, or set rates at levels that do not correspond with our analysis of underlying costs, catastrophe loss exposure, and expenses. We expect this kind of pressure to persist. Allstate and other insurers are using increasingly sophisticated pricing models and rating plans that are reviewed by regulators and special-interest groups. State regulators may interpret existing law or rely on future legislation or regulations to impose new restrictions that adversely affect profitability or growth. We cannot predict the impact on our business of possible future legislative and regulatory measures regarding insurance rates.
Involuntary Markets. As a condition of maintaining our licenses to write personal property and casualty insurance in various states, we are required to participate in assigned risk plans, reinsurance facilities, and joint underwriting associations that provide various types of insurance coverage to individuals or entities that otherwise are unable to purchase such coverage from private insurers. Underwriting results related to these arrangements, which tend to be adverse, have been immaterial to our results of operations.
For a discussion of these items see Note 14 of the consolidated financial statements. Note 14 is incorporated in this Part I, Item 1 by reference. Indemnification Programs. We are a participant in state-based industry pools, facilities or associations, mandating participation by insurers offering certain coverage in their state, including the Michigan Catastrophic Claims Association (“MCCA”), the New Jersey Property-Liability Insurance Guaranty Association, the North Carolina Reinsurance Facility and the Florida Hurricane Catastrophe Fund. We also participate in the Federal Government National Flood Insurance Program.
Recent regulatory changes have occurred related to the MCCA. At this time, we are unable to determine whether, or to what extent, these changes will have on our claims and claims expense reserves and corresponding MCCA indemnification recoverables.
•On August 6, 2020, member companies of the MCCA were notified of the ratification of
Item 1. Business 2020 Form 10-K
amendments to the MCCA’s Plan of Operation. The amendments were designed to align the Plan of Operation with Public Acts 21 and 22, which passed in 2019.
•On July 2, 2020, portions of Public Acts 21 and 22 went into effect. The changes under those laws include:
–Allowing insureds to choose levels of personal injury protection coverage, including the option to opt-out of personal injury protection coverage in certain circumstances.
–Implementing mandated rate reductions that correspond to the level of personal injury protection coverage chosen by insureds.
–Implementing or creating new processes for reviewing claims, assessing allowable expenses and setting limits on certain allowable expenses.
•On July 2, 2021, legislation passed in 2019 will become effective, setting fee schedules for personal injury protection claims. Such fee schedules will be set at 200% of Medicare rates in 2021, declining to 195% in 2022 and 190% in 2023, for any providers other than certain unique categories of providers and applying to treatment on existing and new claims.
•Other legislative proposals to change the MCCA operation in the future and to adjust Public Acts 21 and 22 are put forth periodically.
For a discussion of these items see Note 10 of the consolidated financial statements. Note 10 is incorporated in this Part I, Item 1 by reference. Guaranty Funds. Under state insurance guaranty fund laws, insurers doing business in a state can be assessed, up to prescribed limits, in order to cover certain obligations of insolvent insurance companies. We do not anticipate any material adverse financial impact on Allstate from these assessments.
Investment Regulation. Our insurance subsidiaries are subject to state regulation that specifies the types of investments that can be made and concentration limits of invested assets. Failure to comply with these rules leads to the treatment of non-conforming investments as non-admitted assets for purposes of measuring statutory surplus. Further, in some instances, these rules require divestiture of non-conforming investments.
Exiting Geographic Markets; Canceling and Non-Renewing Policies. Most states regulate an insurer’s ability to exit a market. For example, states may limit, to varying degrees, an insurer’s ability to cancel and non-renew policies. Some states restrict or prohibit an insurer from withdrawing one or more types of insurance business from the state, except pursuant to a plan that is approved by the state insurance department. Regulations that limit cancellation and non-renewal and that subject withdrawal plans to prior approval requirements may restrict an insurer’s ability to exit unprofitable markets.
Variable Life Insurance and Registered Fixed Annuities. The sale and administration of variable life insurance and registered fixed annuities with market value adjustment features are subject to extensive regulatory oversight at the federal and state level, including regulation and supervision by the Securities and Exchange Commission (“SEC”) and the Financial Industry Regulatory Authority (“FINRA”).
Broker-Dealers, Investment Advisors and Investment Companies. The Allstate entities that operate as broker-dealers, registered investment advisors, and investment companies are subject to regulation and supervision by the SEC, FINRA and/or, in some cases, state securities administrators. Certain state and federal regulators are considering or have implemented best interest or fiduciary standards. Such standards could impact products provided by Allstate agents and Allstate’s broker-dealers, their sales processes, sales volume, and producer compensation arrangements.
Dodd-Frank: Covered Agreement. The Secretary of the Treasury (operating through FIO) and the Office of the U.S. Trade Representative (“USTR”) are jointly authorized, pursuant to the Dodd-Frank, to negotiate Covered Agreements. A Covered Agreement is a bilateral or multilateral agreement that “relates to the recognition of prudential measures with respect to the business of insurance or reinsurance that achieves a level of protection for insurance or reinsurance consumers that is substantially equivalent to the level of protection achieved under State insurance or reinsurance regulation.”
On September 22, 2017, the U.S. and European Union (“EU”) signed a Covered Agreement. In addition to signing the Covered Agreement, Treasury and the USTR jointly issued a policy statement clarifying how the U.S. views implementation of certain provisions of the Covered Agreement. The policy statement affirms the U.S. system of insurance regulation, including the role of state insurance regulators as the primary supervisors of the business of insurance and addresses several other key provisions of the Covered Agreement for which constituents sought clarity, including prospective application to reinsurance agreements and an affirmation that the Covered Agreement does not require development of a group capital standard or group capital requirement in the U.S.
The U.S. has five years from the date of signing to amend its credit for reinsurance laws and regulations to conform with the requirements of the Covered Agreement or face federal preemption determinations by the FIO. To address the requirements of the Covered Agreement, the NAIC has formally adopted revisions to its existing credit for reinsurance model law and model regulation to conform with the requirements of the Covered Agreement with the expectation that states will adopt and implement the modified model law and regulation by September 2022.
On December 19, 2018, the U.S. and the United Kingdom (“UK”) signed a separate Covered Agreement consistent with the U.S.-EU Covered Agreement to
The Allstate Corporation 15
2020 Form 10-K Item 1. Business
coordinate regulation of the insurance industry doing business in the U.S. and UK. Consistent with the U.S.-EU Covered Agreement (the “Agreement”) signed in 2017, Treasury and the USTR also issued a policy statement regarding implementation of the Agreement affirming the role that state insurance regulators play as the primary supervisors of the U.S. insurance industry.
Division Statute. On November 27, 2018, the Illinois General Assembly passed legislation authorizing a statute that makes available a process by which a domestic insurance company may divide into two or more domestic insurance companies. The statute, which became effective January 1, 2019, can be used to divide continuing blocks of insurance business from insurance business no longer marketed, or otherwise has been discontinued, into separate companies with separate capital. The statute can also be used for sale to a third party or to manage risks associated with indemnification programs. Before a plan of division can be effected it must be approved according to the organizational documents of the dividing insurer and submitted for approval by the Illinois Department of Insurance.
Privacy Regulation and Data Security. Federal law and the laws of many states require financial institutions to protect the security and confidentiality of consumer information and to notify consumers about their policies and practices relating to collection, use, and disclosure of consumer information and their policies relating to protecting the security and confidentiality of that information. Federal law and the laws of many states also regulate disclosures and disposal of consumer information. Congress, state legislatures, and regulatory authorities are expected to consider additional regulation relating to privacy and other aspects of consumer information.
For example, the California Consumer Privacy Act, which took effect in January 2020, adopted significant compliance requirements for businesses that collect personal information on California residents. In addition, the California Privacy Rights Act, which expands consumer privacy rights and establishes a new privacy regulatory agency, was passed in November 2020 and will become effective in January 2023. Further, the New York State Department of Financial Services cybersecurity regulation and the NAIC Insurance Data Security Model Law, which has been adopted in some form by several states, establish standards for data security and for the investigation of and notification to insurance commissioners of cybersecurity events. Additional states are also likely to adopt similarly themed cybersecurity requirements in the future. We cannot predict the impact on our business of possible future legislative measures regarding privacy or cybersecurity.
Asbestos. Congress has repeatedly considered legislation to address asbestos claims and litigation in the past. We cannot predict the impact on our business of possible future legislative measures regarding asbestos.
Environmental. Environmental pollution and clean-up of polluted waste sites is the subject of federal and state regulation. The Comprehensive Environmental Response Compensation and Liability Act of 1980 (the “Superfund”) and comparable state statutes (the “mini-Superfunds”) govern the clean-up and restoration of waste sites by Potentially Responsible Parties (“PRPs”). The Superfund and the mini-Superfunds (collectively, the “Environmental Clean-up Laws” or “ECLs”) establish a mechanism to assign liability to PRPs or to fund the clean-up of waste sites if PRPs fail to do so. The extent of liability to be allocated to a PRP depends on a variety of factors. The insurance industry is involved in extensive litigation regarding coverage issues arising out of the clean-up of waste sites by insured PRPs and the insured parties’ alleged liability to third parties responsible for the clean-up. The insurance industry, including Allstate, has disputed and is disputing many such claims. Key coverage issues include whether the Superfund response, investigation, and clean-up costs are considered damages under the policies; whether coverage has been triggered; whether any pollution exclusion applies; whether there has been proper notice of claims; whether administrative liability triggers the duty to defend; whether there is an appropriate allocation of liability among potentially responsible insurers; and whether the liability in question falls within the definition of an “occurrence.” Identical coverage issues exist for clean-up and waste sites not covered under the Superfund. To date, courts have been inconsistent in their rulings on these issues.
Allstate’s exposure to liability with regard to its insureds that have been, or may be, named as PRPs is uncertain. While comprehensive Superfund reform proposals have been introduced in Congress, only modest reform measures have been enacted. In May 2017, the Environmental Protection Agency created a Superfund Task Force that issued proposed reforms in a July 2018 report. These recommendations address expediting clean-up and remediation processes, reducing the financial burden of the clean-up process, encouraging private investment, promoting redevelopment and community revitalization, and building and strengthening partnerships. We cannot predict which, if any, of these reforms will be enacted.
Developments in the insurance and reinsurance industries have fostered a movement to segregate asbestos, environmental and other discontinued lines exposures into separate legal entities with dedicated capital. Regulatory bodies in certain cases have supported these actions. We are unable to determine the impact, if any, that these developments will have on the collectability of reinsurance recoverables in the future.
Item 1. Business 2020 Form 10-K
 Human Capital
 Allstate’s success is highly dependent on human capital. The wellbeing of our employees is a key priority, and Allstate strives to promote a dynamic and welcoming workplace that promotes inclusive diversity and equity, fosters collaboration and encourages employees to bring their best ideas to work every day. As of December 31, 2020, Allstate had approximately 41,860 full-time employees and 300 part-time employees.
Allstate’s human capital management focuses on the following priorities:
Inclusive Diversity and Equity (“IDE”) We strive for a workforce where the breadth of our diversity makes us a better company. IDE is one of Allstate’s core values and serves as a foundation of Our Shared Purpose.
| | | | | | | | |
U.S. workforce diversity as of December 31, 2020 |
| Women | | 55% |
| Racially and ethnically diverse | | 39% |
•We track our workforce composition data over time to determine if we are making appropriate progress in advancing gender and racial representation in our employee population and we disclose our progress. In our Sustainability Report, we provide, among other things, five years of workforce composition data that shows a breakdown of salaried, hourly and management employees by gender and race.
•As part of our commitment to fair and equitable compensation practices, we complete an annual pay equity analysis. Over the past two years, we engaged an external firm to provide a more detailed analysis to identify potential pay gaps across substantially similar employee groups as well as identify policies, practices or systematic issues that may contribute to pay gaps now or over time. The external analyses found that Allstate’s results compared well to benchmarks for companies of similar size and scope.
•Allstate’s Employee Resource Group (“ERG”) Program and the Enterprise Diversity Leadership Council (“EDLC”) help advance IDE.
–ERGs: We support and fund 11 ERGs. ERGs offer specific opportunities for employees to partner and collaborate with each other through professional development workshops, recruiting events, volunteer projects and mentoring. Officers from across the enterprise, leverage their time, networks and resources to support the ERGs and advance IDE at Allstate.
–EDLC: The EDLC is made up of senior leaders throughout the organization and focuses on driving targeted results for IDE by identifying and prioritizing action, taking accountability for achieving targeted results and ensuring
clarity and understanding of the business relevance of IDE. The EDLC provides updates to our chief executive officer.
•In 2020, employees completed 30,827 courses on IDE. The number of courses completed in June through December 2020 comprised more than double the total of IDE courses completed in all of 2019. Three new virtual, instructor-led sessions were launched in July 2020, in line with our focus on reflection, learning and action.
•Allstate continues to look for ways to build awareness and drive action. In response to the unprecedented events in 2020, we:
–Began observing Juneteenth as an annual company holiday
–Launched an Anti-Racism Resource Center for employees
–Expanded the “Inclusive Conversations” series to monthly, hosted, enterprise-level sessions to build off themes of racial inequity, allyship, privilege and other relevant topics
–Founding member of OneTen (with other leading CEOs and organizations), an organization committed to upskilling, hiring and promoting one million Black Americans over the next 10 years into family-sustaining jobs with opportunities for advancement
•An external comprehensive IDE assessment will be completed in 2021 and will include a full assessment of our programs, policies, processes, procedures, and practices to ensure that we are building, maintaining and supporting fully sustainable and equitable programs at Allstate.
Employee Wellbeing and Safety We take seriously our responsibility to care for employees’ well-being, devoting resources to employee health and safety.
•The Coronavirus made Allstate even more focused on employees’ health and safety.
–In just one week, we transitioned 95% of our workforce to working remotely.
–As part of the Good Office program, we shipped over 50,000 office items to our employees to help them work more productively at home.
–We established Coronavirus hotlines for employees and continued to pay employees who could not work remotely under shelter-in-place orders.
–During the fourth quarter of 2020, we announced the Holiday Support Program, which helped provide financial relief to approximately 5,000 employees experiencing financial hardships due to the Coronavirus.
–Enhanced safety guidelines, cleaning protocols and social distancing practices remain in place for in-office workers.
The Allstate Corporation 17
2020 Form 10-K Item 1. Business
•We conduct wellbeing assessments for employees to help determine which services, programming and benefits to offer the workforce. The assessment asks about physical, emotional, mental and financial wellbeing. Completing the assessment lowers the cost of benefits to employees.
•We offer resilience and stress management programs to improve employee wellbeing, including Energy for Life, a workshop on employee wellness to help employees articulate and pursue their individual purpose and embrace new challenges with ease. Over 39,000 employees have taken this wellness workshop since 2010.
•The ERGs provided multiple forums in 2020 to share wellness resources and support for their members.
•Wellbeing Champions promote Allstate’s health and wellness resources across the enterprise, including yoga and meditation classes and flu shots.
Talent Recruitment and Management We seek to provide employees with rewarding work, professional growth and educational opportunities.
•Our flexible work and equal opportunity policies support talent attraction and retention.
•Employees receive an annual performance review, with additional performance conversations taking place throughout the year. Allstate invests in training and re-skilling opportunities so employees can be successful throughout their careers. In 2020:
–Employees completed over 139,000 hours in formal learning opportunities.
–7,000 employees attended Allstate’s Global Learning Week, with over 2,000 development commitments made to grow one new skill by the end of the year.
–Over 1,000 employees attended Quarterly Skill Builders featuring external experts facilitating topics including data visualization, storytelling and talent development.
–702 employees participated in Allstate’s tuition reimbursement program, with $3.3 million paid in tuition reimbursement.
–42% of open positions were filled with internal applicants.
•The Power of Mentoring for Inclusive Diversity (“MInD”) program engaged 74 women and racially and ethnically diverse high potential managers, senior managers and directors who were nominated to receive sponsorship, job shadowing, and networking opportunities.
Organizational Culture At Allstate, we believe that when your passion fuels your purpose, you can achieve anything. We expect all employees to be leaders and dedicate extensive resources to developing leaders at all levels.
•Allstate defines culture as a self-sustaining system of shared values, priorities and principles that shape beliefs and drive behaviors and decision-making within an organization.
•In 2020, we updated Our Shared Purpose to reflect the evolution of our culture to drive our business strategy.
For additional information, please see the section titled “Spotlight on Human Capital Management” in our 2020 Proxy Statement. In addition to the above discussion of our employees, please see information about Allstate agents under the caption “Allstate Protection Segment - Products and Distribution” in Part I, Item 1 of this report.
Item 1. Business 2020 Form 10-K
Website
Our website is allstate.com. The Allstate Corporation’s annual reports on Form 10-K, quarterly reports on Form 10-Q, current reports on Form 8-K and any amendments to such reports that we file or furnish pursuant to Section 13(a) of the Securities Exchange Act of 1934 are available on the Investor Relations section of our website (www.allstateinvestors.com), free of charge, as soon as reasonably practicable after they are electronically filed or furnished to the SEC. In addition, our Corporate Governance Guidelines, our Global Code of Business Conduct, and the charters of our Audit Committee, Compensation and Succession Committee, Nominating, Governance and Social Responsibility Committee, Executive Committee and Risk and Return Committee are available on the Investor Relations section of our website and in print to any stockholder who requests copies by contacting Investor Relations, The Allstate Corporation, 2775 Sanders Road, Northbrook, Illinois 60062-6127, 1-847-402-2800. The information found on our website is not incorporated by reference into this Annual Report on Form 10-K or in any other report or document filed with the SEC.
Other Information About Allstate
•Allstate’s seven reportable segments use shared services, including human resources, investment, finance, information technology and legal services, provided by Allstate Insurance Company and other affiliates.
•Although the insurance business generally is not seasonal, claims and claims expense for the Allstate Protection segment tend to be higher for periods of severe or inclement weather.
•“Allstate®” is a very well-recognized brand name in the United States. We use the “Allstate®, “Encompass®” and “Answer Financial®” brands extensively in our business. We also provide additional protection products and services through “AllstateSM Protection Plans”, “Allstate Dealer Services®”, “Allstate Roadside”, “Arity®”, “AllstateSM Identity Protection” and “Allstate Benefits®”. These brands, products and services are supported with the related service marks, logos, and slogans. Our rights in the United States to these names, service marks, logos and slogans continue as long as we continue to use them in commerce. Many service marks used by Allstate are the subject of renewable U.S. and/or foreign service mark registrations. We believe that these service marks are important to our business and we intend to maintain our rights to them.
The Allstate Corporation 19
2020 Form 10-K Item 1. Business
Information about our Executive Officers
The following table sets forth the names of our executive officers, their ages as of February 1, 2021, their positions, business experience, and the years of their first election as officers. “AIC” refers to Allstate Insurance Company. Each of the officers named below may be removed from office at any time, with or without cause, by the board of directors of the relevant company.
| | | | | | | | | | | | | | | | | | | | |
| Name | | Age | | Position with Allstate and Business Experience | | Year First Elected Officer |
| Thomas J. Wilson | | 63 | | Chair of the Board (May 2008 to present), President (June 2005 to January 2015 and February 2018 to present), and Chief Executive Officer (January 2007 to present) of The Allstate Corporation and AIC. | | 1995 |
| Carolyn D. Blair | | 52 | | Executive Vice President and Chief Human Resources Officer of AIC (October 2019 to present); President of Tartan Advisory Group, Inc. (November 2018 to October 2019); Executive Vice President, Chief Human Resources & Communications Officer of Sun Life Financial (April 2014 to June 2018). | | 2019 |
| Elizabeth A. Brady | | 56 | | Executive Vice President, Chief Marketing, Customer and Communications Officer of AIC (January 2020 to present); Executive Vice President and Chief Marketing, Innovation and Corporate Relations Officer of AIC (August 2018 to January 2020); Senior Vice President, Global Brand Management of Kohler Co. (November 2013 to July 2018). | | 2018 |
| Don Civgin | | 59 | | Vice Chair of The Allstate Corporation and AIC (March 2020 to present) and Chief Executive Officer, Protection Products and Services of AIC (January 2020 to present); President, Service Businesses of AIC (January 2018 to January 2020); President, Emerging Businesses of AIC (February 2015 to January 2018). | | 2008 |
John E. Dugenske
| | 54 | | President, Investments and Financial Products of AIC (January 2020 to present); Executive Vice President and Chief Investment and Corporate Strategy Officer of AIC (January 2018 to January 2020); Executive Vice President and Chief Investment Officer of AIC (March 2017 to January 2018); Group Managing Director and Global Head of Fixed Income at UBS Global Asset Management (December 2008 to February 2017). | | 2017 |
| Rhonda S. Ferguson | | 51 | | Executive Vice President, Chief Legal Officer, General Counsel, and Secretary of The Allstate Corporation and AIC (November 2020 to present); Executive Vice President and General Counsel of The Allstate Corporation and AIC (September 2020 to November 2020); Executive Vice President, Chief Legal Officer and Corporate Secretary of Union Pacific Railroad (December 2017 to September 2020); Executive Vice President and Chief Legal Officer of Union Pacific Railroad (July 2016 to December 2017); Vice President, Corporate Secretary and Chief Ethics Officer of FirstEnergy Corp. (April 2007 to June 2016). | | 2020 |
| Suren Gupta | | 59 | | Executive Vice President, Chief Information Technology and Enterprise Services Officer of AIC (January 2020 to present); Executive Vice President, Enterprise Technology and Strategic Ventures of AIC (February 2015 to January 2020). | | 2011 |
| Susan L. Lees | | 63 | | Executive Vice President, Chief Sustainability Officer of AIC (November 2020 to present); Executive Vice President, Chief Legal Officer and Secretary of The Allstate Corporation and AIC (September 2020 to November 2020); Executive Vice President, Chief Legal Officer, General Counsel, and Secretary of The Allstate Corporation and AIC (January 2020 to September 2020); Executive Vice President, General Counsel, and Secretary of The Allstate Corporation (May 2013 to January 2020) and of AIC (June 2013 to January 2020). | | 2008 |
| Jesse E. Merten | | 46 | | President, Financial Products of AIC (May 2020 to present); Executive Vice President and Chief Risk Officer of AIC (December 2017 to May 2020); Treasurer of The Allstate Corporation (January 2015 to April 2019) and of AIC (February 2015 to May 2019).
| | 2012 |
| John C. Pintozzi | | 55 | | Senior Vice President, Controller and Chief Accounting Officer of The Allstate Corporation (August 2019 to present) and of AIC (September 2019 to present); Senior Vice President and Chief Financial Officer, Allstate Investments (May 2012 to August 2019) | | 2005 |
| Mark Q. Prindiville | | 53 | | Executive Vice President and Chief Risk Officer of AIC (May 2020 to present); Senior Vice President of AIC (September 2016 to May 2020); Vice President of AIC (March 2011 to September 2016). | | 2016 |
| Mario Rizzo | | 54 | | Executive Vice President and Chief Financial Officer of The Allstate Corporation and AIC (January 2018 to present); Senior Vice President and Chief Financial Officer, Allstate Personal Lines of AIC (February 2015 to January 2018).
| | 2010 |
| Glenn T. Shapiro | | 55 | | President, Personal Property-Liability of AIC (January 2020 to present); President, Allstate Personal Lines of AIC (January 2018 to January 2020); Executive Vice President, Claims of AIC (April 2016 to January 2018); Executive Vice President and Chief Claims Officer of Liberty Mutual Commercial Insurance (May 2011 to March 2016). | | 2016 |
Item 1. Business 2020 Form 10-K
Forward-Looking Statements
This report contains “forward-looking statements” that anticipate results based on our estimates, assumptions and plans that are subject to uncertainty. These statements are made subject to the safe-harbor provisions of the Private Securities Litigation Reform Act of 1995. Forward-looking statements do not relate strictly to historical or current facts and may be identified by their use of words like “plans,” “seeks,” “expects,” “will,” “should,” “anticipates,” “estimates,” “intends,” “believes,” “likely,” “targets” and other words with similar meanings. These statements may address, among other things, our strategy for growth, catastrophe exposure management, product development, investment results, regulatory approvals, market position, expenses, financial results, litigation and reserves. We believe that these statements are based on reasonable estimates, assumptions and plans. Forward-looking statements speak only as of the date on which they are made, and we assume no obligation to update any forward-looking statements as a result of new information or future events or developments. In addition, forward-looking statements are subject to certain risks or uncertainties that could cause actual results to differ materially from those communicated in these forward-looking statements. These risks and uncertainties include, but are not limited to, those described in Part 1, “Item 1A. Risk Factors” and elsewhere in this report and those described from time to time in our other reports filed with the Securities and Exchange Commission.
The Allstate Corporation 21
2020 Form 10-K Part I - Item 1A. Risk Factors and Other Disclosures
Item 1A. Risk Factors
Summary Risks are categorized by (1) insurance and financial services, (2) business, strategy and operations and (3) macro, regulatory and risk environment. Many risks may affect more than one category and are included where the impact is most significant. If some of these risk factors occur, they may cause the emergence of or exacerbate the impact of other risk factors, which could materially increase the severity of the impact of these risks on our business, results of operations, financial condition or liquidity. The table below includes examples of risks from each category.
| | | | | | | | | | | | | | | | | | | | | | | |
| Insurance and financial services | | | Business, strategy and operations | | | Macro, regulatory and risk environment |
| Risks that are unique to the insurance and financial services industries | | Risks that are unique to Allstate’s business and operating model | | Risks that impact most companies |
• Claim frequency and severity volatility • Catastrophes and severe weather • Loss cost estimates are complex and losses are unknown at the time policies are sold • Investment results are subject to volatility and valuation judgments | | • Highly competitive industry, impacted by new and changing technologies • Operating model effectiveness in light of changing customer preferences • Ability to maintain catastrophe reinsurance programs and limits • Fluctuations in financial strength and ratings
| | • Adverse changes in economic and capital market conditions • Large-scale pandemic events • Cybersecurity controls and privacy • Changing climate conditions • Regulatory and political changes • Loss of key business relationships • Ability to attract, develop and retain talent
|
Allstate manages these risks through an Enterprise Risk and Return Management framework on an integrated basis following our risk and return principles.
See Management’s Discussion and Analysis (“MD&A”), Enterprise Risk and Return Management for further details. Consider these cautionary statements carefully together with other factors discussed elsewhere in this document, in filings with the Securities and Exchange Commission (“SEC”) or in materials incorporated therein by reference.
| | | | | |
| Insurance and financial services |
Unexpected increases in the frequency or severity of property and casualty claims may adversely affect our results of operations and financial condition
A significant increase in claim frequency could adversely affect our results of operations and financial condition. Changes in mix of business, miles driven, weather, distracted driving or other factors can lead to changes in auto claim frequency. We may experience volatility in claim frequency, and short-term trends may not be predictive of future losses over the longer term.
Increases in claim severity can arise from numerous causes that are inherently difficult to predict. The following factors may impact claim severity for auto bodily injury, property damage and homeowners coverages:
•Bodily injury — inflation in medical costs, litigation trends and precedents and regulation
•Vehicle property damage — inflation in repair costs, including parts and labor rates, mix of total losses declared, costs associated with repairing sophisticated newer vehicles, model year and used-car values
•Homeowners — inflation in the construction industry, building materials and home furnishings, changes in the mix of loss type, and other economic and environmental factors, including
short-term supply imbalances for services and supplies in areas affected by catastrophes
Catastrophes and severe weather events may subject us to significant losses
Catastrophic events could adversely affect operating results and cause them to vary significantly from one period to the next. Also, our liquidity could be constrained by a catastrophe, or multiple catastrophes, which could result in extraordinary losses, sales of investments or a downgrade of our debt or financial strength ratings.
Catastrophic losses are caused by wind and hail, wildfires, tornadoes, hurricanes, tropical storms, earthquakes, volcanic eruptions, terrorism and industrial accidents and other such events.
Our personal property insurance business may incur catastrophe losses greater than:
•Those experienced in prior years
•The average expected level used in pricing
•Current reinsurance coverage limits
•Loss estimates from hurricane and earthquake models at various levels of probability
Property and casualty businesses are subject to claims arising from severe weather events such as winter storms, rain, hail and high winds. The incidence and severity of weather conditions resulting in claims are unpredictable.
The total number of policyholders affected by the event, the severity of the event and the coverage
Part I - Item 1A. Risk Factors and Other Disclosures 2020 Form 10-K
provided contribute to catastrophe and severe weather losses. Increases in the insured values of covered property, geographic concentration and the number of policyholders exposed to certain events could increase the severity of claims from catastrophic and severe weather events.
Limitations in analytical models used to assess and predict the exposure to catastrophe losses may adversely affect our results of operations and financial condition
We use internally developed and third-party vendor models along with our own historical data to assess exposure to catastrophe losses. The models assume various conditions and probability scenarios and may not accurately predict future losses or measure losses currently incurred.
Price competition and changes in underwriting standards in property and casualty businesses may adversely affect our results of operations and financial condition
The personal property-liability market is highly competitive with carriers competing through underwriting, advertising, price, customer service, innovation and distribution. Companies can alter underwriting standards, lower prices and increase advertising, which could result in lower growth or profitability for Allstate. A decline in the growth or profitability of the property and casualty businesses could have a material effect on our results of operations and financial condition.
Property and casualty actual claims costs may exceed current reserves established for claims due to changes in the inflationary, regulatory and litigation environment
•Estimating claim reserves is an inherently uncertain and complex process as losses are unknown at the time policies are sold. We continually refine our best estimates of losses after considering known facts and interpretations of the circumstances.
•Our reserving methodology may be impacted by the following:
•Models that rely on the assumption that past loss development patterns will persist into the future
•Internal factors including experience with similar cases, actual claims paid, historical trends involving claim payment patterns, pending levels of unpaid claims, loss management programs, product mix, contractual terms and changes in claim reporting and settlement practices
•External factors such as inflation, court decisions, changes in law or litigation imposing unintended coverage, regulatory requirements, changes in driving patterns and economic conditions
•The ultimate cost of losses may vary materially from recorded reserves and such variance may adversely affect our results of operations and financial condition as the reserves and amounts due from reinsurers are reestimated.
See MD&A, Application of Critical Accounting Estimates for further details. Our investment portfolios are subject to market risk and declines in quality which may adversely affect or create volatility in our investment income and cause realized and unrealized losses
We continually evaluate investment management strategies since we are subject to risk of loss due to adverse changes in interest rates, credit spreads, equity prices, real estate values, currency exchange rates and liquidity. Adverse changes may occur due to changes in monetary and fiscal policy and the economic climate, liquidity of a market or market segment, investor return expectations or risk tolerance, insolvency or financial distress of key market makers or participants, or changes in market perceptions of credit worthiness. Adverse changes in market conditions could cause the value of our investments to decrease significantly and impact our results of operations and financial condition.
Our investments are subject to risks associated with economic and capital market conditions and factors that may be unique to our portfolio, including:
•General weakening of the economy, which is typically reflected through higher credit spreads and lower equity and real estate valuations
•Declines in credit quality
•Declines in market interest rates, credit spreads or sustained low interest rates could lead to further declines in portfolio yields and investment income
•Increases in market interest rates, credit spreads or a decrease in liquidity could have an adverse effect on the value of our fixed income securities that form a substantial majority of our investment portfolios
•Weak performance of general and joint venture partners and underlying investments unrelated to general market or economic conditions could lead to declines in investment income and cause realized losses in our limited partnership interests
•Concentration in any particular issuer, industry, collateral type, group of related industries, geographic sector or risk type
The amount and timing of net investment income, capital contributions and distributions from our performance-based investments, which primarily include limited partnership interests, can fluctuate significantly due to the underlying investments’ performance or changes in market or economic conditions. Additionally, these investments are less liquid than similar, publicly-traded investments and a decline in market liquidity could impact our ability to sell them at their current carrying values.
Declining equity markets or increases in interest rates or credit spreads could cause the value of the investments in our pension plans to decrease. Declines in interest rates could cause the funding ratio to decline and the value of the obligations for our pension and postretirement plans to increase. These factors could decrease the funded status of our pension and postretirement plans, increasing the likelihood or magnitude of future benefit expense and contributions.
The Allstate Corporation 23
2020 Form 10-K Part I - Item 1A. Risk Factors and Other Disclosures
Determination of the fair value and amount of credit losses for investments includes subjective judgments and could materially impact our results of operations and financial condition
The valuation of the portfolio is subjective, and the value of assets may differ from the actual amount received upon the sale of an asset. The degree of judgment required in determining fair values increases when:
•Market observable information is less readily available
•The use of different valuation assumptions may have a material effect on the assets’ fair values
•Changing market conditions could materially affect the fair value of investments
The determination of the amount of credit losses varies by investment type and is based on ongoing evaluation and assessment of known and inherent risks associated with the respective asset class or investment.
Such evaluations and assessments are highly judgmental and are revised as conditions change and new information becomes available.
We update our evaluations regularly and reflect changes in credit losses in our results of operations. Our conclusions may ultimately prove to be incorrect as assumptions, facts and circumstances change. Historical loss trends, consideration of current conditions, and forecasts may not be indicative of future changes in credit losses and additional amounts may need to be recorded in the future.
Changes in market interest rates or performance-based investment returns may lead to a significant decrease in the profitability of our annuity business
Spread-based products, such as fixed annuities, are dependent upon maintaining profitable spreads between investment returns and interest crediting rates. When market interest rates decrease or remain at low levels, investment income may decline. Lowering interest crediting rates on some products in such an environment can partially offset decreases in investment yield. However, these changes could be limited by regulatory minimum rates or contractual minimum rate guarantees on many contracts and may not match the timing or magnitude of changes in investment yields.
Increases in market interest rates can lead to increased surrenders at a time when fixed income investment asset values are lower due to the increase in interest rates. Liquidating investments to fund surrenders could result in a loss that would adversely impact results of operations.
Performance-based net investment income, capital contributions and distributions can fluctuate significantly due to the underlying investments’ performance or changes in market or economic conditions.
Changes in reserve estimates and amortization of deferred acquisition costs (“DAC”) could materially affect results of operations and financial condition of our life, voluntary benefits and annuity businesses
We use long-term assumptions, including future investment yields, mortality, morbidity, persistency and expenses in pricing and valuation. If experience differs significantly from assumptions, adjustments to reserves and amortization of DAC may be required that could have a material adverse effect on our results of operations and financial condition.
See MD&A, Application of Critical Accounting Estimates and Note 2 of the consolidated financial statements for further details. Our participation in indemnification programs subjects us to the risk that reimbursement for qualifying claims and claims expenses may not be received
Participation in state-based industry pools, facilities and associations as well as the National Flood Insurance Program may have a material, adverse effect on our results of operations and financial condition. Our largest exposure is associated with the Michigan Catastrophic Claim Association (“MCCA”), a state-mandated indemnification mechanism for qualified personal injury protection losses that exceed a specified level. To the extent the MCCA’s current and future assessments are insufficient to reimburse its ultimate obligation on existing claims to member companies, our ability to obtain the 100% indemnification of ultimate loss could be impaired.
For further discussion of these items, see Regulation section, Indemnification Programs and Note 10 of the consolidated financial statements. We may not be able to mitigate the capital impact associated with statutory reserving and capital requirements
Regulatory capital and reserving requirements affect the amount of capital required to be maintained by our subsidiary insurance companies. Changes to capital or reserving requirements or regulatory interpretations may result in additional capital held in our insurance companies and could require us to increase prices, reduce our sales of certain products, or accept a return on equity below original levels assumed in pricing.
A downgrade in financial strength ratings may have an adverse effect on our business
Financial strength ratings are important factors in establishing the competitive position of insurance companies and their access to capital markets. Rating agencies could downgrade or change the outlook on our ratings due to:
•Changes in the financial profile of one of our insurance companies
•Changes in a rating agency’s determination of the amount of capital required to maintain a particular rating
•Increases in the perceived risk of our investment portfolio, a reduced confidence in management or
Part I - Item 1A. Risk Factors and Other Disclosures 2020 Form 10-K
our business strategy, or other considerations that may or may not be under our control
A downgrade in our ratings could have a material effect on our sales, competitiveness, customer retention, the marketability of our product offerings, liquidity, access to and cost of borrowing, results of operations and financial condition.
Changes in tax laws may adversely affect the sales and profitability of life insurance products
Changes in taxation of life insurance products could reduce sales and result in the surrender of some existing contracts and policies, which may have a material effect on our profitability and financial condition.
| | | | | |
| Business, strategy and operations |
We operate in markets that are highly competitive and may be impacted by new or changing technologies
Markets in which we operate are highly competitive, and we must continually allocate resources to refine and improve products and services to remain competitive. If we are unsuccessful in generating new business, retaining customers or renewing contracts, our ability to maintain or increase premiums written or the ability to sell our products could be adversely impacted.
Determining competitive position is complicated in the auto and homeowners insurance business as companies use different underwriting standards to accept new customers and quotes and close rates can fluctuate across companies and locations. Pricing of products is driven by multiple factors, including loss expectations, expense structure and dissimilar return targets. Additionally, sophisticated pricing algorithms make it difficult to determine what price potential customers would pay across competitors.
There is also significant competition for producers, such as exclusive and independent agents and their licensed sales professionals. Growth and retention may be materially affected if we are unable to attract and retain effective producers or if those producers are unable to attract and retain their licensed sales professionals or customers. Similarly, growth and retention may be impacted if customer preferences change and we are unable to effectively adapt our business model and processes.
Our business could also be affected by technological changes, such as autonomous or partially autonomous vehicles or technologies that facilitate ride, car or home sharing. Such changes could disrupt the demand for products from current customers, create coverage issues, impact the frequency or severity of losses, or reduce the size of the automobile insurance market causing our auto insurance business to decline. Since auto insurance constitutes a significant portion of our overall business, we may be more sensitive than other insurers and more adversely affected by trends that could decrease auto insurance rates or reduce demand for auto insurance over time.
Technological advancements and innovation are occurring in distribution, underwriting, claims and operations at a rapid pace that may continue to accelerate. Nontraditional competitors could enter the insurance market and further accelerate these trends. Innovations must be implemented in compliance with applicable insurance regulations and may require extensive modifications to our systems and processes and extensive coordination with and reliance on the systems of third parties. If we are unable to adapt to or bring such advancements and innovations to market, the quality of our products, our relationships with customers and agents, competitive position and business prospects may be materially affected. Changes in technology related to collection and analysis of data regarding customers could expose us to regulatory or legal actions and may have a material adverse effect on our business, reputation, results of operations and financial condition.
Technology and customer preference changes may impact the ways in which we interact, do business with our customers and design our products. We may not be able to respond effectively to these changes, which could have a material effect on our results of operations and financial condition.
Our ability to adequately and effectively price our products and services is affected by the evolving nature of consumer needs and preferences, market and regulatory dynamics, broader use of telematics-based rate segmentation and potential reduction in consumer demand.
Many voluntary benefits contracts are renewed annually. There is a risk that employers may be able to obtain more favorable terms from competitors than they could by renewing coverage with us. These competitive pressures may adversely affect the renewal of these contracts, as well as our ability to sell products.
Transformative Growth may not be effectively implemented
Transformative Growth is intended to accelerate growth by expanding customer access, improving customer value and investing in marketing and technology. The strategy encompasses all aspects of Allstate’s customer experience and business model, spanning product distribution and sales, operations and servicing, and claims processing. If the strategy is not implemented effectively, customer retention and policy growth objectives could be adversely impacted. Lost business opportunities may result due to slower than anticipated speed to market. External forces including competitor actions or regulatory changes may also have an adverse effect on the value generated from the transformation.
Our catastrophe management strategy may adversely affect premium growth
Catastrophe risk management actions have negatively impacted the size of our homeowners business and customer retention, including customers with auto and other personal lines products and may negatively impact future sales if further actions are
The Allstate Corporation 25
2020 Form 10-K Part I - Item 1A. Risk Factors and Other Disclosures
taken. Adjustments to our business structure, size and underwriting practices in markets with significant severe weather and catastrophe risk exposure could adversely impact premium growth rates and retention.
The ability of our subsidiaries to pay dividends may affect our liquidity and ability to meet our obligations
The Allstate Corporation is a holding company with no significant operations. Its principal assets are the stock of its subsidiaries and its directly held cash and investment portfolios. Its liabilities include debt and pension and other postretirement benefit obligations related to Allstate Insurance Company employees. State insurance regulatory authorities limit the payment of dividends by insurance subsidiaries, as described in Note 16 of the consolidated financial statements. The limitations are based on statutory income and surplus. In addition, competitive pressures generally require the subsidiaries to maintain insurance financial strength ratings. These restrictions and other regulatory requirements may affect the ability of subsidiaries to make dividend payments. Limits on the ability of the subsidiaries to pay dividends could adversely affect holding company liquidity, including the ability to pay dividends to shareholders, service debt or complete share repurchase programs as planned.
Changes in regulatory capital requirements could decrease deployable capital and potentially reduce future dividends paid by our insurance companies.
For a discussion of capital requirements, including a potential change to a group capital calculation, see Regulation section, Limitations on Dividends by Insurance Subsidiaries. Our ability to pay dividends or repurchase stock is subject to limitations under terms of certain of our securities
The terms of the outstanding subordinated debentures prohibit us from declaring or paying any dividends or distributions on our common or preferred stock or redeeming, purchasing, acquiring or making liquidation payments on our common stock or preferred stock if we have elected to defer interest payments on the subordinated debentures, subject to certain limited exceptions.
We are prohibited from declaring or paying dividends on our Series G preferred stock if we fail to meet specified capital adequacy, net income or shareholders’ equity levels. The prohibition is subject to an exception permitting us to declare dividends out of the net proceeds of common stock issued by us during the 90 days before the date of declaration even if we fail to meet such levels.
If the full preferred stock dividends for all preceding dividend periods have not been declared and paid, we generally may not repurchase or pay dividends on common stock during any dividend period while our preferred stock is outstanding.
See Note 12 of the consolidated financial statements. Reinsurance may be unavailable at current levels and prices, which may limit our ability to write new business
Market conditions beyond our control impact the availability and cost of the reinsurance we purchase. Reinsurance may not remain continuously available to us to the same extent and on the same terms and rates as is currently available. Our ability to economically justify reinsurance to reduce our catastrophe risk in designated areas may depend on our ability to adjust premium rates to fully or partially recover cost. If we cannot maintain our current level of reinsurance or purchase new reinsurance protection in amounts we consider sufficient at acceptable prices, we would have to either accept an increase in our catastrophe exposure, reduce our insurance exposure or seek other alternatives.
Reinsurance subjects us to counterparty risk and may not be adequate to protect us against losses arising from ceded insurance
Collecting from reinsurers is subject to uncertainty arising from factors that include:
•Whether reinsurers, their affiliates or certain indemnitors have the financial capacity and willingness to make payments under the terms of a reinsurance treaty or contract
•Whether insured losses meet the qualifying conditions of the reinsurance contract
Our inability to recover from a reinsurer could have a material effect on our results of operations and financial condition.
Disruption, volatility or uncertainty in the insurance linked securities market may decrease our ability to access such market on favorable terms or at all.
Acquisitions or divestitures of businesses may not produce anticipated benefits, resulting in operating difficulties, unforeseen liabilities or asset impairments
The ability to achieve certain anticipated financial benefits from the acquisition of National General or other businesses depends in part on our ability to successfully grow and integrate the businesses consistent with our anticipated acquisition economics. Financial results could be adversely affected by unanticipated performance issues, unforeseen liabilities, transaction-related charges, diversion of management time and resources to acquisition integration challenges or growth strategies, loss of key employees, challenges in integrating information technology systems of acquired companies with our own, amortization of expenses related to intangibles, charges for impairment of long-term assets or goodwill and indemnifications.
Acquired businesses may not perform as projected, cost savings anticipated from the acquisition may not materialize, and costs associated with the integration may be greater than anticipated. As a result, if we do not manage these transitions effectively, the quality of our products as well as our relationships with customers and partners may result in the company not achieving returns on its investment at the level projected at acquisition.
Part I - Item 1A. Risk Factors and Other Disclosures 2020 Form 10-K
We also may divest businesses from time to time, including the pending sale of ALIC and certain affiliates. These transactions may result in continued financial involvement in the divested businesses, such as through reinsurance, guarantees or other financial arrangements, following the transaction. If the acquiring companies do not perform under the arrangements, our financial results could be negatively impacted.
We may be subject to the risks and costs associated with intellectual property infringement, misappropriation and third-party claims
We rely on a combination of contractual rights and copyright, trademark, patent and trade secret laws to establish and protect our intellectual property. Third parties may infringe or misappropriate our intellectual property. We may have to litigate to enforce and protect intellectual property and to determine its scope, validity or enforceability, which could divert significant resources and prove unsuccessful. An inability to protect intellectual property or an inability to successfully defend against a claim of intellectual property infringement could have a material effect on our business.
We may be subject to claims by third parties for patent, trademark or copyright infringement or breach of usage rights. Any such claims and any resulting litigation could result in significant expense and liability. If third-party providers or we are found to have infringed a third-party intellectual property right, either of us could be enjoined from providing certain products or services or from utilizing and benefiting from certain methods, processes, copyrights, trademarks, trade secrets or licenses. Alternatively, we could be required to enter into costly licensing arrangements with third parties or implement costly work-arounds. Any of these scenarios could have a material effect on our business and results of operations.
| | | | | |
| Macro, regulatory and risk environment |
Conditions in the global economy and capital markets could adversely affect our business and results of operations
Global economic and capital market conditions could adversely impact demand for our products, returns on our investment portfolio and results of operations. The conditions that would have the largest impact on our business include:
•Low or negative economic growth
•Sustained low interest rates
•Rising inflation increasing claims and claims expense
•Substantial increases in delinquencies or defaults on debt
•Significant downturns in the market value or liquidity of our investment portfolio
•Reduced consumer spending and business investment
Stressed conditions, volatility and disruptions in global capital markets or financial asset classes could adversely affect our investment portfolio.
Adverse capital and credit market conditions may significantly affect our ability to meet liquidity needs or obtain credit on acceptable terms
In periods of extreme volatility and disruption in the capital and credit markets, liquidity and credit capacity may be severely restricted. Our access to additional financing depends on a variety of factors such as market conditions, the general availability of credit, the overall availability of credit to our industry, our credit ratings and credit capacity, as well as lenders’ perception of our long- or short-term financial prospects. In such circumstances, our ability to obtain capital to fund operating expenses, financing costs, capital expenditures or acquisitions may be limited, and the cost of any such capital may be significant.
A large-scale pandemic, the occurrence of terrorism, military actions, social unrest or other actions may have an adverse effect on our business
A large-scale pandemic, such as the Coronavirus and its impacts, the occurrence of terrorism, military actions, social unrest or other actions, may result in loss of life, property damage, and disruptions to commerce and reduced economic activity. Some of the assets in our investment portfolio may be adversely affected by declines in the equity markets, changes in interest rates, reduced liquidity and economic activity caused by a large-scale pandemic. Additionally, a large-scale pandemic or terrorist act could have a material effect on sales, liquidity and operating results.
The Coronavirus resulted in governments worldwide enacting emergency measures to combat the spread of the virus. These measures, which have included the implementation of travel restrictions, government-imposed shelter-in-place orders, quarantine periods, social distancing, and restrictions on large gatherings, have caused material disruption to businesses globally, resulting in increased unemployment, a recession and increased economic uncertainty. Additionally, there is no way of predicting with certainty how long the pandemic might last, including the potential for restrictions being restored or new restrictions being implemented that could result in further economic volatility.
The Coronavirus has affected our operations and depending on its length and severity may continue to significantly affect our results of operations, financial condition and liquidity, including:
•Sales of new and retention of existing policies
•Shared economy demand
•Claim severity costs, driving behavior and auto accident frequency
•Life insurance mortality, hospital and outpatient claim costs and annuity reserves
•Investment valuations and returns
•Bad debt and credit allowance exposure
The Allstate Corporation 27
2020 Form 10-K Part I - Item 1A. Risk Factors and Other Disclosures
See MD&A, Highlights for a summary of the impacts of the Coronavirus on our operations, each of our segments and investments that may continue, emerge, evolve or accelerate into 2021. The failure in cyber or other information security controls, as well as the occurrence of events unanticipated in our disaster recovery processes and business continuity planning, could result in a loss or disclosure of confidential information, damage to our reputation, additional costs and impair our ability to conduct business effectively
We depend heavily on computer systems, mathematical algorithms and data to perform necessary business functions. There are threats that could impact our ability to protect our data and systems; if the threats are successful, they could impact confidentiality, integrity and availability:
•Confidentiality — protecting our data from disclosure to unauthorized parties
•Integrity — ensuring data is not changed accidentally or without authorization and is accurate
•Availability — ensuring our data and systems are accessible to meet our business needs
We collect, use, store or transmit a large amount of confidential, proprietary and other information (including personal information of customers, claimants or employees) in connection with the operation of our business. Systems are subject to increased attempted cyberattacks and unauthorized access, such as physical and electronic break-ins or unauthorized tampering.
We constantly defend against threats to our data and systems, including malware and computer virus attacks, unauthorized access, system failures and disruptions. Events like these could jeopardize the information processed and stored in, and transmitted through, our computer systems and networks, or otherwise cause interruptions or malfunctions in our operations, which could result in damage to our reputation, financial losses, litigation, increased costs, regulatory penalties or customer dissatisfaction.
These risks may increase in the future as threats become more sophisticated and we continue to expand internet and mobile strategies, develop additional remote connectivity solutions to serve our employees and customers, develop and expand products and services designed to protect customers’ digital footprint, and build and maintain an integrated digital enterprise.
Our increased use of third-party services (e.g., cloud technology and software as a service) can make it more difficult to identify and respond to cyberattacks in any of the above situations. Although we may review and assess third-party vendor cyber security controls, our efforts may not be successful in preventing or mitigating the effects of such events. Third parties to whom we outsource certain functions are also subject to cybersecurity risks.
Personal information is subject to an increasing number of federal, state, local and international laws and regulations regarding privacy and data security, as well as contractual commitments. Any failure or perceived failure by us to comply with such obligations may result in governmental enforcement actions and fines, litigation or public statements against us by consumer advocacy groups or others and could cause our employees and customers to lose trust in us, which could have an adverse effect on our reputation and business.
See the Regulation section, Privacy Regulation and Data Security, for additional information. The occurrence of a disaster, such as a natural catastrophe, pandemic, industrial accident, blackout, terrorist attack, war, cyberattack, computer virus, insider threat, unanticipated problems with our disaster recovery processes, or a support failure from external providers, could have an adverse effect on our ability to conduct business and on our results of operations and financial condition, particularly if those events affect our computer-based data processing, transmission, storage, and retrieval systems or destroy data. If a significant number of employees were unavailable in the event of a disaster, our ability to effectively conduct business could be severely compromised. Our systems are also subject to compromise from internal threats.
Losses from changing climate and weather conditions may adversely affect our financial condition, profitability or cash flows
Climate change may affect the occurrence of certain natural events, such as an increase in the frequency or severity of wind, tornado, hailstorm and thunderstorm events due to increased convection in the atmosphere. There could also be more frequent wildfires in certain geographies, more flooding and the potential for increased severity of hurricanes due to higher sea surface temperatures. As a result, incurred losses from such events and the demand, price and availability of reinsurance coverages for automobile and homeowners insurance may be affected.
Climate change may also impact insurability by impairing our ability to identify and quantify potential hazards that will result in losses and offer our customers products at an affordable price. Our investment portfolio is also subject to the effects of climate change as economic shifts alter the return dynamic of long-term investments and reduce valuations.
Due to significant variability associated with future changing climate conditions, we are unable to predict the impact climate change will have on our businesses.
We are subject to extensive regulation, and potential further restrictive regulation may increase operating costs and limit growth
Many of our affiliates operate in the highly regulated insurance and broader financial services sector and are subject to extensive laws and regulations that are complex and subject to change.
Part I - Item 1A. Risk Factors and Other Disclosures 2020 Form 10-K
Changes may lead to additional expenses, increased legal exposure, or increased reserve or capital requirements limiting our ability to grow or to achieve targeted profitability. Moreover, laws and regulations are administered and enforced by governmental authorities that exercise interpretive latitude, including:
•State insurance regulators
•State securities administrators
•State attorneys general
•Federal agencies including the SEC, the Financial Industry Regulatory Authority, the Department of Labor, the U.S. Department of Justice and the National Labor Relations Board
Consequently, compliance with one regulator’s or enforcement authority’s interpretation of a legal issue may not result in compliance with another’s interpretation of the same issue.
In addition, there is risk that one regulator’s or enforcement authority’s interpretation of a legal issue may change to our detriment. There is also a risk that changes in the overall legal environment may cause us to change our views regarding the actions we need to take from a legal risk management perspective. This could necessitate changes to our practices that may adversely impact our business. In some cases, state insurance laws and regulations are generally intended to protect or benefit purchasers or users of insurance products, not holders of securities that we issue. These laws and regulations may limit our ability to grow or to improve the profitability of our business.
A regulatory environment that requires rate increases to be approved, can dictate underwriting practices and mandate participation in loss sharing arrangements may adversely affect results of operations and financial condition
Political events and positions can affect the insurance market, including efforts to suppress rates to a level that may not allow us to reach targeted levels of profitability. Regulatory challenges to rate increases may restrict rate changes that may be required to achieve targeted levels of profitability and returns on equity. If we are unsuccessful, our results of operations could be negatively impacted.
In addition, certain states have enacted laws that require an insurer conducting business in that state to participate in assigned risk plans, reinsurance facilities and joint underwriting associations. Certain states also require the insurer to offer coverage to all consumers, often restricting an insurer’s ability to charge the price it might otherwise charge for the risk acceptance. In these markets, we may be compelled to underwrite significant amounts of business at lower-than-desired rates, possibly leading to an unacceptable return on equity. Alternatively, as the facilities recognize a financial deficit, they could have the ability to assess participating insurers, adversely affecting our results of operations and financial condition. Laws and regulations of many states also limit an insurer’s ability to withdraw from one or more lines of insurance, except pursuant to a plan that is approved by the state
insurance department. Certain states require an insurer to participate in guaranty funds for impaired or insolvent insurance companies. These funds periodically assess losses against all insurance companies doing business in the state. Our results of operations and financial condition could be adversely affected by any of these factors.
Regulatory reforms, and the more stringent application of existing regulations, may make it more expensive for us to conduct our business
The federal government has enacted comprehensive regulatory reforms for financial services entities. As part of a larger effort to strengthen the regulation of the financial services market, certain reforms are applicable to the insurance industry.
The Federal Insurance Office (“FIO”) and Financial Stability Oversight Council have been established, and the federal government may enact reforms that affect the state insurance regulatory framework. The potential impact of state or federal measures that change the nature or scope of insurance and financial regulation is uncertain but may make it more expensive for us to conduct business and limit our ability to grow or achieve profitability.
We have business process and information technology operations in Canada, India and the United Kingdom that are subject to operating, regulatory and political risks in those countries. We may incur substantial costs and other negative consequences if any of these occur, including an adverse effect on our business, results of operations and financial condition.
Losses from legal and regulatory actions may be material to our results of operations, cash flows and financial condition
We are involved in various legal actions, including class-action litigation challenging a range of company practices and coverage provided by our insurance products, some of which involve claims for substantial or indeterminate amounts. We are also involved in various regulatory actions and inquiries, including market conduct exams by state insurance regulatory agencies. In the event of an unfavorable outcome in any of these matters, the ultimate liability may be more than amounts currently accrued or disclosed in our reasonably possible loss range and may be material to our results of operations, cash flows and financial condition.
See Note 14 of the consolidated financial statements. Changes in or the application of accounting standards issued by standard-setting bodies and changes in tax laws may adversely affect our results of operations and financial condition
Our financial statements are subject to the application of accounting principles generally accepted in the United States of America, which are periodically revised, interpreted or expanded. Accordingly, we may be required to adopt new guidance or interpretations, which may have a material effect on our results of
The Allstate Corporation 29
2020 Form 10-K Part I - Item 1A. Risk Factors and Other Disclosures
operations and financial condition and could adversely impact financial strength ratings.
•Market declines, changes in business strategies or other events impacting the fair value of goodwill or purchased intangible assets could result in an impairment charge to income
•Pending changes to accounting for long-duration insurance contracts such as traditional life, life-contingent immediate annuities and certain voluntary accident and health insurance products will have a material effect on reserves and shareholders’ equity and could adversely impact financial strength ratings
•Realization of our deferred tax assets assumes that we can fully utilize the deductions recognized for tax purposes; we may recognize additional tax expense if these assets are not fully utilized
•New tax legislative initiatives may be enacted that may impact our effective tax rate and could adversely affect our tax positions or tax liabilities
See MD&A, Application of Critical Accounting Estimates and Note 2 of the consolidated financial statements for further details. Loss of key vendor relationships or failure of a vendor to protect our data, confidential and proprietary information, or personal information of our customers, claimants or employees could adversely affect our operations
We rely on services and products provided by many vendors in the U.S. and abroad. These include vendors of computer hardware, software, cloud technology and software as a service, as well as vendors or outsourcing of services such as:
•Claim adjustment or call center services
•Human resource benefits management
•Information technology support
•Investment management services
If any vendor becomes unable to continue to provide products or services, or fails to protect our confidential, proprietary, and other information, we may suffer operational impairments and financial losses.
Our ability to attract, develop, and retain talent to maintain appropriate staffing levels and establish a successful work culture is critical to our success
Competition from within the insurance industry and from other industries, including the technology sector, for qualified employees with highly specialized knowledge in areas such as underwriting, data and analytics, technology and e-commerce, has often been intense and we have experienced increased competition in hiring and retaining employees.
Factors that affect our ability to attract and retain such employees include:
•Compensation and benefits
•Training and re-skilling programs
•Reputation as a successful business with a culture
of fair hiring, and of training and promoting qualified employees
•Recognition of and response to changing trends and other circumstances that affect employees
The unexpected loss of key personnel could have a material adverse impact on our business because of the loss of their skills, knowledge of our products and offerings and years of industry experience and, in some cases, the difficulty of promptly finding qualified replacement personnel.
Misconduct or fraudulent acts by employees, agents and third parties may expose us to financial loss, disruption of business, regulatory assessments and reputational harm
The company and the insurance industry are inherently susceptible to past and future misconduct or fraudulent activities by employees, representative agents, vendors, customers and other third parties. These activities could include:
•Fraud against the company, its employees and its customers through illegal or prohibited activities
•Unauthorized acts or representations, unauthorized use or disclosure of personal or proprietary information, deception, and misappropriation of funds or other benefits
Item 1B. Unresolved Staff Comments
None.
Item 2. Properties
Our home office complex is owned and located in Northbrook, Illinois. As of December 31, 2020, the home office complex consists of several buildings totaling 1.9 million square feet of office space on a 186-acre site.
We also operate from approximately 415 administrative, data processing, claims handling and other support facilities in North America. In addition to our home office facilities, 825 thousand square feet are owned and 5.8 million square feet are leased.
Outside North America, we own one and lease three properties in Northern Ireland comprising approximately 223 thousand square feet. We also have three leased facilities in India for approximately 600 thousand square feet and two leased facilities in London for 7,182 square feet.
The locations where Allstate exclusive agencies operate in the U.S. are normally leased by the agencies.
Item 3. Legal Proceedings
Information required for Item 3 is incorporated by reference to the discussion under the heading “Regulation and compliance” and under the heading “Legal and regulatory proceedings and inquiries” in Note 14 of the consolidated financial statements.
Item 4. Mine Safety Disclosures
Not applicable.
Part II
Item 5. Market for Registrant’s Common Equity, Related Stockholder Matters and Issuer Purchases of Equity Securities
As of January 29, 2021, there were 64,567 holders of record of The Allstate Corporation’s common stock. The principal market for the common stock is the New York Stock Exchange, where our common stock trades under the trading symbol “ALL”. Our common stock is also listed on the Chicago Stock Exchange.
Common stock performance graph
The following performance graph compares the cumulative total shareholder return on Allstate common stock for a five-year period (December 31, 2015 to December 31, 2020) with the cumulative total return of the S&P Property and Casualty Insurance Index (S&P P/C) and the S&P’s 500 stock index.
| | | | | | | | | | | | | | | | | | | | | | | | | | | | | | | | | | | | | | |
Value at each year-end of $100 initial investment made on December 31, 2015 |
| | 12/31/2015 | | 12/31/2016 | | 12/31/2017 | | 12/31/2018 | | 12/31/2019 | | 12/31/2020 |
| Allstate | | $ | 100.00 | | | $ | 121.71 | | | $ | 174.80 | | | $ | 140.67 | | | $ | 195.28 | | | $ | 195.05 | |
| S&P P/C | | $ | 100.00 | | | $ | 115.71 | | | $ | 141.61 | | | $ | 134.96 | | | $ | 169.88 | | | $ | 180.63 | |
| S&P 500 | | $ | 100.00 | | | $ | 111.95 | | | $ | 136.38 | | | $ | 130.39 | | | $ | 171.44 | | | $ | 202.96 | |
The Allstate Corporation 31
Issuer Purchases of Equity Securities
| | | | | | | | | | | | | | | | | | | | | | | | | | |
| Period | | Total number of shares (or units) purchased (1) | | Average price paid per share (or unit) | | Total number of shares (or units) purchased as part of publicly announced plans or programs | | Maximum number (or approximate dollar value) of shares (or units) that may yet be purchased under the plans or programs (3) |
| October 1, 2020 - October 31, 2020 | | | | | | | | |
| Open Market Purchases | | 288 | | | $ | 93.02 | | | — | | | |
| November 1, 2020 - November 30, 2020 | | | | | | | | |
| Open Market Purchases | | 703 | | | $ | 90.90 | | | — | | | |
| | | | | | | | |
| December 1, 2020 - December 31, 2020 | | | | | | | | |
| Open Market Purchases | | 162 | | | $ | 104.36 | | | — | | | |
Total (2) | | 1,153 | | | $ | 93.32 | | | — | | | $ | 1.56 | billion |
(1)In accordance with the terms of its equity compensation plans, Allstate acquired the following shares in connection with the vesting of restricted stock units and performance stock awards and the exercise of stock options held by employees or directors. The shares were acquired in satisfaction of withholding taxes due upon exercise or vesting and in payment of the exercise price of the options.
October: 288
November: 703
December: 162
(2)On September 18, 2020, Allstate entered into an accelerated share repurchase agreement (“ASR agreement”) with Goldman Sachs & Co. LLC (“Goldman Sachs”), to purchase $750 million of our outstanding shares of common stock. In exchange for an upfront payment of $750 million, Goldman Sachs initially delivered 7.0 million shares to Allstate. The ASR agreement settled on January 12, 2021, and we repurchased a total of 7.8 million shares at an average price of $96.21.
(3)In February 2020, we announced the approval of a common share repurchase program for $3 billion that is expected to be completed by the end of 2021.
Item 6.
None.
Item 7. Management’s Discussion and Analysis of Financial Condition and Results of Operations
| | | | | | | | | | | |
| | Page |
| | | |
| | |
| | | |
| | |
| | | |
| | |
| – Allstate brand | | |
| | | |
| – Encompass brand | | |
| | |
| | | |
Protection Services (previously Service Businesses) | | |
| Claims and Claims Expense Reserves | | |
| Allstate Life | | |
| Allstate Benefits | | |
| Allstate Annuities | | |
| | | |
| | |
| | |
| | |
| | |
| | | |
| | |
| | |
| Application of Critical Accounting Estimates | | |
| | |
| | |
The Allstate Corporation 33
2020 Highlights
Overview
The following discussion highlights significant factors influencing the consolidated financial position and results of operations of The Allstate Corporation (referred to in this document as “we,” “our,” “us,” the “Company” or “Allstate”). It should be read in conjunction with the consolidated financial statements and related notes found under Item 8. contained herein.
A discussion of strategy, including updates to the multi-year Transformative Growth initiative, can be found in Part 1, Item 1. Business.
This section of this Form 10-K generally discusses 2020 and 2019 results and year-to-year comparisons between 2020 and 2019. Discussions of 2018 results and year-to-year comparisons between 2019 and 2018 that are not included in this Form 10-K can be found in Management’s Discussion and Analysis (“MD&A”) in Part II, Item 7 of our annual report on Form 10-K for 2019, filed February 21, 2020.
The most important factors we monitor to evaluate the financial condition and performance for our reportable segments and the Company include:
•Allstate Protection: premium, policies in force (“PIF”), new business sales, policy retention, price changes, claim frequency and severity, catastrophes, loss ratio, expenses, underwriting results, and relative competitive position.
•Protection Services: revenues, premium written, PIF, adjusted net income and net income.
•Allstate Life: premiums and contract charges, new business sales, PIF, benefit spread, investment spread, expenses, adjusted net income and net income.
•Allstate Benefits: premiums, new business sales, PIF, benefit ratio, expenses, adjusted net income and net income.
•Allstate Annuities: investment spread, asset-liability matching, contract benefits, expenses, adjusted net income, net income and invested assets.
•Investments: exposure to market risk, asset allocation, credit quality/experience, total return, net investment income, cash flows, realized capital gains and losses, unrealized capital gains and losses, long-term returns, and asset and liability duration.
•Financial condition: liquidity, parent holding company deployable assets, financial strength ratings, operating leverage, debt levels, book value per share and return on equity.
Measuring segment profit or loss
The measure of segment profit or loss used in evaluating performance is underwriting income for the Allstate Protection and Discontinued Lines and Coverages segments and adjusted net income for the Protection Services, Allstate Life, Allstate Benefits, Allstate Annuities, and Corporate and Other segments.
Underwriting income is calculated as premiums earned and other revenue, less claims and claims expense (“losses”), Shelter-in-Place Payback expense, amortization of deferred policy acquisition costs (“DAC”), operating costs and expenses, restructuring and related charges and amortization or impairment of purchased intangibles, as determined using accounting principles generally accepted in the United States of America (“GAAP”). We use this measure in our evaluation of results of operations to analyze the profitability of the Property-Liability insurance operations separately from investment results. Underwriting income is reconciled to net income applicable to common shareholders in the Property-Liability Operations section of MD&A.
Adjusted net income is net income applicable to common shareholders, excluding:
| | |
• Realized capital gains and losses, after-tax, except for periodic settlements and accruals on non-hedge derivative instruments, which are reported with realized capital gains and losses but included in adjusted net income |
• Pension and other postretirement remeasurement gains and losses, after-tax |
• Valuation changes on embedded derivatives that are not hedged, after-tax |
• Amortization of DAC and deferred sales inducement costs (“DSI”), to the extent they resulted from the recognition of certain realized capital gains and losses or valuation changes on embedded derivatives that are not hedged, after-tax |
• Business combination expenses and the amortization or impairment of purchased intangible assets, after-tax |
• Gain (loss) on disposition of operations, after-tax |
• Adjustments for other significant non-recurring, infrequent or unusual items, when (a) the nature of the charge or gain is such that it is reasonably unlikely to recur within two years, or (b) there has been no similar charge or gain within the prior two years |
Adjusted net income is reconciled to net income applicable to common shareholders in the Protection Services, Allstate Life, Allstate Benefits and Allstate Annuities Segment sections of MD&A.
Subsequent event
On January 26, 2021, Allstate announced an agreement to sell Allstate Life Insurance Company (“ALIC”) and certain affiliates for $2.8 billion to Antelope US Holdings Company, an affiliate of an investment fund associated with The Blackstone Group Inc. Allstate will retain ownership of Allstate Life Insurance Company of New York (“ALNY”) while pursuing alternatives to sell or otherwise transfer risk to a third party. ALIC and certain affiliates represent approximately 80% of Allstate Life and Allstate Annuity reserves for life-contingent contract benefits and contractholder funds as of December 31, 2020 and generated net income of approximately $290 million and $470 million in 2020 and 2019, respectively. A loss on disposition estimated at $3 billion, after-tax, will be recorded in the first quarter of 2021. The ultimate amount of the loss on sale will be impacted by purchase price adjustments associated with certain pre-close transactions specified in the stock purchase agreement, changes in statutory capital and surplus prior to the closing date and the closing date equity of ALIC determined under GAAP, excluding unrealized gains and losses. The transaction is expected to close in the second half of 2021, subject to regulatory approvals and other customary closing conditions. Additional information about this transaction can be found in Allstate Life and Allstate Annuities sections of Part 1, Item 1. Business, MD&A and Note 3 of the consolidated financial statements of this report.
The Novel Coronavirus Pandemic or COVID-19 (“Coronavirus”)
The Coronavirus resulted in governments worldwide enacting emergency measures to combat the spread of the virus. These measures, which have included the implementation of travel restrictions, government-imposed shelter-in-place orders, quarantine periods, social distancing, and restrictions on large gatherings, have caused material disruption to businesses globally, resulting in increased unemployment, a recession and increased economic uncertainty. Additionally, there is no way of predicting with certainty how long the pandemic might last, including the potential for restrictions being restored or new restrictions being implemented that could result in further economic volatility.
We have been proactive in protecting the health and safety of our employees and agents, while delivering on our commitment to protect our customers. We executed business continuity plans, maximized work from home, including the use of virtual tools to allow for safe claims handling, provided financial relief to employees experiencing financial hardship, developed exposure escalation protocols and a return to office framework.
A pandemic such as the Coronavirus and its impacts are disclosed in Part 1 “Item 1A. Risk Factors’’, including the risk factors titled “A large-scale pandemic, the occurrence of terrorism, military actions, social unrest or other actions may have an adverse effect on our business” and “Conditions in the global economy and capital markets could adversely affect our business and results of operations”.
The magnitude and duration of the global pandemic and the impact of actions taken by governmental authorities, businesses and consumers, including timing of vaccine distribution, to mitigate health risks create significant uncertainty. We will continue to closely monitor and proactively adapt to developments and changing conditions. Currently, it is not possible to reliably estimate the length and severity of the pandemic or its impact to our operations, but the effects could be material.
We have continued to support our customers during the Coronavirus pandemic as we:
•Provided our Shelter-in-Place Payback of over $948 million to customers in 2020, as the significant decline in the number of auto accidents contributed favorably to our underwriting results
•Offered the Allstate Special Payment plan to provide more flexible payment options, including the option to delay payments
•Extended auto insurance coverage to customers using their personal vehicles to deliver food, medicine and other goods for commercial purposes; coverage for these activities is typically excluded
•Continued to provide prompt payments for life insurance and health claims related to Coronavirus
•Offered free Allstate Identity Protection to U.S. residents through December 31, 2020, regardless of whether they were already Allstate customers
•Increased the utilization of virtual tools such as QuickFoto Claim® and Virtual Assist® to allow for a simple, fast and safe claims handling process for customers and our employees
The following sections summarize the potential impacts of the Coronavirus on our operations, each of our segments and investments that may continue, emerge, evolve or accelerate in 2021. This list is not inclusive of all potential impacts and should not be treated as such. Within the MD&A we have included further disclosures related to the impacts of the Coronavirus on our 2020 results.
The Allstate Corporation 35
Allstate’s operations
•Employee availability and productivity
•Increased regulatory restrictions on profitability, rate actions or claim practices, potentially outside the scope of current policies
•Availability and performance of third party vendors, including technology development, car or home repair and marketing programs
•Cybersecurity risks related to remote workforce
Allstate Protection
•Slower written premiums growth and declines in auto new issued applications due to lower car sales
•Impact to future rate filings and pricing
•Lower auto accident frequency from reduced miles driven, including usage in shared economy products
•Expanding the availability of our pay-per-mile insurance product, Milewise®
•Increased auto claim severity due to more severe accidents or replacement parts cost variability
•Increased exposure to allowances for uncollectible receivables
•Validity of statistical models given changes in underlying statistics such as auto frequency or investment projections
•Agent availability and productivity
Protection Services
•Increased consumer spending and retail sales in Allstate Protection Plans resulting from shelter-in-place orders
•Reduced demand for Allstate Dealer Services products due to lower new and used car sales
•Decline in claims in Allstate Dealer Services and Allstate Roadside due to lower miles driven
•Decreased sales of Allstate Identity Protection products due to higher unemployment
•Increased costs from Allstate Identity Protection providing free identity protection to consumers through the end of 2020
Allstate Life
•Higher death benefit costs
•Decline in sales due to temporary underwriting restrictions placed on new business; agents are able to offer coverage to customers outside the new guidelines through non-proprietary carriers
•Statutory reserving requirements could be increased due to low interest rates, which could affect the amount of capital required to be maintained by our insurance companies
Allstate Benefits
•Decreased accident injury claims and deferral of non-essential medical procedures, reducing accident, hospital and critical illness product exposure, partially offset by increased claim cost exposure for our life products
•Decreased sales and increased policy lapses due to higher employee turnover, business closures and employee layoffs and furloughs
Allstate Annuities
•Lower performance-based investment income
•Higher reserves released on death of the insured for life-contingent immediate annuities, which lowers contract benefits
•Statutory reserving requirements could be increased due to low interest rates, which could affect the amount of capital required to be maintained by our insurance companies
Investments
•Impact on the market values, liquidity and valuations of fixed income securities, equity securities and performance-based investments as well as changes in the expected pace of funding performance-based and loan commitments
•Negative impact on fixed income securities in certain sectors such as energy, automotive, retail, travel, lodging and airlines
•State and local government budgets may be strained by the costs of responding to the Coronavirus and reduced tax revenues from lower economic activity which may have an adverse impact on valuations and returns of our municipal bond portfolio
•Volatility in future investment results due to capital market conditions, including the pace of economic recovery, effectiveness of the fiscal and monetary policy responses and uncertainty resulting from the ongoing pandemic
•Volatility in expected credit losses
| | | | | | | | | | | | | | | | | |
Allstate Delivered on 2020 Operating Priorities (1) |
| | | | | |
| Better Serve Customers | | Allstate acted quickly and led the industry in taking care of customers during the pandemic by providing two Shelter-In-Place Paybacks, financial flexibility through Special Payment Plans and offering free identity protection in 2020 |
| Enterprise Net Promoter Score, which measures how likely customers are to recommend us, increased to 59.0 in 2020 compared to 58.6 in 2019 |
| Grow Customer Base | | Consolidated policies in force reached 175.9 million, a 20.5% increase from prior year |
| Property-Liability policies in force were down slightly compared to the prior year as Allstate brand growth was more than offset by a decline in the Encompass brand. Protection Services policies in force grew to 136.3 million, a 28.6% increase to the prior year, driven by continued rapid expansion in Allstate Protection Plans |
| Achieve Target Returns on Capital | | Strong results in Property-Liability insurance with a combined ratio of 87.6 |
| 21.0% return on average common shareholders’ equity in 2020 |
| Proactively Manage Investments | | Total return on the $94.24 billion investment portfolio was 7.1% in 2020 |
| Net investment income of $2.85 billion in 2020 was 9.7% below prior year reflecting lower reinvestment rates and reduced performance-based income |
| |
| Build Long-Term Growth Platforms | | Allstate made substantial progress in building higher growth business models to increase personal property-liability market share under the Allstate brand |
| |
| |
| Allstate Protection Plans expanded its total addressable market through new accounts addressing furniture, appliances and international markets |
(1)2021 operating priorities will remain consistent with the 2020 priorities.
| | | | | | | | | | | | | | |
| Consolidated Net Income |
| ($ in millions) |
|
| | |
Consolidated net income applicable to common shareholders increased 16.7% or $783 million to $5.46 billion in 2020 compared to 2019, primarily due to higher Allstate Protection underwriting income and higher Protection Services adjusted net income, partially offset by Shelter-in-Place Payback expense, lower net realized capital gains and lower net investment income. For the twelve months ended December 31, 2020, return on common shareholders’ equity was 21.0% compared to 21.7% for the twelve months ended December 31, 2019. |
|
| | | | | | | | | | | | | | |
| Total Revenue |
| ($ in millions) |
| | |
Total revenue increased 0.3% to $44.79 billion in 2020 compared to 2019, driven by a 2.8% increase in property and casualty insurance premiums earned, partially offset by lower realized capital gains and lower net investment income. Insurance premiums increased in Allstate brand and Protection Services (Allstate Protection Plans and Allstate Dealer Services). |
| | | | | | | | | | | | | | |
| Net Investment Income |
| ($ in millions) |
| | |
Net investment income decreased 9.7% to $2.85 billion in 2020 compared to 2019, primarily due to a decline in market-based income driven by lower interest-bearing portfolio yields and lower performance-based results, primarily from limited partnerships. |
The Allstate Corporation 37
Summarized financial results
| | | | | | | | | | | | | | | | | | | | |
| | Years Ended December 31, |
| ($ in millions) | | 2020 | | 2019 | | 2018 |
| Revenues | | | | | | |
| Property and casualty insurance premiums | | $ | 37,073 | | | $ | 36,076 | | | $ | 34,048 | |
| Life premiums and contract charges | | 2,444 | | | 2,501 | | | 2,465 | |
| Other revenue | | 1,065 | | | 1,054 | | | 939 | |
| Net investment income | | 2,853 | | | 3,159 | | | 3,240 | |
| Realized capital gains (losses) | | 1,356 | | | 1,885 | | | (877) | |
| Total revenues | | 44,791 | | | 44,675 | | | 39,815 | |
| | | | | | |
| Costs and expenses | | | | | | |
| Property and casualty insurance claims and claims expense | | (22,001) | | | (23,976) | | | (22,778) | |
| Shelter-in-Place Payback expense | | (948) | | | — | | | — | |
| Life contract benefits and interest credited to contractholder funds | | (2,881) | | | (2,679) | | | (2,627) | |
| Amortization of deferred policy acquisition costs | | (5,630) | | | (5,533) | | | (5,222) | |
| Operating, restructuring and interest expenses | | (6,309) | | | (6,058) | | | (5,993) | |
Pension and other postretirement remeasurement gains (losses) | | 51 | | | (114) | | | (468) | |
| Amortization of purchased intangibles | | (118) | | | (126) | | | (105) | |
| Impairment of purchased intangibles | | — | | | (106) | | | — | |
| Total costs and expenses | | (37,836) | | | (38,592) | | | (37,193) | |
| | | | | | |
| Gain on disposition of operations | | 4 | | | 6 | | | 6 | |
| Income tax expense | | (1,383) | | | (1,242) | | | (468) | |
Net income | | 5,576 | | | 4,847 | | | 2,160 | |
| | | | | | |
| Preferred stock dividends | | (115) | | | (169) | | | (148) | |
Net income applicable to common shareholders | | $ | 5,461 | | | $ | 4,678 | | | $ | 2,012 | |
Segment Highlights
Allstate Protection underwriting income totaled $4.57 billion in 2020, a 56.8% increase from $2.91 billion in 2019, primarily due to lower auto non-catastrophe losses, increased premiums earned and favorable catastrophe reserve reestimates in personal lines homeowners driven by subrogation settlements, partially offset by Shelter-in-Place Payback expense and higher catastrophe losses.
Catastrophe losses were $2.81 billion in 2020 compared $2.56 billion in 2019.
Subrogation settlements Allstate recognized favorable prior year catastrophe reserve reestimates of approximately $450 million and $45 million, pre-tax, net of expenses and adjustments to reinsurance, in the third quarter of 2020 related to PG&E Corporation and Southern California Edison (together “subrogation settlements”), respectively. See Note 8 of the consolidated financial statements for additional details.
Premiums written increased 1.0% to $35.77 billion in 2020 compared to 2019.
Protection Services adjusted net income was $153 million in 2020 compared to $38 million in 2019. The improvement in 2020 was primarily due to growth of Allstate Protection Plans and improved profitability at Allstate Roadside, partially offset by investments at Allstate Identity Protection.
Total revenues increased 16.6% or $273 million to $1.92 billion in 2020 from $1.65 billion in 2019 due to Allstate Protection Plan’s growth through its U.S. retail and international channels, partially offset by declines in revenue at Allstate Roadside.
Allstate Life adjusted net income was $194 million in 2020 compared to $261 million in 2019. The decrease was primarily due to higher contract benefits due to mortality associated with the Coronavirus, partially offset by lower operating costs and expenses.
Premiums and contract charges totaled $1.34 billion in both 2020 and 2019.
Allstate Benefits adjusted net income was $96 million in 2020 compared to $115 million in 2019. The decrease was primarily due to lower premiums and higher operating costs and expenses driven by a $41 million, pre-tax, write-off of capitalized software costs associated with a billing system in the second quarter of 2020, partially offset by lower contract benefits.
Premiums and contract charges totaled $1.09 billion in 2020, a decrease of 4.5% from $1.15 billion in 2019.
Allstate Annuities adjusted net loss was $53 million in 2020 compared to adjusted net income of $10 million in 2019, primarily due to lower net investment income, partially offset by lower contract benefits.
Net investment income decreased 17.0% to $761 million in 2020 from $917 million in 2019. The decrease was primarily due to a decline in market-based income driven by lower interest-bearing portfolio yields as well as lower performance-based investment results and lower average investment balances.
Financial Highlights
Investments totaled $94.24 billion as of December 31, 2020, increasing from $88.36 billion as of December 31, 2019.
Shareholders’ equity As of December 31, 2020, shareholders’ equity was $30.22 billion. This total included $5.52 billion in deployable assets at the parent holding company level and approximately $4 billion were used to fund the purchase of National General, which closed on January 4, 2021. Deployable assets include $1.2 billion of proceeds from a debt issuance in November 2020 and comprise cash and investments that are generally saleable within one quarter.
Book value per diluted common share (ratio of common shareholders’ equity to total common shares outstanding and dilutive potential common shares outstanding) was $91.50 as of December 31, 2020, an increase of 25.1% from $73.12 as of December 31, 2019.
Return on average common shareholders’ equity For the twelve months ended December 31, 2020, return on common shareholders’ equity was 21.0%, a decrease of 0.7 points from 21.7% for the twelve months ended December 31, 2019, primarily due to an increase in average common shareholders’ equity, partially offset by higher net income applicable to common shareholders.
Pension and other postretirement remeasurement gains and losses We recorded pension and other postretirement remeasurement gains of $51 million in 2020, primarily related to favorable asset performance compared to the expected return on plan assets, partially offset by a decrease in the discount rate and changes in actuarial assumptions. See Note 17 of the consolidated financial statements and Application of Critical Accounting Estimates section of the MD&A for further information.
Adopted accounting standard
Effective January 1, 2020, we adopted the measurement of credit losses on financial instruments accounting standard that primarily affected mortgage loans, bank loans and reinsurance recoverables. Subsequent to the adoption, we measure credit losses on financial instruments, including losses related to mortgage loans, bank loans and reinsurance recoverables, using the expected credit loss model. This model requires us to recognize an estimate of expected credit losses for affected financial assets in a valuation allowance that when deducted from the amortized cost basis of the related financial assets results in a net carrying value at the amount expected to be collected.
See Note 2 of the consolidated financial statements for additional details on the adopted accounting standard.
The Allstate Corporation 39
2020 Form 10-K Property-Liability
Property-Liability Operations
Overview Property-Liability operations consist of two reportable segments: Allstate Protection and Discontinued Lines and Coverages. These segments are consistent with the groupings of financial information that management uses to evaluate performance and to determine the allocation of resources.
We do not allocate Property-Liability investment income, realized capital gains and losses, or assets to the Allstate Protection and Discontinued Lines and Coverages segments. Management reviews assets at the Property-Liability level for decision-making purposes.
The table below includes GAAP operating ratios we use to measure our profitability. We believe that they enhance an investor’s understanding of our profitability. They are calculated as follows:
•Loss ratio: the ratio of claims and claims expense to premiums earned. Loss ratios include the impact of catastrophe losses.
•Expense ratio: the ratio of amortization of DAC, operating costs and expenses, amortization or impairment of purchased intangibles, restructuring and related charges and Shelter-in-Place Payback expense, less other revenue to premiums earned.
•Combined ratio: the sum of the loss ratio and the expense ratio. The difference between 100% and the combined ratio represents underwriting income as a percentage of premiums earned, or underwriting margin.
We have also calculated the following impacts of specific items on the GAAP operating ratios because of the volatility of these items between fiscal periods.
•Effect of catastrophe losses on combined ratio: the ratio of catastrophe losses included in claims and claims expense to premiums earned. This ratio includes prior year reserve reestimates of catastrophe losses.
•Effect of prior year reserve reestimates on combined ratio: the ratio of prior year reserve reestimates included in claims and claims expense to premiums earned. This ratio includes prior year reserve reestimates of catastrophe losses.
•Effect of amortization of purchased intangibles on combined ratio: the ratio of amortization of purchased intangibles to premiums earned.
•Effect of impairment of purchased intangibles on combined ratio: the ratio of impairment of purchased intangibles to premiums earned.
•Effect of restructuring and related charges on combined ratio: the ratio of restructuring and related charges to premiums earned.
•Effect of Shelter-in-Place Payback expense on combined and expense ratios: the ratio of Shelter-in-Place Payback expense to premiums earned.
•Effect of Discontinued Lines and Coverages on combined ratio: the ratio of claims and claims expense and operating costs and expenses in the Discontinued Lines and Coverages segment to Property-Liability premiums earned. The sum of the effect of Discontinued Lines and Coverages on the combined ratio and the Allstate Protection combined ratio is equal to the Property-Liability combined ratio.
Property-Liability 2020 Form 10-K
| | | | | | | | | | | | | | | | | | | | |
Summarized financial data |
| ($ in millions, except ratios) | | 2020 | | 2019 | | 2018 |
| Premiums written | | $ | 35,768 | | | $ | 35,419 | | | $ | 33,555 | |
| | | | | | |
| Revenues | | | | | | |
| Premiums earned | | $ | 35,580 | | | $ | 34,843 | | | $ | 32,950 | |
| Other revenue | | 736 | | | 741 | | | 738 | |
| Net investment income | | 1,421 | | | 1,533 | | | 1,464 | |
Realized capital gains (losses) | | 990 | | | 1,470 | | | (639) | |
| Total revenues | | 38,727 | | | 38,587 | | | 34,513 | |
| | | | | | |
| Costs and expenses | | | | | | |
| Claims and claims expense | | (21,626) | | | (23,622) | | | (22,435) | |
Shelter-in-Place Payback expense (1) | | (948) | | | — | | | — | |
| Amortization of DAC | | (4,642) | | | (4,649) | | | (4,475) | |
Operating costs and expenses (2) | | (4,443) | | | (4,420) | | | (4,465) | |
Restructuring and related charges (3) | | (235) | | | (38) | | | (60) | |
| Impairment of purchased intangibles | | — | | | (51) | | | — | |
| Total costs and expenses | | (31,894) | | | (32,780) | | | (31,435) | |
| | | | | | |
| | | | | | |
Income tax expense | | (1,382) | | | (1,196) | | | (613) | |
| Net income applicable to common shareholders | | $ | 5,451 | | | $ | 4,611 | | | $ | 2,465 | |
| | | | | | |
| Underwriting income | | $ | 4,422 | | | $ | 2,804 | | | $ | 2,253 | |
| Net investment income | | 1,421 | | | 1,533 | | | 1,464 | |
| Income tax expense on operations | | (1,166) | | | (887) | | | (747) | |
Realized capital gains (losses), after-tax | | 774 | | | 1,161 | | | (500) | |
| | | | | | |
| Tax Legislation expense | | — | | | — | | | (5) | |
| Net income applicable to common shareholders | | $ | 5,451 | | | $ | 4,611 | | | $ | 2,465 | |
| | | | | | |
| Catastrophe losses | | | | | | |
| Catastrophe losses, excluding reserve reestimates | | $ | 3,314 | | | $ | 2,509 | | | $ | 2,830 | |
Catastrophe reserve reestimates (4) (5) | | (503) | | | 48 | | | 25 | |
| Total catastrophe losses | | $ | 2,811 | | | $ | 2,557 | | | $ | 2,855 | |
| | | | | | |
Non-catastrophe reserve reestimates (4) | | 68 | | | (176) | | | (278) | |
Prior year reserve reestimates (4) (5) | | (435) | | | (128) | | | (253) | |
| | | | | | |
| GAAP operating ratios | | | | | | |
| Loss ratio | | 60.8 | | | 67.8 | | | 68.1 | |
Expense ratio (6) | | 26.8 | | | 24.2 | | | 25.1 | |
| Combined ratio | | 87.6 | | | 92.0 | | | 93.2 | |
| Effect of catastrophe losses on combined ratio | | 7.9 | | | 7.3 | | | 8.7 | |
Effect of prior year reserve reestimates on combined ratio | | (1.2) | | | (0.3) | | | (0.7) | |
| Effect of catastrophe losses included in prior year reserve reestimates on combined ratio | | (1.4) | | | 0.1 | | | 0.1 | |
Effect of restructuring and related charges on combined ratio (3) | | 0.7 | | | 0.1 | | | 0.2 | |
Effect of amortization of purchased intangibles on combined ratio | | 0.1 | | | — | | | — | |
| Effect of impairment of purchased intangibles | | — | | | 0.1 | | | — | |
| Effect of Shelter-in-Place Payback expense on combined and expense ratios | | 2.7 | | | — | | | — | |
| Effect of Discontinued Lines and Coverages on combined ratio | | 0.4 | | | 0.4 | | | 0.3 | |
(1)Auto and commercial lines customers received a Shelter-in-Place Payback due to the significant declines in the number of auto accidents caused by mandated stay-at-home orders, other pandemic containment actions and reduced economic activity.
(2)As a result of the Coronavirus, we offered customers the Allstate Special Payment plan to provide more flexible payment options, including the option to delay payments, resulting in increased bad debt expense of $60 million in 2020. This increase added 0.2 points to the expense ratio in 2020.
(3)Restructuring and related charges in 2020 primarily related to Transformative Growth. See Note 13 of the consolidated financial statements for additional details.
(4)Favorable reserve reestimates are shown in parentheses.
(5)2020 includes approximately $495 million of favorable reserve reestimates related to the PG&E Corporation and Southern California Edison (together “subrogation settlements”), which primarily impacted homeowners. See Note 8 of the consolidated financial statements for additional details.
(6)Other revenue is deducted from operating costs and expenses in the expense ratio calculation.
The Allstate Corporation 41
2020 Form 10-K Property-Liability
Net investment income decreased 7.3% or $112 million in 2020 compared to 2019, due to a decline in market-based income driven by lower interest-bearing portfolio yields as well as lower performance-based investment results, mainly from limited partnerships. The maturity profile of fixed income securities in our Property-Liability portfolio was a duration of 5.0 years as of December 31, 2020 compared to 5.2 years as of December 31, 2019.
| | | | | | | | | | | | | | | | | | | | |
Net investment income |
| | For the years ended December 31, |
| ($ in millions) | | 2020 | | 2019 | | 2018 |
| Fixed income securities | | $ | 1,110 | | | $ | 1,066 | | | $ | 943 | |
| Equity securities | | 60 | | | 155 | | | 121 | |
| Mortgage loans | | 24 | | | 17 | | | 17 | |
| Limited partnership interests | | 238 | | | 296 | | | 378 | |
| Short-term investments | | 12 | | | 56 | | | 40 | |
| Other | | 101 | | | 107 | | | 123 | |
| Investment income, before expense | | 1,545 | | | 1,697 | | | 1,622 | |
| Investment expense | | | | | | |
Investee level expenses (1) | | (36) | | | (51) | | | (45) | |
| Securities lending expenses | | (4) | | | (27) | | | (18) | |
| Operating costs and expenses | | (84) | | | (86) | | | (95) | |
| Total investment expense | | (124) | | | (164) | | | (158) | |
| Net investment income | | $ | 1,421 | | | $ | 1,533 | | | $ | 1,464 | |
(1) Beginning January 1, 2020, depreciation previously included in investee level expenses is reported as realized capital gains or losses.
Realized capital gains and losses Net realized capital gains in 2020 primarily related to gains on sales of fixed income securities. Net realized capital gains in 2019 primarily related to increased valuation of equity investments and gains on sales of fixed income securities.
| | | | | | | | | | | | | | | | | | | | |
Realized capital gains (losses) |
| | For the years ended December 31, |
| ($ in millions) | | 2020 | | 2019 | | 2018 |
Sales (1) | | $ | 890 | | | $ | 498 | | | $ | (148) | |
Credit losses (2) | | (31) | | | (26) | | | (5) | |
| Valuation of equity investments - appreciation (decline): | | | | | | |
| Equity securities | | 123 | | | 840 | | | (434) | |
| Equity fund investments in fixed income securities | | (20) | | | 43 | | | (13) | |
Limited partnerships (3) | | (21) | | | 141 | | | (75) | |
| Total valuation of equity investments | | 82 | | | 1,024 | | | (522) | |
| Valuation and settlements of derivative instruments | | 49 | | | (26) | | | 36 | |
Realized capital gains (losses), pre-tax | | 990 | | | 1,470 | | | (639) | |
| Income tax (expense) benefit | | (216) | | | (309) | | | 139 | |
Realized capital gains (losses), after-tax | | $ | 774 | | | $ | 1,161 | | | $ | (500) | |
(1)Beginning January 1, 2020, depreciation previously included in investee level expenses is reported as realized capital gains or losses.
(2)Due to the adoption of the measurement of credit losses on financial instruments accounting standard, realized capital losses previously reported as other-than-temporary impairment write-downs are now presented as credit losses.
(3)Relates to limited partnerships where the underlying assets are predominately public equity securities.
Allstate Protection 2020 Form 10-K
Allstate Protection Segment
Private passenger auto, homeowners, and other personal lines insurance products are offered to consumers through both exclusive and independent agents and directly through contact centers and online. Our strategy is to provide open access and choice of interaction, while offering affordable, simple and connected solutions to meet customers’ evolving needs and protect them from life’s uncertainties. For additional information on our strategy and outlook, see Part I, Item 1. Business - Strategy and Segment Information.
As part of Transformative Growth, Esurance results were combined into the Allstate brand in the third quarter of 2020. Historical results have been updated to conform with this presentation.
| | | | | | | | | | | | | | | | | | | | |
Underwriting results |
| | For the years ended December 31, |
| ($ in millions) | | 2020 | | 2019 | | 2018 |
| Premiums written | | $ | 35,768 | | | $ | 35,419 | | | $ | 33,555 | |
| Premiums earned | | $ | 35,580 | | | $ | 34,843 | | | $ | 32,950 | |
| Other revenue | | 736 | | | 741 | | | 738 | |
| Claims and claims expense | | (21,485) | | | (23,517) | | | (22,348) | |
| Shelter-in-Place Payback expense | | (948) | | | — | | | — | |
| Amortization of DAC | | (4,642) | | | (4,649) | | | (4,475) | |
| Other costs and expenses | | (4,440) | | | (4,417) | | | (4,462) | |
| Restructuring and related charges | | (235) | | | (38) | | | (60) | |
| Impairment of purchased intangibles | | — | | | (51) | | | — | |
| Underwriting income | | $ | 4,566 | | | $ | 2,912 | | | $ | 2,343 | |
| Catastrophe losses | | $ | 2,811 | | | $ | 2,557 | | | $ | 2,855 | |
| | | | | | |
| Underwriting income (loss) by line of business | | | | | | |
| Auto | | $ | 3,444 | | | $ | 1,688 | | | $ | 1,791 | |
| Homeowners | | 824 | | | 914 | | | 483 | |
Other personal lines (1) | | 264 | | | 224 | | | 110 | |
| Commercial lines | | (36) | | | 14 | | | (83) | |
Other business lines (2) | | 67 | | | 75 | | | 49 | |
| Answer Financial | | 3 | | | (3) | | | (7) | |
| Underwriting income | | $ | 4,566 | | | $ | 2,912 | | | $ | 2,343 | |
(1)Other personal lines include renters, condominium, landlord and other personal lines products.
(2)Other business lines primarily represent Ivantage, a general agency for Allstate exclusive agents and reflects revenue and direct operating expenses of the business. Ivantage provides agents a solution for their customers when coverage through Allstate brand underwritten products is not available.
The Allstate Corporation 43
2020 Form 10-K Allstate Protection
| | | | | | | | | | | | | | | | | | | | | | | | | | | | | | | | | | | | | | | | | | | | | | | | | | | | | | | | | | | | | | |
Changes in underwriting results from prior year by component and by line of business (1) |
| | For the year ended December 31, |
| | Auto | | Homeowners | | Other personal lines | | Commercial lines | | Allstate Protection (2) |
| ($ in millions) | | 2020 | | 2019 | | 2020 | | 2019 | | 2020 | | 2019 | | 2020 | | 2019 | | 2020 | | 2019 |
| Underwriting income (loss) - prior year | | $ | 1,688 | | | $ | 1,791 | | | $ | 914 | | | $ | 483 | | | $ | 224 | | | $ | 110 | | | $ | 14 | | | $ | (83) | | | $ | 2,912 | | | $ | 2,343 | |
| Changes in underwriting income (loss) from: | | | | | | | | | | | | | | | | | | | | |
| Increase (decrease) premiums earned | | 452 | | | 1,218 | | | 342 | | | 395 | | | 58 | | | 53 | | | (115) | | | 227 | | | 737 | | | 1,893 | |
| Increase (decrease) other revenue | | (11) | | | 1 | | | (2) | | | — | | | 5 | | | (1) | | | (1) | | | — | | | (5) | | | 3 | |
| (Increase) decrease incurred claims and claims expense (“losses”): | | | | | | | | | | | | | | | | | | | | |
| Incurred losses, excluding catastrophe losses and reserve reestimates | | 2,450 | | | (1,002) | | | (78) | | | (183) | | | 6 | | | 21 | | | 116 | | | (219) | | | 2,494 | | | (1,383) | |
| Catastrophe losses, excluding reserve reestimates | | 100 | | | (33) | | | (823) | | | 294 | | | (70) | | | 51 | | | (12) | | | 9 | | | (805) | | | 321 | |
| Catastrophe reserve reestimates | | 27 | | | (22) | | | 488 | | | (1) | | | 39 | | | (1) | | | (3) | | | 1 | | | 551 | | | (23) | |
| Non-catastrophe reserve reestimates | | (243) | | | (110) | | | 16 | | | (50) | | | 35 | | | (14) | | | (16) | | | 90 | | | (208) | | | (84) | |
| | | | | | | | | | | | | | | | | | | | |
Losses subtotal | | 2,334 | | | (1,167) | | | (397) | | | 60 | | | 10 | | | 57 | | | 85 | | | (119) | | | 2,032 | | | (1,169) | |
Shelter-in-Place Payback expense | | (944) | | | — | | | — | | | — | | | — | | | — | | | (4) | | | — | | | (948) | | | — | |
| (Increase) decrease expenses | | (75) | | | (155) | | | (33) | | | (24) | | | (33) | | | 5 | | | (15) | | | (11) | | | (162) | | | (158) | |
| Underwriting income (loss) | | $ | 3,444 | | | $ | 1,688 | | | $ | 824 | | | $ | 914 | | | $ | 264 | | | $ | 224 | | | $ | (36) | | | $ | 14 | | | $ | 4,566 | | | $ | 2,912 | |
(1)The 2020 column presents changes relative to 2019. The 2019 column presents changes relative to 2018.
(2)Includes other business lines and Answer Financial.
Underwriting income increased 56.8% or $1.65 billion in 2020 compared to 2019, primarily due to lower auto non-catastrophe losses, increased premiums earned and favorable catastrophe reserve reestimates in personal lines homeowners driven by subrogation settlements, partially offset by Shelter-in-Place Payback expense and higher catastrophe losses.
Allstate Protection 2020 Form 10-K
Premiums written is the amount of premiums charged for policies issued during a fiscal period. Premiums are considered earned and are included in the financial results on a pro-rata basis over the policy period. The portion of premiums written applicable to the unexpired term of the policies is recorded as unearned premiums on our Consolidated Statements of Financial Position.
| | | | | | | | | | | | | | | | | | | | |
Premiums written and earned by line of business |
| | For the years ended December 31, |
| ($ in millions) | | 2020 | | 2019 | | 2018 |
| Premiums written | | | | | | |
| Auto | | $ | 24,611 | | | $ | 24,462 | | | $ | 23,367 | |
| Homeowners | | 8,400 | | | 8,165 | | | 7,698 | |
| Other personal lines | | 1,965 | | | 1,890 | | | 1,831 | |
| Subtotal – Personal lines | | 34,976 | | | 34,517 | | | 32,896 | |
| Commercial lines | | 792 | | | 902 | | | 659 | |
| | | | | | |
| | | | | | |
| Total premiums written | | $ | 35,768 | | | $ | 35,419 | | | $ | 33,555 | |
| Reconciliation of premiums written to premiums earned: | | | | | | |
| Increase in unearned premiums | | (205) | | | (614) | | | (544) | |
| Other | | 17 | | | 38 | | | (61) | |
Total premiums earned | | $ | 35,580 | | | $ | 34,843 | | | $ | 32,950 | |
| | | | | | |
| Auto | | $ | 24,640 | | | $ | 24,188 | | | $ | 22,970 | |
| Homeowners | | 8,254 | | | 7,912 | | | 7,517 | |
| Other personal lines | | 1,919 | | | 1,861 | | | 1,808 | |
| Subtotal – Personal lines | | 34,813 | | | 33,961 | | | 32,295 | |
| Commercial lines | | 767 | | | 882 | | | 655 | |
| | | | | | |
| | | | | | |
| Total premiums earned | | $ | 35,580 | | | $ | 34,843 | | | $ | 32,950 | |
Auto insurance premiums written increased 0.6% or $149 million in 2020 compared to 2019.
Homeowners insurance premiums written increased 2.9% or $235 million in 2020 compared to 2019.
| | | | | | | | | | | | | | | | | | | | | | | | | | | | | | | | | | | | | | |
Unearned premium balance and the time frame in which we expect to recognize these premiums as earned |
| ($ in millions) | | As of December 31, | | % earned after |
| 2020 | | 2019 | | Three months | | Six months | | Nine months | | Twelve months |
| Allstate brand: | | | | | | | | | | | | |
| Auto | | $ | 6,409 | | | $ | 6,405 | | | 70.7 | % | | 96.3 | % | | 99.1 | % | | 100.0 | % |
| Homeowners | | 4,379 | | | 4,220 | | | 43.2 | % | | 75.4 | % | | 94.1 | % | | 100.0 | % |
| Other personal lines | | 1,001 | | | 952 | | | 43.3 | % | | 75.3 | % | | 94.1 | % | | 100.0 | % |
| Commercial lines | | 295 | | | 270 | | | 43.3 | % | | 74.6 | % | | 93.7 | % | | 100.0 | % |
| | | | | | | | | | | | |
| Total Allstate brand | | 12,084 | | | 11,847 | | | 58.0 | % | | 86.6 | % | | 96.8 | % | | 100.0 | % |
| Encompass brand: | | | | | | | | | | | | |
| Auto | | 258 | | | 276 | | | 44.1 | % | | 75.8 | % | | 94.2 | % | | 100.0 | % |
| Homeowners | | 207 | | | 214 | | | 43.9 | % | | 75.8 | % | | 94.3 | % | | 100.0 | % |
| Other personal lines | | 39 | | | 41 | | | 44.2 | % | | 76.1 | % | | 94.3 | % | | 100.0 | % |
| Total Encompass brand | | 504 | | | 531 | | | 44.0 | % | | 75.8 | % | | 94.2 | % | | 100.0 | % |
| Allstate Protection unearned premiums | | $ | 12,588 | | | $ | 12,378 | | | | | | | | | |
The Allstate Corporation 45
2020 Form 10-K Allstate Protection
| | | | | | | | | | | | | | | | | | | | | | | | | | | | | | | | | | | | | | | | | | | | | | | | | | | | | | | | |
Combined ratios by line of business |
| | For the years ended December 31, |
| | Loss ratio | | Expense ratio (1) | | Combined ratio |
| | 2020 | | 2019 | | 2018 | | 2020 | | 2019 | | 2018 | | 2020 | | 2019 | | 2018 |
| Auto | | 57.5 | | | 68.2 | | | 66.8 | | | 28.5 | | | 24.8 | | | 25.4 | | | 86.0 | | | 93.0 | | | 92.2 | |
| Impact of Shelter-in-Place Payback expense | | — | | | — | | | — | | | 3.8 | | | — | | | — | | | 3.8 | | | — | | | — | |
| Homeowners | | 67.3 | | | 65.1 | | | 69.4 | | | 22.7 | | | 23.3 | | | 24.2 | | | 90.0 | | | 88.4 | | | 93.6 | |
| Other personal lines | | 58.7 | | | 61.1 | | | 66.0 | | | 27.5 | | | 26.9 | | | 27.9 | | | 86.2 | | | 88.0 | | | 93.9 | |
| Commercial lines | | 82.4 | | | 81.3 | | | 91.3 | | | 22.3 | | | 17.1 | | | 21.4 | | | 104.7 | | | 98.4 | | | 112.7 | |
| Impact of Shelter-in-Place Payback expense | | — | | | — | | | — | | | 0.5 | | | — | | | | | 0.5 | | | — | | | — | |
| | | | | | | | | | | | | | | | | | |
| Total | | 60.4 | | | 67.5 | | | 67.8 | | | 26.8 | | | 24.1 | | | 25.1 | | | 87.2 | | | 91.6 | | | 92.9 | |
Impact of restructuring and related charges (2) | | — | | | — | | | — | | | 0.7 | | | 0.1 | | | 0.2 | | | 0.7 | | | 0.1 | | | 0.2 | |
| Impact of Shelter-in-Place Payback expense | | — | | | — | | | — | | | 2.7 | | | — | | | — | | | 2.7 | | | — | | | — | |
Impact of Allstate Special Payment plan bad debt expense (3) | | — | | | — | | | — | | | 0.2 | | | — | | | — | | | 0.2 | | | — | | | — | |
(1)Other revenue is deducted from operating costs and expenses in the expense ratio calculation.
(2)Restructuring and related charges in 2020 primarily related to Transformative Growth.
(3)Relates to the Allstate Special Payment plan offered to customers as a result of the Coronavirus to provide more flexible payment options, including the option to delay payments. Approximately 70% of the higher bad debt expense was attributed to auto.
| | | | | | | | | | | | | | | | | | | | | | | | | | | | | | | | | | | | | | | | | | | | | | | | | | | | | | | | | | | | | | | | | | | | | | | | | | |
Loss ratios by line of business |
| | For the years ended December 31, |
| | Loss ratio | | Effect of catastrophe losses on combined ratio | | Effect of prior year reserve reestimates on combined ratio | | Effect of catastrophe losses included in prior year reserve reestimates on combined ratio |
| | 2020 | | 2019 | | 2018 | | 2020 | | 2019 | | 2018 | | 2020 | | 2019 | | 2018 | | 2020 | | 2019 | | 2018 |
| Auto | | 57.5 | | | 68.2 | | | 66.8 | | | 1.2 | | | 1.7 | | | 1.6 | | | (0.4) | | | (1.4) | | | (2.0) | | | (0.1) | | | (0.1) | | | (0.2) | |
| Homeowners | | 67.3 | | | 65.1 | | | 69.4 | | | 27.9 | | | 24.8 | | | 30.0 | | | (5.3) | | | 0.8 | | | 0.2 | | | (5.1) | | | 0.8 | | | 0.8 | |
| Other personal lines | | 58.7 | | | 61.1 | | | 66.0 | | | 10.4 | | | 9.0 | | | 12.1 | | | (3.5) | | | 0.5 | | | (0.4) | | | (2.0) | | | — | | | — | |
| Commercial lines | | 82.4 | | | 81.3 | | | 91.3 | | | 3.5 | | | 1.4 | | | 3.4 | | | 4.7 | | | 1.9 | | | 16.5 | | | 0.2 | | | (0.1) | | | — | |
| | | | | | | | | | | | | | | | | | | | | | | | |
| Total | | 60.4 | | | 67.5 | | | 67.8 | | | 7.9 | | | 7.3 | | | 8.7 | | | (1.6) | | | (0.7) | | | (1.0) | | | (1.4) | | | 0.1 | | | 0.1 | |
Allstate Protection 2020 Form 10-K
Catastrophe losses increased 9.9% or $254 million in 2020 compared to 2019. Catastrophe losses include approximately $495 million favorable subrogation settlements, which decreased the loss ratio by 1.4 points in 2020 compared to the same period of 2019. Excluding subrogation settlements, catastrophe losses increased approximately 30% or $750 million compared to 2019.
We define a “catastrophe” as an event that produces pre-tax losses before reinsurance in excess of $1 million and involves multiple first party policyholders, or a winter weather event that produces a number of claims in excess of a preset, per-event threshold of average claims in a specific area, occurring within a certain amount of time following the event. Catastrophes are caused by various natural events including high winds, winter storms and freezes, tornadoes, hailstorms, wildfires, tropical storms, tsunamis, hurricanes, earthquakes and volcanoes. We are also exposed to man-made catastrophic events, such as certain types of terrorism, wildfires or industrial accidents. The nature and level of catastrophes in any period cannot be reliably predicted.
| | | | | | | | | | | | | | | | | | | | | | | | | | | | | | | | | | | | | | |
Catastrophe losses in 2020 by the size of event |
| ($ in millions) | | Number of events | | | | Claims and claims expense | | | | Combined ratio impact | | Average catastrophe loss per event |
| Size of catastrophe loss | | | | | | | | | | | | |
| Greater than $250 million | | 1 | | | 0.9 | % | | $ | 518 | | | 18.4 | % | | 1.4 | | | $ | 518 | |
| $101 million to $250 million | | 6 | | | 5.7 | | | 953 | | | 33.9 | | | 2.7 | | | 159 | |
| $50 million to $100 million | | 11 | | | 10.5 | | | 740 | | | 26.3 | | | 2.1 | | | 67 | |
| Less than $50 million | | 87 | | | 82.9 | | | 1,103 | | | 39.3 | | | 3.1 | | | 13 | |
| Total | | 105 | | | 100.0 | % | | 3,314 | | | 117.9 | | | 9.3 | | | 32 | |
| Prior year reserve reestimates | | | | | | (503) | | | (17.9) | | | (1.4) | | | |
| Total catastrophe losses | | | | | | $ | 2,811 | | | 100.0 | % | | 7.9 | | | |
| | | | | | | | | | | | | | | | | | | | | | | | | | | | | | | | | | | | | | |
Catastrophe losses by the type of event |
| | For the years ended December 31, |
| ($ in millions) | | Number of events | | 2020 | | Number of events | | 2019 | | Number of events | | 2018 |
| Hurricanes/Tropical storms | | 9 | | | $ | 1,001 | | | 3 | | | $ | 86 | | | 3 | | | $ | 200 | |
| Tornadoes | | 3 | | | 43 | | | 6 | | | 551 | | | 3 | | | 17 | |
| Wind/Hail | | 73 | | | 1,940 | | | 91 | | | 1,721 | | | 99 | | | 1,752 | |
| Wildfires | | 17 | | | 300 | | | 4 | | | 28 | | | 10 | | | 745 | |
| Other events | | 3 | | | 30 | | | 6 | | | 123 | | | 2 | | | 116 | |
| Prior year reserve reestimates | | | | (503) | | | | | 48 | | | | | 25 | |
| Total catastrophe losses | | 105 | | | $ | 2,811 | | | 110 | | | $ | 2,557 | | | 117 | | | $ | 2,855 | |
Catastrophe management
Historical catastrophe experience For the last ten years, the average annual impact of catastrophes on our loss ratio was 8.2 points, but it has varied from 4.5 points to 14.7 points. The average annual impact of catastrophes on the homeowners loss ratio for the last ten years was 26.6 points. Over time, we have limited our aggregate insurance exposure to catastrophe losses in certain regions of the country that are subject to high levels of natural catastrophes by our participation in various state facilities. For further discussion of these facilities, see Note 14 of the consolidated financial statements. However, the impact of these actions may be diminished by the growth in insured values, and the effect of state insurance laws and regulations. In addition, in various states we are required to participate in assigned risk plans, reinsurance facilities and joint underwriting associations that provide insurance coverage to individuals or entities that otherwise are unable to purchase such coverage from private insurers. Because of our participation in these and other state facilities such as wind pools, we may be exposed to losses that surpass the capitalization of these facilities and to assessments from these facilities.
We have continued to take actions to maintain an appropriate level of exposure to catastrophic events while continuing to meet the needs of our customers, including the following:
•Continuing to limit or not offer new homeowners, manufactured home and landlord package policy business in certain coastal geographies.
•Increased capacity in our brokerage platform for customers not offered an Allstate policy.
•We began to write a limited number of homeowners policies in select areas of California in 2016, additionally we:
–Continue to renew current policyholders and allow replacement policies for existing customers who buy a new home or change their residence to rental property
–Have decreased our overall homeowner exposures in California by more than 50% since 2007
–Write homeowners coverage through our excess and surplus lines carrier, North Light Specialty Insurance Company (“North Light”), which includes earthquake coverage (other
The Allstate Corporation 47
2020 Form 10-K Allstate Protection
than fire following earthquakes) that is currently ceded via quota share reinsurance.
•In certain states, we have been ceding wind exposure related to insured property located in wind pool eligible areas.
•Starting in the second quarter of 2017, we began writing a limited number of homeowners policies in select areas of Florida and continue to support existing customers who replace their currently-insured home with an acceptable property. Encompass withdrew from property lines in Florida in 2009.
•Tropical cyclone deductibles are generally higher than all peril deductibles and are in place for a large portion of coastal insured properties.
•Auto comprehensive damage coverage generally includes coverage for flood-related loss. We have additional catastrophe exposure, beyond the property lines, for auto customers who have purchased comprehensive damage coverage.
•We offer a homeowners policy available in 43 states, Allstate House and Home®, that provides options of coverage for roof damage, including graduated coverage and pricing based on roof type and age. In 2020, premiums written totaled $3.92 billion or 46.7% of homeowners premiums written compared to $3.44 billion or 42.1% in 2019.
Hurricanes We consider the greatest areas of potential catastrophe losses due to hurricanes generally to be major metropolitan centers in counties along the eastern and gulf coasts of the United States. The average premium on a property policy near these coasts is generally greater than in other areas. However, average premiums are often not considered commensurate with the inherent risk of loss. In addition, as explained in Note 14 of the consolidated financial statements, in various states Allstate is subject to assessments from assigned risk plans, reinsurance facilities and joint underwriting associations providing insurance for wind related property losses.
We have addressed our risk of hurricane loss by, among other actions, purchasing reinsurance for specific states and on a countrywide basis for our personal lines property insurance in areas most exposed to hurricanes, limiting personal homeowners, landlord package policy and manufactured home new business writings in coastal areas in southern and eastern states, implementing tropical cyclone deductibles where appropriate, and not offering continuing coverage on certain policies in coastal counties in certain states. We continue to seek appropriate returns for the risks we write. This may require further actions, similar to those already taken, in geographies where we are not getting appropriate
returns. However, we may maintain or opportunistically increase our presence in areas where adequate risk adjusted returns can be achieved.
Earthquakes We do not offer earthquake coverage in most states. We retain approximately 20,000 PIF with earthquake coverage, primarily in Kentucky, due to regulatory and other reasons. We purchase reinsurance in Kentucky and enter into arrangements in many states to make earthquake coverage available through our brokerage platform.
We continue to have exposure to earthquake risk on certain policies that do not specifically exclude coverage for earthquake losses, including our auto policies, and to fires following earthquakes. Allstate homeowner policyholders in California are offered coverage for damage caused by an earthquake through the California Earthquake Authority (“CEA”), a privately-financed, publicly-managed state agency created to provide insurance coverage for earthquake damage. Allstate is subject to assessments from the CEA under certain circumstances as explained in Note 14 of the consolidated financial statements. While North Light writes property policies in California, which can include earthquake coverage, this coverage is 100% ceded via quota share reinsurance.
Fires following earthquakes Under a standard homeowners policy we cover fire losses, including those caused by an earthquake. Actions taken related to our risk of loss from fires following earthquakes include restrictive underwriting guidelines in California for new business writings, purchasing reinsurance for Kentucky personal lines property risks, and purchasing nationwide occurrence reinsurance, excluding Florida.
Wildfires Actions taken related to managing our risk of loss from wildfires include purchasing nationwide occurrence reinsurance, new and renewal inspection programs to identify and remediate wildfire risk as well as leveraging contemporary underwriting tools in select areas. While these programs are designed to mitigate risk, the exposure to wildfires still exists. We continue to manage our exposure and seek appropriate returns for the risks we write.
To manage the exposure, we may implement further actions, similar to those already taken, in geographies where we are not achieving appropriate returns. However, we may maintain or opportunistically increase our presence in areas where adequate risk adjusted returns can be achieved.
Reinsurance A description of our current catastrophe reinsurance program appears in Note 10 of the consolidated financial statements.
Allstate Protection 2020 Form 10-K
Expense ratio increased 2.7 points in 2020 compared to 2019, reflecting Shelter-in-Place Payback expense, higher restructuring charges related to Transformative Growth and bad debt expense. Excluding Shelter-in-Place Payback expense, higher restructuring charges related to Transformative Growth, bad debt expense and impairment of purchased intangibles in 2019, the expense ratio decreased 0.8 points in 2020 compared to 2019, primarily due to lower operating expenses and agent compensation, partially offset by an increase in advertising costs.
| | | | | | | | | | | | | | | | | | | | |
Impact of specific costs and expenses on the expense ratio |
| | For the years ended December 31, |
| | 2020 | | 2019 | | 2018 |
| Amortization of DAC | | 13.0 | | | 13.4 | | | 13.6 | |
| Advertising expense | | 2.6 | | | 2.4 | | | 2.5 | |
| Amortization of purchased intangibles | | 0.1 | | | — | | | — | |
| Other costs and expenses | | 7.5 | | | 8.1 | | | 8.8 | |
| Subtotal | | 23.2 | | | 23.9 | | | 24.9 | |
Restructuring and related charges (1) | | 0.7 | | | 0.1 | | | 0.2 | |
Shelter-in-Place Payback expense | | 2.7 | | | — | | | — | |
| Allstate Special Payment plan bad debt expense | | 0.2 | | | — | | | — | |
| Impairment of purchased intangibles | | — | | | 0.1 | | | — | |
| Total expense ratio | | 26.8 | | | 24.1 | | | 25.1 | |
(1)Restructuring and related charges in 2020 primarily related to Transformative Growth.
Deferred acquisition costs We establish a DAC asset for costs that are related directly to the successful acquisition of new or renewal insurance policies, principally agent remuneration and premium taxes. DAC is amortized to income over the period in which premiums are earned.
| | | | | | | | | | | | | | |
DAC balance as of December 31 by product type |
| ($ in millions) | | 2020 | | 2019 |
| Auto | | $ | 826 | | | $ | 849 | |
| Homeowners | | 602 | | | 600 | |
| Other personal lines | | 144 | | | 141 | |
| Commercial lines | | 36 | | | 34 | |
| | | | |
| Total DAC | | $ | 1,608 | | | $ | 1,624 | |
The Allstate Corporation 49
2020 Form 10-K Allstate Protection
The following table presents premiums written, PIF and underwriting income (loss) by line of business for Allstate brand, Encompass brand and Allstate Protection as of or for the year ended December 31, 2020. Detailed analysis of underwriting results, premiums written and earned, and the combined ratios, including loss and expense ratios, are discussed in the brand sections.
| | | | | | | | | | | | | | | | | | | | | | | | | | | | | | | | | | | | | | | | | |
Premiums written, policies in force and underwriting income (loss) |
| ($ in millions) | | Allstate brand | | | Encompass brand | | Allstate Protection |
| Premiums written | | Amount | | Percent to total brand | | | Amount | | Percent to total brand | | Amount | | Percent to total |
| Auto | | $ | 24,103 | | | 69.3 | % | | | $ | 508 | | | 52.3 | % | | $ | 24,611 | | | 68.8 | % |
| Homeowners | | 8,012 | | | 23.0 | | | | 388 | | | 39.9 | | | 8,400 | | | 23.5 | |
| Other personal lines | | 1,889 | | | 5.4 | | | | 76 | | | 7.8 | | | 1,965 | | | 5.5 | |
| Commercial lines | | 792 | | | 2.3 | | | | — | | | — | | | 792 | | | 2.2 | |
| Total | | $ | 34,796 | | | 100.0 | % | | | $ | 972 | | | 100.0 | % | | $ | 35,768 | | | 100.0 | % |
| | | | | | | | | | | | | |
| Percent to total Allstate Protection | | | | 97.3 | % | | | | | 2.7 | % | | | | 100.0 | % |
| | | | | | | | | | | | | |
| PIF (thousands) | | | | | | | | | | | | | |
| Auto | | 21,809 | | | 66.3 | % | | | 451 | | | 61.1 | % | | 22,260 | | | 66.2 | % |
| Homeowners | | 6,427 | | | 19.5 | | | | 216 | | | 29.3 | | | 6,643 | | | 19.7 | |
| Other personal lines | | 4,459 | | | 13.5 | | | | 71 | | | 9.6 | | | 4,530 | | | 13.5 | |
| Commercial lines | | 216 | | | 0.7 | | | | — | | | — | | | 216 | | | 0.6 | |
| Total | | 32,911 | | | 100.0 | % | | | 738 | | | 100.0 | % | | 33,649 | | | 100.0 | % |
| | | | | | | | | | | | | |
| Percent to total Allstate Protection | | | | 97.8 | % | | | | | 2.2 | % | | | | 100.0 | % |
| | | | | | | | | | | | | |
| Underwriting income (loss) | | | | | | | | | | | | | |
| Auto | | $ | 3,404 | | | 75.8 | % | | | $ | 40 | | | 53.3 | % | | $ | 3,444 | | | 75.4 | % |
| Homeowners | | 798 | | | 17.8 | | | | 26 | | | 34.7 | | | 824 | | | 18.0 | |
| Other personal lines | | 255 | | | 5.7 | | | | 9 | | | 12.0 | | | 264 | | | 5.8 | |
| Commercial lines | | (36) | | | (0.8) | | | | — | | | — | | | (36) | | | (0.8) | |
| Other business lines | | 67 | | | 1.5 | | | | — | | | — | | | 67 | | | 1.5 | |
| Answer Financial | | — | | | — | | | | — | | | — | | | 3 | | | 0.1 | |
| Total | | $ | 4,488 | | | 100.0 | % | | | $ | 75 | | | 100.0 | % | | $ | 4,566 | | | 100.0 | % |
When analyzing premium measures and statistics for our brands the following calculations are used as described below.
•PIF: Policy counts are based on items rather than customers. A multi-car customer would generate multiple item (policy) counts, even if all cars were insured under one policy while Commercial lines PIF counts for shared economy agreements typically reflect contracts that cover multiple rather than individual drivers.
•New issued applications: Item counts of automobile or homeowner insurance applications for insurance policies that were issued during the period, regardless of whether the customer was previously insured by another Allstate Protection brand. Allstate brand includes automobiles added by existing customers when they exceed the number allowed (currently 10) on a policy.
•Average premium-gross written (“average premium”): Gross premiums written divided by issued item count. Gross premiums written include the impacts from discounts, surcharges and ceded reinsurance premiums and exclude the impacts from mid-term premium adjustments and premium refund accruals. Average premiums represent the appropriate policy term for each line. Allstate brand policy terms are 6 months for auto and 12 months for homeowners. Encompass brand
policy terms are generally 12 months for auto and homeowners.
•Renewal ratio: Renewal policy item counts issued during the period, based on contract effective dates, divided by the total policy item counts issued 6 months prior for auto (generally 12 months prior for Encompass brand) or 12 months prior for homeowners.
•Total brand rate changes: Based on historical premiums written, not including rate plan enhancements (such as the introduction of discounts and surcharges that result in no change in the overall rate level) and initial rates filed for insurance subsidiaries initially writing business in a location. Includes rate changes approved based on our net cost of reinsurance. The rate change percentages are calculated using approved rate changes during the period as a percentage of total brand premiums written.
Allstate Protection: Allstate brand 2020 Form 10-K
Allstate brand products are sold across multiple channels, including Allstate exclusive agents and direct (online or call centers). In 2020, the Allstate brand represented 97.3% of the Allstate Protection segment’s written premium. For additional information on our strategy and outlook, see Part I, Item 1. Business - Strategy and Segment Information.
| | | | | | | | | | | | | | | | | | | | |
Underwriting results |
| | For the years ended December 31, |
| ($ in millions) | | 2020 | | 2019 | | 2018 |
| Premiums written | | $ | 34,796 | | | $ | 34,399 | | | $ | 32,539 | |
| Premiums earned | | $ | 34,581 | | | $ | 33,825 | | | $ | 31,927 | |
| Other revenue | | 663 | | | 666 | | | 662 | |
| Claims and claims expense | | (20,897) | | | (22,828) | | | (21,680) | |
| Shelter-in-Place Payback expense | | (927) | | | — | | | — | |
| Amortization of DAC | | (4,451) | | | (4,457) | | | (4,285) | |
| Other costs and expenses | | (4,253) | | | (4,213) | | | (4,239) | |
| Restructuring and related charges | | (228) | | | (34) | | | (53) | |
| Impairment of purchased intangibles | | — | | | (51) | | | — | |
| Underwriting income | | $ | 4,488 | | | $ | 2,908 | | | $ | 2,332 | |
| Catastrophe losses | | $ | 2,716 | | | $ | 2,442 | | | $ | 2,753 | |
| | | | | | |
| Underwriting income (loss) by line of business | | | | | | |
| Auto | | $ | 3,404 | | | $ | 1,680 | | | $ | 1,777 | |
| Homeowners | | 798 | | | 912 | | | 481 | |
Other personal lines (1) | | 255 | | | 227 | | | 108 | |
| Commercial lines | | (36) | | | 14 | | | (83) | |
Other business lines (2) | | 67 | | | 75 | | | 49 | |
| Underwriting income | | $ | 4,488 | | | $ | 2,908 | | | $ | 2,332 | |
(1)Other personal lines include renters, condominium, landlord and other personal lines products.
(2)Other business lines primarily represent Ivantage.
Underwriting income increased 54.3% or $1.58 billion in 2020 compared to 2019, primarily due to lower auto non-catastrophe losses, increased premiums earned and favorable catastrophe reserve reestimates in homeowners driven by subrogation settlements, partially offset by Shelter-in-Place Payback expense and higher catastrophe losses.
The Allstate Corporation 51
2020 Form 10-K Allstate Protection: Allstate brand
| | | | | | | | | | | | | | | | | | | | |
Premiums written and earned by line of business |
| | For the years ended December 31, |
| ($ in millions) | | 2020 | | 2019 | | 2018 |
| Premiums written | | | | | | |
| Auto | | $ | 24,103 | | | $ | 23,922 | | | $ | 22,830 | |
Homeowners (1) | | 8,012 | | | 7,764 | | | 7,300 | |
| Other personal lines | | 1,889 | | | 1,811 | | | 1,750 | |
| Subtotal – Personal lines | | 34,004 | | | 33,497 | | | 31,880 | |
| Commercial lines | | 792 | | | 902 | | | 659 | |
| | | | | | |
| Total | | $ | 34,796 | | | $ | 34,399 | | | $ | 32,539 | |
| Premiums earned | | | | | | |
| Auto | | $ | 24,115 | | | $ | 23,649 | | | $ | 22,434 | |
| Homeowners | | 7,858 | | | 7,513 | | | 7,114 | |
| Other personal lines | | 1,841 | | | 1,781 | | | 1,724 | |
| Subtotal – Personal lines | | 33,814 | | | 32,943 | | | 31,272 | |
| Commercial lines | | 767 | | | 882 | | | 655 | |
| | | | | | |
| Total | | $ | 34,581 | | | $ | 33,825 | | | $ | 31,927 | |
(1)The cost of our catastrophe reinsurance program increased $35 million to $321 million in 2020 from $286 million in 2019. Catastrophe placement premiums are recorded primarily in the Allstate brand and are a reduction of premium. For a more detailed discussion on reinsurance, see the Claims and Claims Expense Reserves section of the MD&A and Note 10 of the consolidated financial statements.
| | | | | | | | | | | | | | | | | | | | | | | | | | | | | | | | |
Auto premium measures and statistics |
| | 2020 | | 2019 | | 2018 | | 2020 vs. 2019 | | 2019 vs. 2018 |
| PIF (thousands) | | 21,809 | | | 21,913 | | | 21,592 | | | (0.5) | % | | 1.5 | % |
| New issued applications (thousands) | | 3,467 | | | 3,535 | | | 3,566 | | | (1.9) | % | | (0.9) | % |
| Average premium | | $ | 617 | | | $ | 603 | | | $ | 586 | | | 2.3 | % | | 2.9 | % |
| Renewal ratio (%) | | 87.5 | | | 88.0 | | | 88.0 | | | (0.5) | | | — | |
| | | | | | | | | | |
| | | | | | | | | | |
| Total brand rate changes (%) | | (0.2) | | | 3.0 | | | 1.2 | | | (3.2) | | | 1.8 | |
| | | | | | | | | | |
Auto insurance premiums written increased 0.8% or $181 million in 2020 compared to 2019, primarily due to an increase in average premium. During the second quarter through year-end 2020, growth in premiums written slowed significantly due to lower increases in average premium from fewer approved rate changes related to the Coronavirus.
New issued applications decreased 1.9% compared to 2019 due to impacts from the Coronavirus in the first half of 2020 and fewer new exclusive agent appointments, partially offset by an increase in direct and independent agent business.
Rate changes are maintained on a state by state basis. Auto average premium may decline in 2021 compared to 2020 as some rate changes will reflect the decline in auto miles driven and lower expenses.
PIF decreased 0.5% or 104 thousand policies as of December 31, 2020 compared to December 31, 2019 as higher PIF in Allstate brand, with increases in 20 states, including 3 of our largest 10 states, was offset by lower PIF in Esurance brand as advertising resources are redirected to Allstate brand.
| | | | | | | | | | | | | | | | | | | | | | | | | | | | | | | | |
Homeowners premium measures and statistics | | | | |
| | 2020 | | 2019 | | 2018 | | 2020 vs. 2019 | | 2019 vs. 2018 |
| PIF (thousands) | | 6,427 | | | 6,359 | | | 6,281 | | | 1.1 | % | | 1.2 | % |
| New issued applications (thousands) | | 899 | | | 877 | | | 858 | | | 2.5 | % | | 2.2 | % |
| Average premium | | $ | 1,328 | | | $ | 1,291 | | | $ | 1,226 | | | 2.9 | % | | 5.3 | % |
| Renewal ratio (%) | | 87.5 | | | 88.2 | | | 88.0 | | | (0.7) | | | 0.2 | |
| | | | | | | | | | |
| | | | | | | | | | |
| | | | | | | | | | |
| Total brand rate changes (%) | | 2.7 | | | 3.3 | | | 2.7 | | | (0.6) | | | 0.6 | |
| | | | | | | | | | |
Homeowners insurance premiums written increased 3.2% or $248 million in 2020 compared to 2019, primarily due to higher average premiums, including rate changes and inflation in insured home valuations, and policy growth. Homeowners PIF increased 68 thousand policies with increases in 27 states, including 5 of our largest 10 states, as of December 31, 2020 compared to December 31, 2019.
Other personal lines premiums written increased 4.3% or $78 million in 2020 compared to 2019. The
increase in 2020 was primarily due to increases in condominium, personal umbrella and boat insurance premiums.
Commercial lines premiums written decreased 12.2%or $110 million in 2020 compared to 2019, primarily due to lower miles driven and utilization in our shared economy business related to the impacts of the Coronavirus. PIF for the shared economy agreements typically reflect contracts that cover multiple insureds as opposed to individual insureds.
Allstate Protection: Allstate brand 2020 Form 10-K
| | | | | | | | | | | | | | | | | | | | | | | | | | | | | | | | | | | | | | | | | | | | | | | | | | | | | | | | |
Combined ratios by line of business |
| | For the years ended December 31, |
| | Loss ratio | | Expense ratio (1) | | Combined ratio |
| | 2020 | | 2019 | | 2018 | | 2020 | | 2019 | | 2018 | | 2020 | | 2019 | | 2018 |
| Auto | | 57.5 | | | 68.3 | | | 66.8 | | | 28.4 | | | 24.6 | | | 25.3 | | | 85.9 | | | 92.9 | | | 92.1 | |
| Impact of Shelter-in-Place Payback expense | | — | | | — | | | — | | | 3.8 | | | — | | | — | | | 3.8 | | | — | | | — | |
| Homeowners | | 67.5 | | | 65.0 | | | 69.5 | | | 22.3 | | | 22.9 | | | 23.7 | | | 89.8 | | | 87.9 | | | 93.2 | |
| Other personal lines | | 58.8 | | | 60.7 | | | 66.3 | | | 27.3 | | | 26.6 | | | 27.4 | | | 86.1 | | | 87.3 | | | 93.7 | |
| Commercial lines | | 82.4 | | | 81.3 | | | 91.3 | | | 22.3 | | | 17.1 | | | 21.4 | | | 104.7 | | | 98.4 | | | 112.7 | |
| Impact of Shelter-in-Place Payback expense | | — | | | — | | | — | | | 0.5 | | | — | | | — | | | 0.5 | | | — | | | — | |
| | | | | | | | | | | | | | | | | | |
| Total | | 60.4 | | | 67.5 | | | 67.9 | | | 26.6 | | | 23.9 | | | 24.8 | | | 87.0 | | | 91.4 | | | 92.7 | |
Impact of restructuring and related charges (2) | | — | | | — | | | — | | | 0.7 | | | 0.1 | | | 0.2 | | | 0.7 | | | 0.1 | | | 0.2 | |
| Impact of Shelter-in-Place Payback expense | | — | | | — | | | — | | | 2.7 | | | — | | | — | | | 2.7 | | | — | | | — | |
Impact of Allstate Special Payment plan bad debt expense (3) | | — | | | — | | | — | | | 0.2 | | | — | | | — | | | 0.2 | | | — | | | — | |
(1) Other revenue is deducted from operating costs and expenses in the expense ratio calculation.
(2)Restructuring and related charges in 2020 primarily related to Transformative Growth.
(3)Relates to the Allstate Special Payment plan offered to customers as a result of the Coronavirus to provide more flexible payment options, including the option to delay payments. Approximately 70% of the higher bad debt expense was attributed to auto.
| | | | | | | | | | | | | | | | | | | | | | | | | | | | | | | | | | | | | | | | | | | | | | | | | | | | | | | | | | | | | | | | | | | | | | | | | | |
Loss ratios by line of business |
| | For the years ended December 31, |
| | Loss ratio | | Effect of catastrophe losses | | Effect of prior year reserve reestimates | | Effect of catastrophe losses included in prior year reserve reestimates (1) |
| | 2020 | | 2019 | | 2018 | | 2020 | | 2019 | | 2018 | | 2020 | | 2019 | | 2018 | | 2020 | | 2019 | | 2018 |
| Auto | | 57.5 | | | 68.3 | | | 66.8 | | | 1.2 | | | 1.7 | | | 1.6 | | | (0.5) | | | (1.3) | | | (2.0) | | | (0.2) | | | (0.1) | | | (0.2) | |
| Homeowners | | 67.5 | | | 65.0 | | | 69.5 | | | 28.2 | | | 24.8 | | | 30.5 | | | (5.1) | | | 0.7 | | | — | | | (4.9) | | | 0.7 | | | 0.8 | |
| Other personal lines | | 58.8 | | | 60.7 | | | 66.3 | | | 10.5 | | | 9.2 | | | 12.2 | | | (3.1) | | | 0.6 | | | 0.4 | | | (2.0) | | | 0.1 | | | (0.2) | |
| Commercial lines | | 82.4 | | | 81.3 | | | 91.3 | | | 3.5 | | | 1.4 | | | 3.4 | | | 4.7 | | | 1.9 | | | 16.5 | | | 0.2 | | | (0.1) | | | — | |
| | | | | | | | | | | | | | | | | | | | | | | | |
| Total | | 60.4 | | | 67.5 | | | 67.9 | | | 7.9 | | | 7.2 | | | 8.6 | | | (1.5) | | | (0.7) | | | (1.0) | | | (1.3) | | | 0.1 | | | — | |
(1) 2020 includes approximately $450 million of favorable reserve reestimates related to subrogation settlements, which primarily impacted homeowners. See Note 8 of the consolidated financial statements for additional details.
The Allstate Corporation 53
2020 Form 10-K Allstate Protection: Allstate brand
Frequency and severity statistics, which are influenced by driving patterns, inflation and other factors, are provided to describe the trends in loss costs. Our reserving process incorporates changes in loss patterns, operational statistics and changes in claims reporting processes to determine our best estimate of recorded reserves. We use the following statistics to evaluate losses:
| | |
• Gross claim frequency (1) is calculated as annualized notice counts received in the period divided by the average of PIF with the applicable coverage during the period. Gross claim frequency includes all actual notice counts, regardless of their current status (open or closed) or their ultimate disposition (closed with a payment or closed without payment). |
• Paid claim severity is calculated by dividing the sum of paid losses and loss expenses by claims closed with a payment during the period. |
• Percent change in frequency or severity statistics is calculated as the amount of increase or decrease in the paid or gross claim frequency or severity in the current period compared to the same period in the prior year divided by the prior year paid or gross claim frequency or severity. |
(1)Excludes counts associated with catastrophe events.
We have expanded our utilization of virtual claims processes in response to the Coronavirus. We are continuing to implement new technology and process improvements that provide continued loss cost accuracy, efficient processing and enhanced customer experiences that are simple, fast and produce high degrees of satisfaction.
•Digital Operating Centers handle auto physical damage claims countrywide utilizing our virtual estimation capabilities, which includes estimating damage with photos and video through the use of QuickFoto Claim® and Virtual Assist®.
•Virtual Assist and aerial imagery using satellites, airplanes and drones handle property claims by estimating damage through video.
These organizational and process changes impact frequency and severity statistics as changes in claim opening and closing practices and shifts in timing, if any, can impact comparisons to prior periods.
Auto loss ratio decreased 10.8 points in 2020 compared to 2019, primarily due to decline in non-catastrophe losses driven by favorable frequency, higher premiums earned and lower catastrophe losses, partially offset by increased severity and less favorable non-catastrophe prior year reserve reestimates compared to prior year.
| | | | | | | | |
| Auto property damage frequency and severity statistics |
| (% change year-over-year) | | For the year ended December 31, 2020 |
| Gross claim frequency | | (29.1) | % |
| Paid claim severity | | 10.0 | |
The impacts of the Coronavirus affect frequency and severity statistics including:
•Shelter-in-place restrictions, social distancing requirements, limits on large gatherings and events, and restrictions on non-essential businesses as these become more or less strict
•Unemployment levels
•Reduced commuting activity
•Paid claims settlement rates as the low frequency environment creates capacity to settle claims faster
•Driving behavior (e.g., speed, time of day) impacting mix of claim types
•Labor and part cost variability
•Changes in limits purchased
•Court system variability in both timing and magnitude of claim settlement
Property damage gross claim frequency decreased in 2020 compared to 2019 due to factors including:
•Declines in auto miles driven.
•Declines in gross claim frequency compared to the prior year moderated in the second half of 2020 from earlier in the year, reflecting an increase in miles driven compared to April and May 2020 as shelter-in-place restrictions were lifted in many states.
Property damage paid claim severity increased in 2020 compared to 2019 due to factors including:
•Claims settled within days or weeks of the loss tend to be less complex and have lower severity, while higher severity property damage claims generally take longer to resolve.
•The reduction in new claims due to lower frequency, as described above, led to an increase in the proportion of more complex, higher severity paid claims to total paid claims.
•Higher costs to repair more sophisticated newer model vehicles, higher third-party subrogation demands and increased costs associated with total losses.
Bodily injury gross claim frequency was consistent with trends noted in property damage. Bodily injury severity trends increased at a rate above medical care inflation indices in 2020.
Allstate Protection: Allstate brand 2020 Form 10-K
Homeowners loss ratio increased 2.5 points in 2020 compared to 2019, primarily due to higher catastrophe losses and increased claim severity, partially offset by favorable catastrophe reserve reestimates driven by subrogation settlements, increased premiums earned and improved claim frequency.
| | | | | | | | |
| Homeowners frequency and severity statistics (excluding catastrophe losses) |
| (% change year-over-year) | | For the year ended December 31, 2020 |
| Gross claim frequency | | (4.0) | % |
| Paid claim severity | | 7.1 | |
Gross claim frequency excluding catastrophe losses decreased in 2020 compared to 2019 due to decreases in water and theft claims, partially offset by increases in fire and wind/hail. Paid claim severity excluding catastrophe losses increased in 2020 compared to 2019 as we experienced increased claim
severity in wind/hail and fire perils. Homeowner paid claim severity can be impacted by both the mix of perils and the magnitude of specific losses paid during the year.
Other personal lines loss ratio decreased 1.9 points in 2020 compared to 2019, primarily due to increased premiums earned, favorable catastrophe reserve reestimates driven by the subrogation settlements and favorable non-catastrophe reserve reestimates, partially offset by higher catastrophe losses.
Commercial lines loss ratio increased 1.1 points in 2020 compared to 2019, primarily due to decreased premiums earned, higher claim severity and higher losses related to an underperforming account that was not renewed, partially offset by a decline in non-catastrophe losses driven by favorable auto frequency related to the Coronavirus.
| | | | | | | | | | | | | | | | | | | | |
Impact of specific costs and expenses on the expense ratio |
| | For the years ended December 31, |
| | 2020 | | 2019 | | 2018 |
Amortization of DAC (1) | | 12.9 | | | 13.2 | | | 13.4 | |
| Advertising expense | | 2.7 | | | 2.5 | | | 2.5 | |
| | | | | | |
| Other costs and expenses | | 7.4 | | | 7.9 | | | 8.7 | |
| Subtotal | | 23.0 | | | 23.6 | | | 24.6 | |
Restructuring and related charges (2) | | 0.7 | | | 0.1 | | | 0.2 | |
| Impairment of purchased intangibles | | — | | | 0.2 | | | — | |
| Shelter-in-Place Payback expense | | 2.7 | | | — | | | — | |
| Allstate Special Payment plan bad debt expense | | 0.2 | | | — | | | — | |
| Total expense ratio | | 26.6 | | | 23.9 | | | 24.8 | |
(1) Primarily includes agent compensation and premium taxes.
(2)Restructuring and related charges in 2020 primarily related to Transformative Growth.
Expense ratio increased 2.7 points in 2020 compared to 2019, reflecting Shelter-in-Place Payback expense, higher restructuring charges related to Transformative Growth and bad debt expense. Excluding Shelter-in-Place Payback expense, higher restructuring charges related to Transformative Growth, bad debt expense and impairment of purchased intangibles in 2019, the expense ratio decreased 0.7 points in 2020 compared to 2019, primarily due to lower operating expenses and agent compensation, partially offset by an increase in advertising costs.
The Allstate Corporation 55
2020 Form 10-K Allstate Protection: Encompass brand
Encompass products are sold through independent agents that serve brand-neutral customers who prefer personal service and support from an independent agent. In 2020, the Encompass brand represented 2.7% of the Allstate Protection segment’s written premium. For additional information on our strategy and outlook, see Part I, Item 1. Business - Strategy and Segment Information.
| | | | | | | | | | | | | | | | | | | | |
Underwriting results |
| | For the years ended December 31, |
| ($ in millions) | | 2020 | | 2019 | | 2018 |
| Premiums written | | $ | 972 | | | $ | 1,020 | | | $ | 1,016 | |
| Premiums earned | | $ | 999 | | | $ | 1,018 | | | $ | 1,023 | |
| Other revenue | | 5 | | | 5 | | | 5 | |
| Claims and claims expense | | (588) | | | (689) | | | (668) | |
| Shelter-in-Place Payback expense | | (21) | | | — | | | — | |
| Amortization of DAC | | (191) | | | (192) | | | (190) | |
| Other costs and expenses | | (123) | | | (131) | | | (145) | |
| Restructuring and related charges | | (6) | | | (4) | | | (7) | |
| Underwriting income | | $ | 75 | | | $ | 7 | | | $ | 18 | |
| Catastrophe losses | | $ | 95 | | | $ | 115 | | | $ | 102 | |
| | | | | | |
Underwriting income (loss) by line of business | | | | | | |
| Auto | | $ | 40 | | | $ | 8 | | | $ | 14 | |
| Homeowners | | 26 | | | 2 | | | 1 | |
| Other personal lines | | 9 | | | (3) | | | 3 | |
| Underwriting income | | $ | 75 | | | $ | 7 | | | $ | 18 | |
Underwriting income increased $68 million in 2020 compared to 2019, primarily due to lower auto and homeowners non-catastrophe losses and favorable catastrophe reserve reestimates in personal lines homeowners driven by subrogation settlements, partially offset by higher catastrophe losses and Shelter-in-Place Payback expense.
Allstate Protection: Encompass brand 2020 Form 10-K
| | | | | | | | | | | | | | | | | | | | |
Premiums written and earned by line of business |
| | For the years ended December 31, |
| ($ in millions) | | 2020 | | 2019 | | 2018 |
| Premiums written | | | | | | |
| Auto | | $ | 508 | | | $ | 540 | | | $ | 537 | |
| Homeowners | | 388 | | | 401 | | | 398 | |
| Other personal lines | | 76 | | | 79 | | | 81 | |
| Total | | $ | 972 | | | $ | 1,020 | | | $ | 1,016 | |
| Premiums earned | | | | | | |
| Auto | | $ | 525 | | | $ | 539 | | | $ | 537 | |
| Homeowners | | 396 | | | 399 | | | 402 | |
| Other personal lines | | 78 | | | 80 | | | 84 | |
| Total | | $ | 999 | | | $ | 1,018 | | | $ | 1,023 | |
| | | | | | | | | | | | | | | | | | | | | | | | | | | | | | | | |
Auto premium measures and statistics |
| | 2020 | | 2019 | | 2018 | | 2020 vs. 2019 | | 2019 vs. 2018 |
| PIF (thousands) | | 451 | | | 493 | | | 502 | | | (8.5) | % | | (1.8) | % |
| New issued applications (thousands) | | 60 | | | 82 | | | 76 | | | (26.8) | % | | 7.9 | % |
| Average premium | | $ | 1,156 | | | $ | 1,134 | | | $ | 1,118 | | | 1.9 | % | | 1.4 | % |
| Renewal ratio (%) | | 76.8 | | | 78.1 | | | 74.9 | | | (1.3) | | | 3.2 | |
| Total brand rate changes (%) | | (0.4) | | | 1.5 | | | 2.4 | | | (1.9) | | | (0.9) | |
Auto insurance premiums written decreased 5.9% or $32 million in 2020 compared to 2019, primarily due to decreased new issued applications and lower retention, partially offset by higher average premiums, with the top 10 states representing approximately 70% of premiums written.
| | | | | | | | | | | | | | | | | | | | | | | | | | | | | | | | |
Homeowners premium measure and statistics |
| | 2020 | | 2019 | | 2018 | | 2020 vs. 2019 | | 2019 vs. 2018 |
| PIF (thousands) | | 216 | | | 234 | | | 239 | | | (7.7) | % | | (2.1) | % |
| New issued applications (thousands) | | 34 | | | 42 | | | 37 | | | (19.0) | % | | 13.5 | % |
| Average premium | | $ | 1,892 | | | $ | 1,795 | | | $ | 1,724 | | | 5.4 | % | | 4.1 | % |
| Renewal ratio (%) | | 81.0 | | | 82.5 | | | 80.0 | | | (1.5) | | | 2.5 | |
| Total brand rate changes (%) | | 4.8 | | | 9.2 | | | 4.7 | | | (4.4) | | | 4.5 | |
Homeowners insurance premiums written decreased 3.2% or $13 million in 2020 compared to 2019, primarily due to decreased new issued applications and lower retention, partially offset by higher average premiums due to rate changes over the past 12 months, with the top 10 states representing approximately 70% of premiums written.
| | | | | | | | | | | | | | | | | | | | | | | | | | | | | | | | | | | | | | | | | | | | | | | | | | | | | | | | |
Combined ratios by line of business |
| | For the years ended December 31, |
| | Loss ratio | | Expense ratio (1) | | Combined ratio |
| | 2020 | | 2019 | | 2018 | | 2020 | | 2019 | | 2018 | | 2020 | | 2019 | | 2018 |
| Auto | | 56.8 | | | 66.8 | | | 65.0 | | | 35.6 | | | 31.7 | | | 32.4 | | | 92.4 | | | 98.5 | | | 97.4 | |
| Impact of Shelter-in-Place Payback expense | | — | | | — | | | — | | | 4.0 | | | — | | | — | | | 4.0 | | | — | | | — | |
| Homeowners | | 62.1 | | | 68.2 | | | 66.7 | | | 31.3 | | | 31.3 | | | 33.1 | | | 93.4 | | | 99.5 | | | 99.8 | |
| Other personal lines | | 56.4 | | | 71.3 | | | 60.7 | | | 32.1 | | | 32.5 | | | 35.7 | | | 88.5 | | | 103.8 | | | 96.4 | |
| Total | | 58.9 | | | 67.7 | | | 65.3 | | | 33.6 | | | 31.6 | | | 32.9 | | | 92.5 | | | 99.3 | | | 98.2 | |
Impact of restructuring and related charges (2) | | — | | | — | | | — | | | 0.6 | | | 0.4 | | | 0.7 | | | 0.6 | | | 0.4 | | | 0.7 | |
| Impact of Shelter-in-Place Payback expense | | — | | | — | | | — | | | 2.1 | | | — | | | — | | | 2.1 | | | — | | | — | |
(1)Other revenue is deducted from operating costs and expenses in the expense ratio calculation.
(2)Restructuring and related charges in 2020 primarily related to Transformative Growth.
The Allstate Corporation 57
2020 Form 10-K Allstate Protection: Encompass brand
| | | | | | | | | | | | | | | | | | | | | | | | | | | | | | | | | | | | | | | | | | | | | | | | | | | | | | | | | | | | | | | | | | | | | | | | | | |
Loss ratios by line of business |
| | For the years ended December 31, |
| | Loss ratio | | Effect of catastrophe losses | | Effect of prior year reserve reestimates | | Effect of catastrophe losses included in prior year reserve reestimates (1) |
| | 2020 | | 2019 | | 2018 | | 2020 | | 2019 | | 2018 | | 2020 | | 2019 | | 2018 | | 2020 | | 2019 | | 2018 |
| Auto | | 56.8 | | | 66.8 | | | 65.0 | | | 1.3 | | | 1.9 | | | 1.1 | | | 1.0 | | | (1.9) | | | (1.9) | | | (0.4) | | | — | | | (0.2) | |
| Homeowners | | 62.1 | | | 68.2 | | | 66.7 | | | 20.7 | | | 25.1 | | | 22.1 | | | (9.3) | | | 3.7 | | | 3.3 | | | (9.8) | | | 2.5 | | | 3.0 | |
| Other personal lines | | 56.4 | | | 71.3 | | | 60.7 | | | 7.7 | | | 6.3 | | | 8.3 | | | (12.8) | | | (2.5) | | | (16.7) | | | (2.6) | | | (1.2) | | | 1.2 | |
| Total | | 58.9 | | | 67.7 | | | 65.3 | | | 9.5 | | | 11.3 | | | 10.0 | | | (4.2) | | | 0.3 | | | (1.1) | | | (4.3) | | | 0.9 | | | 1.2 | |
(1)2020 includes approximately $45 million of favorable reserve reestimates related to subrogation settlements, which primarily impacted homeowners. See Note 8 of the consolidated financial statements for additional details.
Auto loss ratio decreased 10.0 points in 2020 compared to 2019, primarily due to lower claim frequency, partially offset by increased claim severity and unfavorable non-catastrophe reserves reestimates compared to favorable non-catastrophe reserve reestimates in the prior year.
Homeowners loss ratio decreased 6.1 points in 2020 compared to 2019, primarily due to favorable catastrophe reserve reestimates driven by subrogation settlements and lower non-catastrophe claim frequency, partially offset by higher catastrophe losses.
| | | | | | | | | | | | | | | | | | | | |
Impact of specific costs and expenses on the expense ratio |
| | For the years ended December 31, |
| | 2020 | | 2019 | | 2018 |
| Amortization of DAC | | 19.1 | | | 18.8 | | | 18.5 | |
| Advertising expense | | 0.1 | | | 0.2 | | | 0.2 | |
| | | | | | |
| Other costs and expenses | | 11.7 | | | 12.2 | | | 13.5 | |
| Subtotal | | 30.9 | | | 31.2 | | | 32.2 | |
Restructuring and related charges (1) | | 0.6 | | | 0.4 | | | 0.7 | |
| Shelter-in-Place Payback expense | | 2.1 | | | — | | | — | |
| Total expense ratio | | 33.6 | | | 31.6 | | | 32.9 | |
(1)Restructuring and related charges in 2020 primarily related to the Transformative Growth.
Expense ratio increased 2.0 points in 2020 compared to 2019, primarily due to Shelter-in-Place Payback expense and higher restructuring charges related to Transformative Growth, partially offset by lower operating costs.
Discontinued Lines and Coverages 2020 Form 10-K
Discontinued Lines and Coverages Segment
The Discontinued Lines and Coverages segment includes results from property and casualty insurance coverage that primarily relates to policies written during the 1960s through the mid-1980s. Our exposure to asbestos, environmental and other discontinued lines claims arises principally from direct excess commercial insurance, assumed reinsurance coverage, direct primary commercial insurance and other businesses in run-off. For additional information on our strategy and outlook, see Part I, Item 1. Business - Strategy and Segment Information.
| | | | | | | | | | | | | | | | | | | | |
| Underwriting results |
| | For the years ended December 31, |
| ($ in millions) | | 2020 | | 2019 | | 2018 |
| Claims and claims expense | | | | | | |
| Asbestos claims | | $ | (78) | | | $ | (28) | | | $ | (44) | |
| Environmental claims | | (44) | | | (36) | | | (20) | |
| Other discontinued lines | | (19) | | | (41) | | | (23) | |
| Total claims and claims expense | | (141) | | | (105) | | | (87) | |
| Operating costs and expenses | | (3) | | | (3) | | | (3) | |
| Underwriting loss | | $ | (144) | | | $ | (108) | | | $ | (90) | |
Underwriting losses in 2020 and 2019 primarily related to our annual reserve review using established industry and actuarial best practices. The annual review resulted in unfavorable reserve reestimates totaling $132 million and $95 million, in 2020 and 2019, net of $1 million and $6 million reduction in the allowance for future uncollectible reinsurance, respectively. The reserve reestimates are included as part of claims and claims expense.
Reserve reestimates in 2020 primarily related to new reported information, court decisions and policy buyback settlements for asbestos exposures and higher than expected reported losses for environmental and other discontinued lines exposures. Reserve reestimates in 2019 primarily related to new reported information and settlement agreements, including bankruptcy proceedings, impacting asbestos and other discontinued lines and additional environmental clean-up sites.
We believe that our reserves are appropriately established based on available facts, technology, laws, regulations, and assessments of other pertinent factors and characteristics of exposure (e.g., claim activity, potential liability, jurisdiction, products versus non-products exposure) presented by individual policyholders, assuming no change in the legal, legislative or economic environment. However, as we progress with the resolution of disputed claims in the courts and arbitrations and with negotiations and settlements, our reported losses may be more variable.
| | | | | | | | | | | | | | |
| Reserves for asbestos, environmental and other discontinued lines claims before and after the effects of reinsurance |
| ($ in millions) | | December 31, 2020 | | December 31, 2019 |
| Asbestos claims | | | | |
| Gross reserves | | $ | 1,204 | | | $ | 1,172 | |
| Reinsurance | | (377) | | | (362) | |
| Net reserves | | 827 | | | 810 | |
| Environmental claims | | | | |
| Gross reserves | | 249 | | | 219 | |
| Reinsurance | | (43) | | | (40) | |
| Net reserves | | 206 | | | 179 | |
| Other discontinued lines | | | | |
| Gross reserves | | 435 | | | 427 | |
| Reinsurance | | (60) | | | (51) | |
| Net reserves | | 375 | | | 376 | |
| Total | | | | |
Gross reserves | | 1,888 | | | 1,818 | |
Reinsurance | | (480) | | | (453) | |
| Net reserves | | $ | 1,408 | | | $ | 1,365 | |
The Allstate Corporation 59
2020 Form 10-K Discontinued Lines and Coverages
| | | | | | | | | | | | | | |
Reserves by type of exposure before and after the effects of reinsurance |
| ($ in millions) | | December 31, 2020 | | December 31, 2019 |
| Direct excess commercial insurance | | | | |
Gross reserves | | $ | 1,011 | | | $ | 948 | |
| Reinsurance | | (358) | | | (332) | |
| Net reserves | | 653 | | | 616 | |
| Assumed reinsurance coverage | | | | |
Gross reserves | | 636 | | | 606 | |
| Reinsurance | | (58) | | | (53) | |
| Net reserves | | 578 | | | 553 | |
| Direct primary commercial insurance | | | | |
| Gross reserves | | 160 | | | 169 | |
| Reinsurance | | (63) | | | (54) | |
| Net reserves | | 97 | | | 115 | |
| Other run-off business | | | | |
| Gross reserves | | 2 | | | 15 | |
| Reinsurance | | — | | | (13) | |
| Net reserves | | 2 | | | 2 | |
| Unallocated loss adjustment expenses | | | | |
| Gross reserves | | 79 | | | 80 | |
| Reinsurance | | (1) | | | (1) | |
| Net reserves | | 78 | | | 79 | |
| Total | | | | |
| Gross reserves | | 1,888 | | | 1,818 | |
| Reinsurance | | (480) | | | (453) | |
| Net reserves | | $ | 1,408 | | | $ | 1,365 | |
| | | | | | | | | | | | | | | | | | | | | | | | | | |
Percentage of gross and ceded reserves by case and incurred but not reported (“IBNR”) |
| | December 31, 2020 | | December 31, 2019 |
| | Case | | IBNR | | Case | | IBNR |
| Direct excess commercial insurance | | | | | | | | |
Gross reserves (1) | | 65 | % | | 35 | % | | 68 | % | | 32 | % |
Ceded (2) | | 71 | | | 29 | | | 78 | | | 22 | |
| Assumed reinsurance coverage | | | | | | | | |
Gross reserves | | 34 | | | 66 | | | 34 | | | 66 | |
| Ceded | | 35 | | | 65 | | | 35 | | | 65 | |
| Direct primary commercial insurance | | | | | | | | |
| Gross reserves | | 55 | | | 45 | | | 56 | | | 44 | |
| Ceded | | 79 | | | 21 | | | 78 | | | 22 | |
(1)Approximately 67% of gross case reserves as of December 31, 2020 are subject to settlement agreements.
(2)Approximately 75% of ceded case reserves as of December 31, 2020 are subject to settlement agreements.
| | | | | | | | | | | | | | |
Gross payments from case reserves by type of exposure |
| ($ in millions) | | For the years ended December 31, |
| 2020 | | 2019 |
| Direct excess commercial insurance | | | | |
Gross (1) | | $ | 88 | | | $ | 122 | |
Ceded (2) | | (37) | | | (53) | |
| Assumed reinsurance coverage | | | | |
Gross | | 40 | | | 43 | |
| Ceded | | (7) | | | (3) | |
| Direct primary commercial insurance | | | | |
| Gross | | 8 | | | 15 | |
| Ceded | | (5) | | | (2) | |
(1) In 2020 77% of payments related to settlement agreements.
(2) In 2020 75% of payments related to settlement agreements.
Discontinued Lines and Coverages 2020 Form 10-K
Total net reserves as of December 31, 2020, included $695 million or 49% of estimated IBNR reserves compared to $660 million or 48% of estimated IBNR reserves as of December 31, 2019.
Total gross payments were $137 million and $183 million for 2020 and 2019, respectively, primarily related to settlement agreements reached with several insureds on large claims, mainly asbestos related losses, where the scope of coverages has been agreed upon. The claims associated with these settlement agreements are expected to be substantially paid out
over the next several years as qualified claims are submitted by these insureds.
Reinsurance collections were $53 million and $49 million for 2020 and 2019, respectively. The allowance for uncollectible reinsurance recoverables was $59 million and $60 million as of December 31, 2020 and December 31, 2019, respectively. The allowance represents 10.5% and 11.1% of the related reinsurance recoverable balances as of December 31, 2020 and December 31, 2019, respectively.
The Allstate Corporation 61
2020 Form 10-K Protection Services
Protection Services Segment
Protection Services comprise Allstate Protection Plans, Allstate Dealer Services, Allstate Roadside, Arity and Allstate Identity Protection. In 2020, Protection Services represented 4.3% of total revenue, 77.5% of total PIF and 3.3% of total adjusted net income. We offer consumer product protection plans, finance and insurance products (including vehicle service contracts, guaranteed asset protection waivers, road hazard tire and wheel and paintless dent repair protection), roadside assistance, device and mobile data collection services and analytic solutions using automotive telematics information and identity protection. For additional information on our strategy and outlook, see Part I, Item 1. Business - Strategy and Segment Information.
| | | | | | | | | | | | | | | | | | | | |
Summarized financial information |
| | For the years ended December 31, |
| ($ in millions) | | 2020 | | 2019 | | 2018 |
| Premiums written | | $ | 1,890 | | | $ | 1,535 | | | $ | 1,431 | |
| | | | | | |
| Revenues | | | | | | |
| Premiums | | $ | 1,493 | | | $ | 1,233 | | | $ | 1,098 | |
| Other revenue | | 208 | | | 188 | | | 82 | |
Intersegment insurance premiums and service fees (1) | | 147 | | | 154 | | | 122 | |
| Net investment income | | 44 | | | 42 | | | 27 | |
| Realized capital gains (losses) | | 30 | | | 32 | | | (11) | |
| Total revenues | | 1,922 | | | 1,649 | | | 1,318 | |
| | | | | | |
| Costs and expenses | | | | | | |
| Claims and claims expense | | (386) | | | (363) | | | (350) | |
| Amortization of DAC | | (658) | | | (543) | | | (463) | |
| Operating costs and expenses | | (651) | | | (661) | | | (505) | |
| Restructuring and related charges | | (3) | | | — | | | (4) | |
| Amortization of purchased intangibles | | (106) | | | (122) | | | (94) | |
| Impairment of purchased intangibles | | — | | | (55) | | | — | |
| Total costs and expenses | | (1,804) | | | (1,744) | | | (1,416) | |
| | | | | | |
| | | | | | |
| Income tax (expense) benefit | | (26) | | | 18 | | | 19 | |
| Net income (loss) applicable to common shareholders | | $ | 92 | | | $ | (77) | | | $ | (79) | |
| | | | | | |
| Adjusted net income | | $ | 153 | | | $ | 38 | | | $ | 8 | |
| Realized capital gains (losses), after-tax | | 23 | | | 25 | | | (9) | |
| Amortization of purchased intangibles, after-tax | | (84) | | | (97) | | | (74) | |
| Impairment of purchased intangibles, after-tax | | — | | | (43) | | | — | |
| Tax Legislation (expense) benefit | | — | | | — | | | (4) | |
| Net income (loss) applicable to common shareholders | | $ | 92 | | | $ | (77) | | | $ | (79) | |
| | | | | | |
| Allstate Protection Plans | | $ | 137 | | | $ | 60 | | | $ | 23 | |
| Allstate Dealer Services | | 29 | | | 26 | | | 15 | |
| Allstate Roadside | | 12 | | | (15) | | | (20) | |
| Arity | | (11) | | | (7) | | | (11) | |
| Allstate Identity Protection | | (14) | | | (26) | | | 1 | |
| Adjusted net income | | $ | 153 | | | $ | 38 | | | $ | 8 | |
| | | | | | |
| Allstate Protection Plans | | 128,982 | | | 99,632 | | | 68,588 | |
| Allstate Dealer Services | | 4,042 | | | 4,205 | | | 4,338 | |
| Allstate Roadside | | 548 | | | 599 | | | 663 | |
| Allstate Identity Protection | | 2,700 | | | 1,511 | | | 1,040 | |
| Policies in force as of December 31 (in thousands) | | 136,272 | | | 105,947 | | | 74,629 | |
(1)Primarily related to Arity and Allstate Roadside and are eliminated in our consolidated financial statements.
Protection Services 2020 Form 10-K
Net income applicable to common shareholders was $92 million in 2020 compared to net loss of $77 million in 2019. 2019 results included a $55 million intangible asset impairment related to the SquareTrade trade name that occurred in the second quarter of 2019.
Adjusted net income increased $115 million in 2020 compared to 2019. The increase in 2020 was primarily due to growth of Allstate Protection Plans and improved profitability at Allstate Roadside, partially offset by investments at Allstate Identity Protection.
Total revenues increased 16.6% or $273 million in 2020 compared to 2019, primarily due to Allstate Protection Plan’s growth through its U.S. retail and international channels, partially offset by declines in revenue at Allstate Roadside.
Premiums written increased 23.1% or $355 million in 2020 compared to 2019, primarily due to growth at Allstate Protection Plans benefiting from higher consumer purchases. In late 2020, Allstate Protection Plans launched several new U.S. retailers and was awarded new business for launch in early 2021, which will result in additional premiums written in 2021.
PIF increased 28.6% or 30 million in 2020 compared to 2019 due to continued growth at Allstate Protection Plans.
Intersegment premiums and service fees decreased 4.5% or $7 million in 2020 compared to 2019, primarily related to decreased device sales through Arity’s device and mobile data collection services and analytic solutions.
Other revenue increased 10.6% or $20 million in 2020 compared to 2019, primarily due to increased sales at Allstate Identity Protection.
Claims and claims expense increased 6.3% or $23 million in 2020 compared to 2019, primarily due to higher levels of claims at Allstate Protection Plans driven by growth of the business, partially offset by lower losses at Allstate Roadside and Allstate Dealer Services due to declines in auto miles driven related to the Coronavirus.
Amortization of DAC increased 21.2% or $115 million in 2020 compared to 2019. The increase is driven by growth at Allstate Protection Plans.
Operating costs and expenses decreased 1.5% or $10 million in 2020 compared to 2019, primarily due to lower operating costs at Allstate Roadside, partially offset by expenses associated with continued growth at Allstate Protection Plans.
Amortization of purchased intangibles relates to the acquisitions of Allstate Protection Plans and Allstate Identity Protection. We recorded amortization expense of $106 million in 2020 compared to $122 million in 2019.
The Allstate Corporation 63
2020 Form 10-K Claims and Claims Expense Reserves
Claims and Claims Expense Reserves
Underwriting results are significantly influenced by estimates of claims and claims expense reserves. For a description of our reserve process, see Note 8 of the consolidated financial statements. Further, for a description of our reserving policies and the potential variability in our reserve estimates, see the Application of Critical Accounting Estimates section of the MD&A. These reserves are an estimate of amounts necessary to settle all outstanding claims, including IBNR claims, as of the reporting date.
The facts and circumstances leading to reestimates of reserves relate to changes in claim activity and revisions to the development factors used to predict how losses are likely to develop from the end of a reporting period until all claims have been paid. Reestimates occur when actual losses differ from those predicted by the estimated development factors used in prior reserve estimates.
We believe the net loss reserves exposures are appropriately established based on available facts, technology, laws and regulations.
| | | | | | | | | | | | | | | | | | | | |
Total reserves, net of recoverables (“net reserves”), as of December 31, by line of business |
| ($ in millions) | | 2020 | | 2019 | | 2018 |
| Allstate brand | | $ | 18,523 | | | $ | 18,750 | | | $ | 18,134 | |
| Encompass brand | | 613 | | | 646 | | | 691 | |
| Total Allstate Protection | | 19,136 | | | 19,396 | | | 18,825 | |
| Discontinued Lines and Coverages | | 1,408 | | | 1,365 | | | 1,391 | |
| Total Property-Liability | | 20,544 | | | 20,761 | | | 20,216 | |
Protection Services | | 33 | | | 39 | | | 52 | |
| Total net reserves | | $ | 20,577 | | | $ | 20,800 | | | $ | 20,268 | |
The year-end 2020 gross reserves of $27.61 billion for insurance claims and claims expense were $8.48 billion more than the net reserve balance of $19.13 billion recorded on the basis of statutory accounting practices for reports provided to state regulatory authorities. The principal differences are recoverables from third parties totaling $7.03 billion, including $5.61 billion of indemnification recoverables related to the Michigan Catastrophic Claims Association (“MCCA”), that reduce reserves for statutory reporting, but are recorded as assets for GAAP reporting, and a liability for the reserves of the Canadian subsidiaries for $1.35 billion that are a component of our consolidated reserves, but not included in our U.S. statutory reserves.
| | | | | | | | | | | | | | | | | | | | | | | | | | | | | | | | | | | | | | |
Impact of reserve reestimates by brand on combined ratio and net income applicable to common shareholders(1) (2) |
| | 2020 | | 2019 | | 2018 |
| ($ in millions, except ratios) | | Reserve reestimate | | Effect on combined ratio | | Reserve reestimate | | Effect on combined ratio | | Reserve reestimate | | Effect on combined ratio |
| Allstate brand | | $ | (534) | | | (1.5) | | | $ | (236) | | | (0.7) | | | $ | (329) | | | (1.0) | |
| Encompass brand | | (42) | | | (0.1) | | | 3 | | | — | | | (11) | | | — | |
| Total Allstate Protection | | (576) | | | (1.6) | | | (233) | | | (0.7) | | | (340) | | | (1.0) | |
| Discontinued Lines and Coverages | | 141 | | | 0.4 | | | 105 | | | 0.4 | | | 87 | | | 0.3 | |
| Total Property-Liability | | (435) | | | (1.2) | | | (128) | | | (0.3) | | | (253) | | | (0.7) | |
Protection Services | | (1) | | | — | | | (2) | | | — | | | (2) | | | — | |
| Total | | $ | (436) | | | | | $ | (130) | | | | | $ | (255) | | | |
| Reserve reestimates, after-tax | | $ | (344) | | | | | $ | (103) | | | | | $ | (201) | | | |
| Consolidated net income applicable to common shareholders | | $ | 5,461 | | | | | $ | 4,678 | | | | | $ | 2,012 | | | |
| Reserve reestimates as a % impact on consolidated net income applicable to common shareholders | | 6.3 | % | | | | 2.2 | % | | | | 10.0 | % | | |
| Property-Liability prior year reserve reestimates included in catastrophe losses | | $ | (503) | | | | | $ | 48 | | | | | $ | 25 | | | |
(1)Favorable reserve reestimates are shown in parentheses.
(2)Ratios are calculated using property and casualty premiums earned.
Claims and Claims Expense Reserves 2020 Form 10-K
The following tables reflect the accident years to which the reestimates shown above are applicable. Favorable reserve reestimates are shown in parentheses.
| | | | | | | | | | | | | | | | | | | | | | | | | | | | | | | | | | | | | | | | | | | | | | | | |
| 2020 prior year reserve reestimates |
| ($ in millions) | | | | | | | | | | | | 2015 & prior | | 2016 | | 2017 | | 2018 | | 2019 | | Total |
| Allstate brand | | | | | | | | | | | | $ | (58) | | | $ | 46 | | | $ | (162) | | | $ | (348) | | | $ | (12) | | | $ | (534) | |
| Encompass brand | | | | | | | | | | | | 2 | | | (4) | | | (37) | | | (5) | | | 2 | | | (42) | |
| Total Allstate Protection | | | | | | | | | | | | (56) | | | 42 | | | (199) | | | (353) | | | (10) | | | (576) | |
| Discontinued Lines and Coverages | | | | | | | | | | | | 141 | | | — | | | — | | | — | | | — | | | 141 | |
| Total Property-Liability | | | | | | | | | | | | 85 | | | 42 | | | (199) | | | (353) | | | (10) | | | (435) | |
Protection Services | | | | | | | | | | | | — | | | — | | | — | | | — | | | (1) | | | (1) | |
| Total | | | | | | | | | | | | $ | 85 | | | $ | 42 | | | $ | (199) | | | $ | (353) | | | $ | (11) | | | $ | (436) | |
| | | | | | | | | | | | | | | | | | | | | | | | | | | | | | | | | | | | | | |
| 2019 prior year reserve reestimates |
| ($ in millions) | | 2014 & prior | | 2015 | | 2016 | | 2017 | | 2018 | | Total |
| Allstate brand | | $ | (138) | | | $ | (46) | | | $ | (26) | | | $ | (99) | | | $ | 73 | | | $ | (236) | |
| Encompass brand | | (2) | | | 2 | | | (2) | | | 4 | | | 1 | | | 3 | |
| Total Allstate Protection | | (140) | | | (44) | | | (28) | | | (95) | | | 74 | | | (233) | |
| Discontinued Lines and Coverages | | 105 | | | — | | | — | | | — | | | — | | | 105 | |
| Total Property-Liability | | (35) | | | (44) | | | (28) | | | (95) | | | 74 | | | (128) | |
Protection Services | | — | | | — | | | — | | | — | | | (2) | | | (2) | |
| Total | | $ | (35) | | | $ | (44) | | | $ | (28) | | | $ | (95) | | | $ | 72 | | | $ | (130) | |
| | | | | | | | | | | | | | | | | | | | | | | | | | | | | | | | | | | | | | |
| 2018 prior year reserve reestimates |
| ($ in millions) | | 2013 & prior | | 2014 | | 2015 | | 2016 | | 2017 | | Total |
| Allstate brand | | $ | (66) | | | $ | (56) | | | $ | (16) | | | $ | (133) | | | $ | (58) | | | $ | (329) | |
| Encompass brand | | (12) | | | (11) | | | (15) | | | 1 | | | 26 | | | (11) | |
| Total Allstate Protection | | (78) | | | (67) | | | (31) | | | (132) | | | (32) | | | (340) | |
| Discontinued Lines and Coverages | | 87 | | | — | | | — | | | — | | | — | | | 87 | |
| Total Property-Liability | | 9 | | | (67) | | | (31) | | | (132) | | | (32) | | | (253) | |
Protection Services | | — | | | — | | | — | | | — | | | (2) | | | (2) | |
| Total | | $ | 9 | | | $ | (67) | | | $ | (31) | | | $ | (132) | | | $ | (34) | | | $ | (255) | |
Allstate Protection
The tables below show Allstate Protection net reserves representing the estimated cost of outstanding claims as they were recorded at the beginning of years 2020, 2019, and 2018, and the effect of reestimates in each year.
| | | | | | | | | | | | | | | | | | | | |
Net reserves by line |
| | January 1 reserves |
| ($ in millions) | | 2020 | | 2019 | | 2018 |
| Auto | | $ | 14,728 | | | $ | 14,378 | | | $ | 14,051 | |
| Homeowners | | 2,138 | | | 2,157 | | | 2,205 | |
| Other personal lines | | 1,459 | | | 1,489 | | | 1,489 | |
| Commercial lines | | 1,071 | | | 801 | | | 616 | |
| Total Allstate Protection | | $ | 19,396 | | | $ | 18,825 | | | $ | 18,361 | |
| | | | | | | | | | | | | | | | | | | | | | | | | | | | | | | | | | | | | | |
Impact of reserve reestimates by line on combined ratio and underwriting income |
| | 2020 | | 2019 | | 2018 |
| ($ in millions, except ratios) | | Reserve reestimate | | Effect on combined ratio | | Reserve reestimate | | Effect on combined ratio | | Reserve reestimate | | Effect on combined ratio |
| Auto | | $ | (107) | | | (0.3) | | | $ | (323) | | | (0.9) | | | $ | (455) | | | (1.3) | |
| Homeowners | | (439) | | | (1.2) | | | 65 | | | 0.2 | | | 14 | | | — | |
| Other personal lines | | (66) | | | (0.2) | | | 8 | | | — | | | (7) | | | — | |
| Commercial lines | | 36 | | | 0.1 | | | 17 | | | — | | | 108 | | | 0.3 | |
| | | | | | | | | | | | |
| Total Allstate Protection | | $ | (576) | | | (1.6) | | | $ | (233) | | | (0.7) | | | $ | (340) | | | (1.0) | |
| Underwriting income | | $ | 4,566 | | | | | $ | 2,912 | | | | | $ | 2,343 | | | |
| Reserve reestimates as a % impact on underwriting income | | 12.6 | % | | | | 8.0 | % | | | | 14.5 | % | | |
The Allstate Corporation 65
2020 Form 10-K Claims and Claims Expense Reserves
Favorable results for homeowners lines in 2020 were primarily due to catastrophe reserve reestimates driven by the subrogation settlements. Favorable reserve reestimates for auto in 2020 primarily related to favorable non-catastrophe reserve reestimates in personal lines auto, partially offset by strengthening in commercial lines auto reserves.
Favorable reserve reestimates for auto in 2019 primarily related to continued favorable personal lines auto injury coverage development, offset by strengthening in our homeowners lines. Auto liability claims process changes implemented in prior years, including a program requiring enhanced documentation of injuries and related medical treatments, resulted in favorable severity trends compared to those originally estimated as we developed greater experience in settling claims under these programs. Unfavorable results for homeowners lines in 2019 were primarily due to catastrophe development being higher than anticipated in previous estimates.
Estimating the ultimate cost of claims and claims expenses is an inherently uncertain and complex process involving a high degree of judgment and is subject to the evaluation of numerous variables.
Discontinued Lines and Coverages
We conduct an annual review in the third quarter of each year to evaluate and establish asbestos, environmental and other discontinued lines reserves. Reserves are recorded in the reporting period in which they are determined. Using established industry and actuarial best practices and assuming no change in the regulatory or economic environment, this detailed and comprehensive methodology determines reserves based on assessments of the characteristics of exposure (e.g. claim activity, potential liability, jurisdiction, products versus non-products exposure) presented by policyholders.
| | | | | | | | | | | | | | | | | | | | | | | | | | | | | | | | | | | | | | |
Discontinued Lines and Coverages reserve reestimates |
| | 2020 | | 2019 | | 2018 |
| ($ in millions) | | January 1 reserves | | Reserve reestimate | | January 1 reserves | | Reserve reestimate | | January 1 reserves | | Reserve reestimate |
| Asbestos claims | | $ | 810 | | | $ | 78 | | | $ | 866 | | | $ | 28 | | | $ | 884 | | | $ | 44 | |
| Environmental claims | | 179 | | | 44 | | | 170 | | | 36 | | | 166 | | | 20 | |
| Other discontinued lines | | 376 | | | 19 | | | 355 | | | 41 | | | 357 | | | 23 | |
| Total | | $ | 1,365 | | | $ | 141 | | | $ | 1,391 | | | $ | 105 | | | $ | 1,407 | | | $ | 87 | |
| Underwriting loss | | | | $ | (144) | | | | | $ | (108) | | | | | $ | (90) | |
| | | | | | | | | | | | |
Reserve reestimates in 2020 primarily related to new reported information, court decisions and policy buyback settlements for asbestos exposures and higher than expected reported losses for environmental and other discontinued lines exposures.
Reserve reestimates in 2019 primarily related to new reported information and settlement agreements, including bankruptcy proceedings, impacting asbestos and other discontinued lines and additional environmental clean-up sites.
Claims and Claims Expense Reserves 2020 Form 10-K
| | | | | | | | | | | | | | | | | | | | | | | | | | | | | | | | | | | | | | |
Reserves and claim activity before (Gross) and after (Net) the effects of reinsurance |
| | 2020 | | 2019 | | 2018 |
| ($ in millions, except ratios) | | Gross | | Net | | Gross | | Net | | Gross | | Net |
| Asbestos claims | | | | | | | | | | | | |
| Beginning reserves | | $ | 1,172 | | | $ | 810 | | | $ | 1,266 | | | $ | 866 | | | $ | 1,296 | | | $ | 884 | |
| Incurred claims and claims expense | | 132 | | | 78 | | | 39 | | | 28 | | | 89 | | | 44 | |
| Claims and claims expense paid | | (100) | | | (61) | | | (133) | | | (84) | | | (119) | | | (62) | |
| Ending reserves | | $ | 1,204 | | | $ | 827 | | | $ | 1,172 | | | $ | 810 | | | $ | 1,266 | | | $ | 866 | |
| | | | | | | | | | | | |
| Annual survival ratio | | 12.0 | | | 13.6 | | | 8.8 | | | 9.6 | | | 10.6 | | | 14.0 | |
| 3-year survival ratio | | 10.3 | | | 12.0 | | | 9.0 | | | 10.3 | | | 9.1 | | | 9.7 | |
| | | | | | | | | | | | |
| Environmental claims | | | | | | | | | | | | |
| Beginning reserves | | $ | 219 | | | $ | 179 | | | $ | 209 | | | $ | 170 | | | $ | 199 | | | $ | 166 | |
| Incurred claims and claims expense | | 49 | | | 44 | | | 42 | | | 36 | | | 30 | | | 20 | |
| Claims and claims expense paid | | (19) | | | (17) | | | (32) | | | (27) | | | (20) | | | (16) | |
| Ending reserves | | $ | 249 | | | $ | 206 | | | $ | 219 | | | $ | 179 | | | $ | 209 | | | $ | 170 | |
| | | | | | | | | | | | |
| Annual survival ratio | | 13.1 | | | 12.1 | | | 6.8 | | | 6.6 | | | 10.5 | | | 10.6 | |
| 3-year survival ratio | | 10.5 | | | 10.3 | | | 8.1 | | | 8.1 | | | 8.4 | | | 8.2 | |
| | | | | | | | | | | | |
| Combined environmental and asbestos claims | | | | | | | | | | | | |
| Annual survival ratio | | 12.2 | | | 13.2 | | | 8.4 | | | 8.9 | | | 10.6 | | | 13.3 | |
| 3-year survival ratio | | 10.3 | | | 11.6 | | | 8.8 | | | 9.9 | | | 9.0 | | | 9.5 | |
| Percentage of IBNR in ending reserves | | | | 50.3 | % | | | | 48.8 | % | | | | 49.6 | % |
The survival ratio is calculated by taking our ending reserves divided by payments made during the year. This is a commonly used but simplistic and imprecise approach to measuring the adequacy of asbestos and environmental reserve levels. Many factors, such as mix of business, level of coverage provided and settlement procedures have significant impacts on the amount of environmental and asbestos claims and claims expense reserves, claim payments and the resultant ratio. As payments result in corresponding reserve reductions, survival ratios can be expected to vary over time. In 2020 and 2019, the asbestos and environmental net 3-year survival ratio increased due to lower claim payments associated with settlement agreements.
| | | | | | | | | | | | | | | | | | | | | | | | | | | | | | | | | | | | | | | | | | | | | | | | | | | | | | | | |
Net asbestos reserves by type of exposure and total reserve additions |
| | December 31, 2020 | | December 31, 2019 | | December 31, 2018 |
| ($ in millions) | | Active policy-holders | | Net reserves | | % of reserves | | Active policy-holders | | Net reserves | | % of reserves | | Active policy-holders | | Net reserves | | % of reserves |
| Direct policyholders: | | | | | | | | | | | | | | | | | | |
| Primary | | 59 | | | $ | 10 | | | 1 | % | | 58 | | | $ | 12 | | | 1 | % | | 51 | | | $ | 12 | | | 1 | % |
| Excess | | 303 | | | 291 | | | 35 | | | 299 | | | 292 | | | 36 | | | 295 | | | 309 | | | 36 | |
| Total | | 362 | | | 301 | | | 36 | | | 357 | | | 304 | | | 37 | | | 346 | | | 321 | | | 37 | |
| Assumed reinsurance | | | | 122 | | | 15 | | | | | 127 | | | 16 | | | | | 138 | | | 16 | |
| IBNR | | | | 404 | | | 49 | | | | | 379 | | | 47 | | | | | 407 | | | 47 | |
| Total net reserves | | | | $ | 827 | | | 100 | % | | | | $ | 810 | | | 100 | % | | | | $ | 866 | | | 100 | % |
| Total reserve additions | | | | $ | 78 | | | | | | | $ | 28 | | | | | | | $ | 44 | | | |
At December 31, 2020, there were 362 active policyholders with open asbestos claims.
•Active policyholders increased by 5 in 2020, including 8 policyholders reporting asbestos claims for the first time and the closing of all claims for 3 policyholders.
•Active policyholders increased by 11 in 2019, including 16 policyholders reporting asbestos claims for the first time and the closing of all claims for 5 policyholders.
IBNR net reserves increased $25 million as of December 31, 2020 compared to December 31, 2019. IBNR provides for reserve development of known claims and future reporting of additional unknown
claims from current policyholders and ceding companies.
Reinsurance and indemnification programs We utilize reinsurance to reduce exposure to catastrophe risk and manage capital, and to support the required statutory surplus and the insurance financial strength ratings of certain subsidiaries such as Castle Key Insurance Company (“CKIC”) and Allstate New Jersey Insurance Company (“ANJ”). We purchase significant reinsurance to manage our aggregate countrywide exposure to an acceptable level. The price and terms of reinsurance and the credit quality of the reinsurer are considered in the purchase process, along with whether the price can be appropriately reflected in the costs that are considered in setting future rates
The Allstate Corporation 67
2020 Form 10-K Claims and Claims Expense Reserves
charged to policyholders. We have also purchased reinsurance to mitigate exposures in our long-tail liability lines, including environmental, asbestos and other discontinued lines as well as our commercial lines, including shared economy. We also participate in various indemnification mechanisms, including state-based industry pool or facility programs mandating
participation by insurers offering certain coverage in their state and the federal government National Flood Insurance Program (“NFIP”). See Note 10 of the consolidated financial statements for additional details on these programs.
| | | | | | | | | | | | | | | | | | | | |
Reinsurance and indemnification recoverables, net of the allowance established for uncollectible amounts |
| | S&P financial strength rating (1) | | Reinsurance or indemnification recoverable on paid and unpaid claims, net |
| ($ in millions) | | | 2020 | | 2019 |
| Indemnification programs | | | | | | |
State-based industry pool or facility programs | | | | | | |
MCCA (2) | | N/A | | $ | 5,646 | | | $ | 5,499 | |
| New Jersey Property-Liability Insurance Guaranty Association (“PLIGA”) | | N/A | | 389 | | | 446 | |
| North Carolina Reinsurance Facility | | N/A | | 67 | | | 78 | |
| Florida Hurricane Catastrophe Fund (“FHCF”) | | N/A | | 32 | | | 52 | |
| Other | | | | 8 | | | 9 | |
Federal Government - NFIP | | N/A | | 30 | | | 25 | |
| | | | | | |
| Subtotal | | | | 6,172 | | | 6,109 | |
| | | | | | |
| Catastrophe reinsurance recoverables | | | | | | |
| Renaissance Reinsurance Limited | | A+ | | 17 | | | 27 | |
| Swiss Reinsurance America Corporation | | AA- | | 12 | | | 15 | |
| Everest Reinsurance Company | | A+ | | 12 | | | 15 | |
| Other | | | | 156 | | | 179 | |
| Subtotal | | | | 197 | | | 236 | |
| | | | | | |
Other reinsurance recoverables, net (3) | | | | | | |
Lloyd’s of London (“Lloyd’s”) (4) | | A+ | | 166 | | | 158 | |
| Aleka Insurance Inc. | | N/A | | 165 | | | 115 | |
| Westport Insurance Corporation | | AA- | | 59 | | | 55 | |
| TIG Insurance Company | | N/A | | 40 | | | 38 | |
| | | | | | |
| | | | | | |
| Other, including allowance for credit losses | | | | 317 | | | 293 | |
| Subtotal | | | | 747 | | | 659 | |
| Total Property-Liability | | | | 7,116 | | | 7,004 | |
Protection Services | | | | 18 | | | 20 | |
| Total | | | | $ | 7,134 | | | $ | 7,024 | |
(1)N/A reflects no S&P Global Ratings (“S&P”) rating available.
(2)As of December 31, 2020 and 2019, MCCA includes $34 million and $39 million of reinsurance recoverable on paid claims, respectively, and $5.61 billion and $5.46 billion of reinsurance recoverable on unpaid claims, respectively.
(3)Other reinsurance recoverables primarily relate to asbestos, environmental and other liability exposures as well as commercial lines, including shared economy.
(4)As of December 31, 2020, case reserves for Lloyd’s were 64% of the reinsurance recoverable for unpaid claims.
Reinsurance and indemnification recoverables include an estimate of the amount of insurance claims and claims expense reserves that are ceded under the terms of the agreements, including IBNR unpaid losses. We calculate our ceded reinsurance and indemnification estimates based on the terms of each applicable agreement, including an estimate of how IBNR losses will ultimately be ceded under the agreement. We also consider other limitations and coverage exclusions under our agreements. Accordingly, our estimate of recoverables is subject to similar risks and uncertainties as our estimate of reserves claims and claims expense. We believe the recoverables are appropriately established; however,
as our underlying reserves continue to develop, the amount ultimately recoverable may vary from amounts currently recorded. We regularly evaluate the reinsurers and the respective amounts of our reinsurance recoverables, and a provision for uncollectible reinsurance recoverables is recorded, if needed. The establishment of reinsurance recoverables and the related allowance for uncollectible reinsurance is also an inherently uncertain process involving estimates. Changes in estimates could result in additional changes to the Consolidated Statements of Operations.
Indemnification recoverables are considered collectible based on the industry pool and facility
Claims and Claims Expense Reserves 2020 Form 10-K
enabling legislation and the Company has not had any credit losses related to these programs and we do not anticipate losses in the foreseeable future. We also have not experienced credit losses on our catastrophe reinsurance programs, which include highly rated reinsurers.
The allowance for uncollectible reinsurance relates to other reinsurance programs primarily related to our Discontinued Lines and Coverages segment. This allowance was $59 million and $60 million as of December 31, 2020 and 2019, respectively.
The allowance is based upon our ongoing review of amounts outstanding, length of collection periods, changes in reinsurer credit standing, and other relevant factors. In addition, in the ordinary course of business, we may become involved in coverage disputes with certain of our reinsurers that may ultimately result in lawsuits and arbitrations brought by or against such reinsurers to determine the parties’ rights and obligations under the various reinsurance agreements. We employ dedicated specialists to manage reinsurance collections and disputes. We also consider recent developments in commutation activity
between reinsurers and cedents, and recent trends in arbitration and litigation outcomes in disputes between cedents and reinsurers in seeking to maximize our reinsurance recoveries.
Adverse developments in the insurance industry have led to a decline in the financial strength of some of our reinsurance carriers, causing amounts recoverable from them and future claims ceded to them to be considered a higher risk. There has also been consolidation activity in the industry, which causes reinsurance risk across the industry to be concentrated among fewer companies.
See Note 2 of the consolidated financial statements for a description of the methodology utilized to calculate the allowance for reinsurance recoverables.
For further details related to our reinsurance and indemnification recoverables, see the Regulation section in Part I and Note 10 of the consolidated financial statements.
| | | | | | | | | | | | | | | | | | | | |
Effects of reinsurance ceded and indemnification programs on our premiums earned and claims and claims expense |
| | For the years ended December 31, |
| ($ in millions) | | 2020 | | 2019 | | 2018 |
| Allstate Protection - Premiums | | | | | | |
| Indemnification programs | | | | | | |
State-based industry pool or facility programs | | | | | | |
| MCCA | | $ | 61 | | | $ | 89 | | | $ | 77 | |
| PLIGA | | 7 | | | 8 | | | 9 | |
| FHCF | | 9 | | | 9 | | | 10 | |
| Other | | 97 | | | 85 | | | 90 | |
Federal Government - NFIP | | 261 | | | 258 | | | 258 | |
| Catastrophe reinsurance | | 416 | | | 377 | | | 344 | |
| Other reinsurance programs | | 110 | | | 121 | | | 54 | |
| Total Allstate Protection | | 961 | | | 947 | | | 842 | |
| Discontinued Lines and Coverages | | — | | | — | | | — | |
| Total Property-Liability | | 961 | | | 947 | | | 842 | |
Protection Services | | 180 | | | 175 | | | 174 | |
| Total effect on premiums earned | | $ | 1,141 | | | $ | 1,122 | | | $ | 1,016 | |
| | | | | | |
| Allstate Protection - Claims | | | | | | |
| Indemnification programs | | | | | | |
State-based industry pool or facility programs | | | | | | |
| MCCA | | $ | 256 | | | $ | 208 | | | $ | 233 | |
| PLIGA | | (40) | | | 3 | | | (6) | |
| FHCF | | 15 | | | 31 | | | 148 | |
| Other | | 63 | | | 67 | | | 90 | |
Federal Government - NFIP | | 87 | | | 150 | | | 118 | |
Catastrophe reinsurance | | (105) | | (1) | (166) | | (2) | 604 | |
| Other reinsurance programs | | 88 | | | 94 | | | 40 | |
| Total Allstate Protection | | 364 | | | 387 | | | 1,227 | |
| Discontinued Lines and Coverages | | 75 | | | 39 | | | 57 | |
| Total Property-Liability | | 439 | | | 426 | | | 1,284 | |
Protection Services | | 91 | | | 98 | | | 94 | |
| Total effect on claims and claims expense | | $ | 530 | | | $ | 524 | | | $ | 1,378 | |
(1)Decline reflects reestimates in claims and claims expense related subrogation settlements.
(2)Decline reflects reestimates in claims and claims expense related to the 2018 Camp Fire.
The Allstate Corporation 69
2020 Form 10-K Claims and Claims Expense Reserves
In 2020 and 2019, ceded premiums earned increased primarily due to increased catastrophe reinsurance premium rates. In 2020, ceded claims and claims expenses increased $6 million. In 2019, ceded claims and claims expenses decreased $854 million, primarily due to lower amounts related to the catastrophe reinsurance program, partially offset by increased activity with our shared economy business.
Our claim reserve development experience in 2020 is consistent with the prior two years as gross reserves have increased between 2-3% each year. The Governor of Michigan signed new legislation on May 30, 2019 to reform Michigan’s no-fault auto insurance system. For further discussion of these items, see Regulation, Indemnification Programs and Note 10 of the consolidated financial statements.
| | | | | | | | | | | | | | | | | | | | | | | | | | | | | | | | | | | | | | |
Michigan personal injury protection reserve and claim activity before and after the effects of MCCA recoverables |
| | For the years ended December 31, |
| | 2020 | | 2019 | | 2018 |
| ($ in millions) | | Gross | | Net | | Gross | | Net | | Gross | | Net |
| Beginning reserves | | $ | 6,106 | | | $ | 647 | | | $ | 5,975 | | | $ | 605 | | | $ | 5,799 | | | $ | 565 | |
| Incurred claims and claims expense-current year | | 312 | | | 98 | | | 446 | | | 202 | | | 449 | | | 189 | |
| Incurred claims and claims expense-prior years | | 107 | | | 65 | | | (16) | | | 20 | | | 9 | | | 35 | |
Claims and claims expense paid-current year (1) | | (47) | | | (42) | | | (55) | | | (53) | | | (52) | | | (51) | |
Claims and claims expense paid-prior years (1) | | (196) | | | (98) | | | (244) | | | (127) | | | (230) | | | (133) | |
Ending reserves (2) | | $ | 6,282 | | | $ | 670 | | | $ | 6,106 | | | $ | 647 | | | $ | 5,975 | | | $ | 605 | |
(1)Paid claims and claims expenses reported in the table for the current and prior years, recovered from the MCCA totaled $103 million, $119 million and $98 million in 2020, 2019 and 2018, respectively.
(2)Gross reserves for the year ended December 31, 2020, comprise 82% case reserves and 18% IBNR. Gross reserves for the year ended December 31, 2019, comprise 85% case reserves and 15% IBNR. Gross reserves for the year ended December 31, 2018 comprise 88% case reserves and 12% IBNR. The MCCA does not require member companies to report ultimate case reserves.
Pending MCCA claims differ from most personal lines insurance pending claims as other personal lines policies have coverage limits and incurred claims settle in shorter periods. Claims are considered pending as long as payments are continuing pursuant to an outstanding MCCA claim, which can be for a claimant’s lifetime. Many of these injuries are catastrophic in nature, resulting in serious permanent disabilities that
require attendant and residential care for periods that may span decades. A significant portion of the ultimate incurred claim reserves and the recoverables can be attributed to a small number of catastrophic claims that occurred more than five years ago and continue to pay lifetime benefits.
| | | | | | | | | | | | | | | | | | | | |
Pending, new and closed claims for Michigan personal injury protection exposure |
| | For the years ended December 31, |
Number of claims (1) | | 2020 | | 2019 | | 2018 |
| Pending, beginning of year | | 4,942 | | | 4,812 | | | 4,983 | |
| New | | 5,896 | | | 7,807 | | | 7,858 | |
| Closed | | (5,981) | | | (7,677) | | | (8,029) | |
| Pending, end of year | | 4,857 | | | 4,942 | | | 4,812 | |
(1)Total claims includes those covered and not covered by the MCCA indemnification.
As of December 31, 2020, approximately 1,500 of our pending claims have been reported to the MCCA, of which approximately 60% represents claims that occurred more than 5 years ago. There are 68 Allstate brand claims with reserves in excess of $15 million as of December 31, 2020, which comprise approximately 29% of the gross ending reserves in the table above. As a result, significant developments with a single claimant can result in volatility in prior year incurred claims.
Intercompany reinsurance We enter into certain intercompany insurance and reinsurance transactions in order to maintain underwriting control and manage insurance risk among various legal entities. These reinsurance agreements have been approved by the appropriate regulatory authorities. All significant intercompany transactions have been eliminated in consolidation.
Catastrophe reinsurance Our catastrophe reinsurance program is designed to address our exposure to catastrophes nationwide, utilizing our risk management methodology. Our program is designed
to provide reinsurance protection for catastrophes resulting from multiple perils including hurricanes, windstorms, hail, tornadoes, earthquakes, wildfires, and fires following earthquakes. These reinsurance agreements are part of our catastrophe management strategy, which is intended to provide our shareholders an acceptable return on the risks assumed in our property business, while providing protection to our customers.
We anticipate completing the placement of our 2021 nationwide catastrophe reinsurance program in the second quarter of 2021. We expect the program will be similar to our 2020 nationwide catastrophe reinsurance program, but will evaluate opportunities to improve the economic terms and conditions. We are also evaluating opportunities to include National General, which was acquired on January 4, 2021, into the program. For further details of the existing 2020 program, see Note 10 of the consolidated financial statements.
Allstate Life 2020 Form 10-K
Allstate Life Segment
Allstate Life consists of traditional, interest-sensitive and variable life insurance. In 2020, Allstate Life represented 4.4% of total revenue, 1.1% of total PIF and 4.2% of total adjusted net income. Our target customers are middle market consumers with family and financial protection needs.
On January 26, 2021, we announced an agreement to sell ALIC and certain affiliates, which represent approximately 90% of Allstate Life reserves for life-contingent contract benefits and contractholder funds. Allstate will retain ownership of ALNY unless an agreement can be reached with a third party to assume some or all of ALNY’s liabilities. For additional information on our strategy and outlook, see Part I, Item 1. Business - Strategy and Segment Information.
| | | | | | | | | | | | | | | | | | | | |
Summarized financial information |
| | For the years ended December 31, |
| ($ in millions) | | 2020 | | 2019 | | 2018 |
| Revenues | | | | | | |
| Premiums and contract charges | | $ | 1,340 | | | $ | 1,343 | | | $ | 1,315 | |
| Other revenue | | 121 | | | 125 | | | 119 | |
| Net investment income | | 502 | | | 514 | | | 505 | |
| Realized capital gains (losses) | | (10) | | | 1 | | | (14) | |
| Total revenues | | 1,953 | | | 1,983 | | | 1,925 | |
| | | | | | |
| Costs and expenses | | | | | | |
| Contract benefits | | (964) | | | (855) | | | (809) | |
| Interest credited to contractholder funds | | (329) | | | (299) | | | (285) | |
| Amortization of DAC | | (149) | | | (173) | | | (132) | |
| Operating costs and expenses | | (329) | | | (354) | | | (361) | |
| Restructuring and related charges | | (6) | | | (2) | | | (3) | |
| Total costs and expenses | | (1,777) | | | (1,683) | | | (1,590) | |
| | | | | | |
| | | | | | |
| Income tax expense | | (17) | | | (53) | | | (75) | |
| Net income applicable to common shareholders | | $ | 159 | | | $ | 247 | | | $ | 260 | |
| | | | | | |
| Adjusted net income | | $ | 194 | | | $ | 261 | | | $ | 295 | |
| Realized capital gains (losses), after-tax | | (9) | | | — | | | (11) | |
| Valuation changes on embedded derivatives that are not hedged, after-tax | | (34) | | | (9) | | | — | |
| DAC and DSI amortization related to realized capital gains and losses and valuation changes on embedded derivatives that are not hedged, after-tax | | 8 | | | (5) | | | (8) | |
| | | | | | |
| Tax Legislation (expense) benefit | | — | | | — | | | (16) | |
| Net income applicable to common shareholders | | $ | 159 | | | $ | 247 | | | $ | 260 | |
| | | | | | |
| Reserve for life-contingent contract benefits as of December 31 | | $ | 2,755 | | | $ | 2,736 | | | $ | 2,677 | |
| | | | | | |
| Contractholder funds as of December 31 | | $ | 8,013 | | | $ | 7,805 | | | $ | 7,656 | |
| | | | | | |
| Policies in force as of December 31 by distribution channel (in thousands) | | | | | | |
| Allstate agencies | | 1,765 | | | 1,816 | | | 1,831 | |
| Closed channels | | 98 | | | 107 | | | 114 | |
| Total | | 1,863 | | | 1,923 | | | 1,945 | |
Net income applicable to common shareholders decreased 35.6% or $88 million in 2020 compared to 2019.
Adjusted net income decreased 25.7% or $67 million in 2020 compared to 2019, primarily due to higher contract benefits due to mortality associated with the Coronavirus, partially offset by lower operating costs and expenses.
Premiums and contract charges decreased 0.2% or $3 million in 2020 compared to 2019, primarily due to lower contract charges on interest-sensitive life insurance from a decline in business in force, partially offset by higher premiums from traditional life insurance. Approximately 85% of Allstate Life’s traditional life insurance premium relates to term life insurance products.
The Allstate Corporation 71
2020 Form 10-K Allstate Life
Effective March 31, 2020, in light of uncertainty around the impacts of the Coronavirus, we implemented temporary underwriting restrictions on new life insurance applications. We are approving standard and preferred rate classes only, with a maximum issue age of 69, and suspended sales of our simplified issue term life product that does not require
underwriting. While these restrictions are in place, we expect sales to slow. Allstate agents and exclusive financial specialists are able to offer coverage to customers outside these guidelines through nonproprietary carriers.
| | | | | | | | | | | | | | | | | | | | |
Premiums and contract charges by product |
| | For the years ended December 31, |
| ($ in millions) | | 2020 | | 2019 | | 2018 |
| Traditional life insurance premiums | | $ | 633 | | | $ | 630 | | | $ | 600 | |
| Accident and health insurance premiums | | 2 | | | 2 | | | 2 | |
Interest-sensitive life insurance contract charges (1) | | 705 | | | 711 | | | 713 | |
Premiums and contract charges | | $ | 1,340 | | | $ | 1,343 | | | $ | 1,315 | |
(1)Contract charges related to the cost of insurance totaled $506 million, $499 million and $493 million in 2020, 2019 and 2018, respectively.
Other revenue decreased 3.2% or $4 million in 2020 compared to 2019, primarily due to lower gross dealer concessions earned on Allstate agents’ or exclusive financial specialists’ sales of non-proprietary products.
Contract benefits increased 12.7% or $109 million in 2020 compared to 2019, primarily due to higher claim experience related to Coronavirus on both interest-sensitive and traditional life insurance. Estimated Coronavirus claims, net of reinsurance and reserve releases, totaled $78 million in 2020.
Our annual review of assumptions in 2020 resulted in a $24 million increase in reserves primarily for secondary guarantees on interest-sensitive life insurance due to decreased projected interest rates that result in lower projected policyholder account values which increases guaranteed benefits. In 2019, the review resulted in a $5 million decrease in reserves primarily for secondary guarantees on interest-sensitive life insurance due to utilizing more refined policy level information and assumptions.
Benefit spread reflects our mortality and morbidity results using the difference between premiums and contract charges earned for the cost of insurance and contract benefits (“benefit spread”). Benefit spread decreased 35.9% to $177 million in 2020 compared to $276 million in 2019, primarily due to higher claim experience on interest-sensitive life insurance and an increase in reserves for secondary guarantees on interest-sensitive life insurance.
Interest credited to contractholder funds increased 10.0% or $30 million in 2020 compared to 2019. Valuation changes on derivatives embedded in equity-indexed universal life contracts that are not hedged increased interest credited to contractholder funds by $43 million in 2020 compared to $11 million in 2019. These valuation changes are primarily driven by changes in interest rates.
Investment spread reflects the difference between net investment income and interest credited to contractholder funds (“investment spread”) and is used to analyze the impact of net investment income and interest credited to contractholder funds on net income.
| | | | | | | | | | | | | | | | | | | | |
Investment spread |
| | For the years ended December 31, |
| ($ in millions) | | 2020 | | 2019 | | 2018 |
| Investment spread before valuation changes on embedded derivatives that are not hedged | | $ | 216 | | | $ | 226 | | | $ | 220 | |
| Valuation changes on derivatives embedded in equity-indexed universal life contracts that are not hedged | | (43) | | | (11) | | | — | |
| Total investment spread | | $ | 173 | | | $ | 215 | | | $ | 220 | |
Investment spread before valuation changes on embedded derivatives that are not hedged decreased 4.4% in 2020 compared to 2019, primarily due to lower net investment income.
Amortization of DAC decreased 13.9% or $24 million in 2020 compared to 2019, primarily due to lower amortization from lower gross profits on interest-sensitive life insurance, partially offset by higher amortization acceleration for changes in assumptions.
Allstate Life 2020 Form 10-K
| | | | | | | | | | | | | | | | | | | | |
Components of amortization of DAC |
| | For the years ended December 31, |
| ($ in millions) | | 2020 | | 2019 | | 2018 |
| Amortization of DAC before amortization relating to realized capital gains and losses, valuation changes on embedded derivatives that are not hedged and changes in assumptions | | $ | 78 | | | $ | 109 | | | $ | 117 | |
Amortization relating to realized capital gains and losses (1) and valuation changes on embedded derivatives that are not hedged | | (10) | | | 6 | | | 10 | |
| Amortization acceleration for changes in assumptions (‘‘DAC unlocking’’) | | 81 | | | 58 | | | 5 | |
| Total amortization of DAC | | $ | 149 | | | $ | 173 | | | $ | 132 | |
(1)The impact of realized capital gains and losses on amortization of DAC is dependent upon the relationship between the assets that give rise to the gain or loss and the product liability supported by the assets. Fluctuations result from changes in the impact of realized capital gains and losses on actual and expected gross profits.
Our annual comprehensive review of assumptions underlying estimated future gross profits for our interest-sensitive life contracts covers assumptions for mortality, persistency, expenses, investment returns, including capital gains and losses, interest crediting rates to policyholders, and the effect of any hedges. An assessment is made of future projections to ensure the reported DAC balances reflect current expectations.
In 2020, the review resulted in an acceleration of DAC amortization (decrease to income) of $81 million. DAC amortization acceleration primarily related to the investment margin component of estimated gross profits and was due to lower projected future interest rates and investment returns compared to our previous expectations. This was partially offset by DAC
amortization deceleration (increase to income) for changes in the expense margin due to a decrease in projected expenses.
In 2019, the review resulted in an acceleration of DAC amortization of $58 million. DAC amortization acceleration primarily related to the investment margin component of estimated gross profits and was due to lower projected future interest rates and investment returns compared to our previous expectations. The acceleration related to benefit margin was due to decreased projected interest rates that result in lower projected policyholder account values which increases benefits on guaranteed products and more refined policy level information and assumptions.
| | | | | | | | | | | | | | | | | | | | | | | | | | | | | | | | | | | | | | |
Changes in DAC |
| ($ in millions) | | Traditional life and accident and health | | Interest-sensitive life insurance | | Total |
| | For the years ended December 31, |
| | 2020 | | 2019 | | 2020 | | 2019 | | 2020 | | 2019 |
| Balance, beginning of year | | $ | 508 | | | $ | 489 | | | $ | 571 | | | $ | 811 | | | $ | 1,079 | | | $ | 1,300 | |
| Acquisition costs deferred | | 50 | | | 63 | | | 56 | | | 60 | | | 106 | | | 123 | |
Amortization of DAC before amortization relating to realized capital gains and losses, valuation changes on embedded derivatives that are not hedged and changes in assumptions (1) | | (44) | | | (44) | | | (34) | | | (65) | | | (78) | | | (109) | |
Amortization relating to realized capital gains and losses and valuation changes on embedded derivatives that are not hedged (1) | | — | | | — | | | 10 | | | (6) | | | 10 | | | (6) | |
Amortization acceleration for DAC unlocking (1) | | — | | | — | | | (81) | | | (58) | | | (81) | | | (58) | |
Effect of unrealized capital gains and losses (2) | | — | | | — | | | (127) | | | (171) | | | (127) | | | (171) | |
| Ending balance | | $ | 514 | | | $ | 508 | | | $ | 395 | | | $ | 571 | | | $ | 909 | | | $ | 1,079 | |
(1)Included as a component of amortization of DAC on the Consolidated Statements of Operations.
(2)Represents the change in the DAC adjustment for unrealized capital gains and losses. The DAC adjustment represents the amount by which the amortization of DAC would increase or decrease if the unrealized gains and losses in the respective product portfolios were realized.
Operating costs and expenses decreased 7.1% or $25 million in 2020 compared to 2019, primarily due to lower employee-related, marketing and technology costs.
Analysis of reserves and contractholder funds
| | | | | | | | | | | | | | | | |
Reserve for life-contingent contract benefits | | |
| | As of December 31, | | |
| ($ in millions) | | 2020 | | 2019 | | |
| Traditional life insurance | | $ | 2,643 | | | $ | 2,612 | | | |
| Accident and health insurance | | 112 | | | 124 | | | |
| Reserve for life-contingent contract benefits | | $ | 2,755 | | | $ | 2,736 | | | |
| | | | | | |
| | | | | | |
| | | | | | |
| | | | | | |
| | | | | | |
| | | | | | |
| | | | | | |
The Allstate Corporation 73
2020 Form 10-K Allstate Life
Contractholder funds represent interest-bearing liabilities arising from the sale of products such as interest-sensitive life insurance. The balance of contractholder funds is equal to the cumulative deposits received and interest credited to the contractholder less cumulative contract benefits, surrenders, withdrawals and contract charges for mortality or administrative expenses.
| | | | | | | | | | | | | | | | | | | | |
Change in contractholder funds |
| | For the years ended December 31, |
| ($ in millions) | | 2020 | | 2019 | | 2018 |
| Contractholder funds, beginning balance | | $ | 7,805 | | | $ | 7,656 | | | $ | 7,608 | |
| | | | | | |
| | | | | | |
| | | | | | |
| Deposits | | 921 | | | 949 | | | 965 | |
| | | | | | |
| Interest credited | | 327 | | | 298 | | | 284 | |
| | | | | | |
| Benefits, withdrawals and other adjustments | | | | | | |
| Benefits | | (230) | | | (233) | | | (232) | |
| Surrenders and partial withdrawals | | (225) | | | (261) | | | (259) | |
| Contract charges | | (704) | | | (702) | | | (704) | |
| Net transfers from separate accounts | | 5 | | | 10 | | | 6 | |
Other adjustments (1) | | 114 | | | 88 | | | (12) | |
| Total benefits, withdrawals and other adjustments | | (1,040) | | | (1,098) | | | (1,201) | |
| Contractholder funds, ending balance | | $ | 8,013 | | | $ | 7,805 | | | $ | 7,656 | |
(1)The table above illustrates the changes in contractholder funds, which are presented gross of reinsurance recoverables on the Consolidated Statements of Financial Position. The table above is intended to supplement our discussion and analysis of revenues, which are presented net of reinsurance on the Consolidated Statements of Operations. As a result, the net change in contractholder funds associated with products reinsured is reflected as a component of the other adjustments line.
Contractholder deposits decreased 3.0% in 2020 compared to 2019. The weighted average guaranteed crediting rate and weighted average current crediting rate for our interest-sensitive life insurance contracts, excluding variable life, are both 3.8% as of December 31, 2020.
Allstate Life 2020 Form 10-K
Allstate Life reinsurance ceded
In the normal course of business, we seek to limit aggregate and single exposure to losses on large risks by purchasing reinsurance. In addition, we have used reinsurance to effect the disposition of certain blocks of business.
We retain primary liability as a direct insurer for all risks ceded to reinsurers. As of December 31, 2020, approximately 12% of our face amount of life insurance in force was reinsured.
| | | | | | | | | | | | | | | | | | | | |
| Reinsurance recoverables by reinsurer, net |
| | S&P financial strength rating (1) | | Reinsurance recoverable on paid and unpaid benefits |
| | |
| | | | As of December 31, |
| ($ in millions) | | | | 2020 | | 2019 |
| RGA Reinsurance Company | | AA- | | $ | 167 | | | $ | 197 | |
| Swiss Re Life and Health America, Inc. | | AA- | | 147 | | | 155 | |
| Transamerica Life Group | | A+ | | 75 | | | 75 | |
| Munich American Reassurance | | AA- | | 70 | | | 80 | |
Scottish Re (U.S.), Inc. (2) | | N/A | | 66 | | | 73 | |
| John Hancock Life & Health Insurance Company | | AA- | | 45 | | | 50 | |
Triton Insurance Company (3) | | N/A | | 40 | | | 43 | |
American Health & Life Insurance Co. (3) | | N/A | | 29 | | | 32 | |
| Security Life of Denver | | A+ | | 22 | | | 23 | |
| Lincoln National Life Insurance | | AA- | | 21 | | | 27 | |
| SCOR Global Life | | AA- | | 12 | | | 14 | |
| American United Life Insurance Company | | AA- | | 9 | | | 11 | |
Other (4) | | | | 18 | | | 17 | |
Credit loss allowance (5) | | | | (9) | | | (3) | |
| Total | | | | $ | 712 | | | $ | 794 | |
(1)N/A reflects no S&P rating available.
(2)In December 2018, the Delaware Insurance Commissioner placed Scottish Re (U.S.), Inc. under regulatory supervision and in March 2019, the reinsurer was placed in rehabilitation. We have been permitted to exercise certain setoff rights while the parties address any potential disputes. See Note 10 of the consolidated financial statements for further details.
(3)A.M. Best rating is B++.
(4)As of December 31, 2020 and 2019, the other category includes $11 million and $12 million, respectively, of recoverables due from reinsurers rated A- or better by S&P.
(5)Due to the adoption of the measurement of credit losses on financial instruments accounting standard, prior valuation allowance is now presented as an allowance for expected credit losses.
We continuously monitor the creditworthiness of reinsurers in order to determine our risk of recoverability on an individual and aggregate basis. In connection with the adoption of the measurement of credit losses on financial instruments accounting standard in 2020, the method of calculating the allowance for reinsurance recoverables changed. See Note 2 of the consolidated financial statements for additional details. No reinsurance recoverables have been written off in the three-years ended December 31, 2020.
We enter into certain intercompany reinsurance transactions for the Allstate Life operations in order to maintain underwriting control and manage insurance risk among various legal entities. These reinsurance agreements have been approved by the appropriate regulatory authorities. All significant intercompany transactions have been eliminated in consolidation.
The Allstate Corporation 75
2020 Form 10-K Allstate Benefits
Allstate Benefits Segment
Allstate Benefits offers voluntary benefits products, including life, accident, critical illness, hospital, short-term disability and other health products. In 2020, Allstate Benefits represented 2.6% of total revenue, 2.2% of total PIF and 2.1% of total adjusted net income. Our target customers are middle market consumers with family and financial protection needs. For additional information on our strategy and outlook, see Part I, Item 1. Business - Strategy and Segment Information.
| | | | | | | | | | | | | | | | | | | | |
Summarized financial information |
| | For the years ended December 31, |
| ($ in millions) | | 2020 | | 2019 | | 2018 |
| Revenues | | | | | | |
| Premiums and contract charges | | $ | 1,094 | | | $ | 1,145 | | | $ | 1,135 | |
| | | | | | |
| Net investment income | | 78 | | | 83 | | | 77 | |
| Realized capital gains (losses) | | 8 | | | 12 | | | (9) | |
| Total revenues | | 1,180 | | | 1,240 | | | 1,203 | |
| | | | | | |
| Costs and expenses | | | | | | |
| Contract benefits | | (516) | | | (601) | | | (595) | |
| Interest credited to contractholder funds | | (33) | | | (34) | | | (35) | |
| Amortization of DAC | | (177) | | | (161) | | | (145) | |
| Operating costs and expenses | | (322) | | | (285) | | | (278) | |
| | | | | | |
| Restructuring and related charges | | (1) | | | — | | | — | |
| Total costs and expenses | | (1,049) | | | (1,081) | | | (1,053) | |
| | | | | | |
| | | | | | |
| Income tax expense | | (28) | | | (35) | | | (32) | |
| Net income applicable to common shareholders | | $ | 103 | | | $ | 124 | | | $ | 118 | |
| | | | | | |
| Adjusted net income | | $ | 96 | | | $ | 115 | | | $ | 124 | |
| Realized capital gains (losses), after-tax | | 7 | | | 9 | | | (7) | |
| DAC and DSI amortization related to realized capital gains and losses, after-tax | | — | | | — | | | 1 | |
| | | | | | |
| | | | | | |
| | | | | | |
| | | | | | |
| Net income applicable to common shareholders | | $ | 103 | | | $ | 124 | | | $ | 118 | |
| | | | | | |
Benefit ratio (1) | | 47.2 | | | 52.5 | | | 52.4 | |
| | | | | | |
Operating expense ratio (2) | | 29.4 | | | 24.9 | | | 24.5 | |
| | | | | | |
| Reserve for life-contingent contract benefits as of December 31 | | $ | 1,028 | | | $ | 1,034 | | | $ | 1,007 | |
| | | | | | |
| Contractholder funds as of December 31 | | $ | 857 | | | $ | 915 | | | $ | 898 | |
| | | | | | |
| Policies in force as of December 31 (in thousands) | | 3,950 | | | 4,183 | | | 4,208 | |
| | | | | | |
(1)Benefit ratio is calculated as contract benefits divided by premiums and contract charges.
(2)Operating expense ratio is calculated as operating costs and expenses divided by premiums and contract charges.
Net income applicable to common shareholders decreased 16.9% or $21 million in 2020 compared to 2019.
Adjusted net income decreased 16.5% or $19 million in 2020 compared to 2019, primarily due to lower premiums and higher operating costs and expenses driven by a $41 million, pre-tax, write-off of capitalized software costs associated with a billing system in the second quarter of 2020, partially offset by lower contract benefits.
Premiums and contract charges decreased 4.5% or $51 million in 2020 compared to 2019, primarily due to decreases in disability products from the non-renewal of a large underperforming account in the fourth quarter of 2019, and decreased premium collections due to Coronavirus-related layoffs and furloughs, partially offset by an increase in contract charges associated with the annual review of assumptions.
Allstate Benefits 2020 Form 10-K
| | | | | | | | | | | | | | | | | | | | |
Premiums and contract charges by product |
| | For the years ended December 31, |
| ($ in millions) | | 2020 | | 2019 | | 2018 |
| Life | | $ | 168 | | | $ | 157 | | | $ | 155 | |
| Accident | | 281 | | | 298 | | | 297 | |
| Critical illness | | 465 | | | 479 | | | 476 | |
| Hospital | | 102 | | | 99 | | | 93 | |
| Short-term disability | | 74 | | | 107 | | | 108 | |
| Other health | | 4 | | | 5 | | | 6 | |
Premiums and contract charges | | $ | 1,094 | | | $ | 1,145 | | | $ | 1,135 | |
New annualized premium sales (annualized premiums at initial customer enrollment) decreased 24.5% to $281 million in 2020. The decrease in 2020 relates to the impact of the Coronavirus and increased competition.
Contract benefits decreased 14.1% or $85 million in 2020 compared to 2019, primarily due to lower reported claim experience on critical illness, disability and accident products, driven by limited activities and deferral of non-essential medical procedures from the Coronavirus and the non-renewal of a large underperforming account in the fourth quarter of 2019.
Benefit ratio decreased to 47.2 in 2020 compared to 52.5 in 2019 primarily due to lower contract benefits for critical illness and accident products and an increase in contract charges associated with the annual review of assumptions.
Amortization of DAC increased 9.9% or $16 million in 2020 compared to 2019, primarily due to an unfavorable adjustment associated with our annual review of assumptions.
Our annual comprehensive review of assumptions underlying estimated future gross profits for our interest-sensitive life contracts resulted in an acceleration of DAC amortization (decrease to income) of $28 million or 5.8% of the unamortized DAC asset balance in 2020 compared to $2 million in 2019. In both 2020 and 2019, DAC amortization acceleration primarily related to lower projected investment returns, partially offset by favorable projected mortality.
| | | | | | | | | | | | | | |
Changes in DAC |
| | For the years ended |
| ($ in millions) | | 2020 | | 2019 |
| Balance, beginning of year | | $ | 527 | | | $ | 549 | |
| Acquisition costs deferred | | 120 | | | 142 | |
Amortization of DAC before amortization relating to changes in assumptions (1) | | (148) | | | (159) | |
Amortization relating to realized capital gains and losses (1) | | (1) | | | — | |
Amortization acceleration for DAC unlocking (1) | | (28) | | | (2) | |
Effect of unrealized capital gains and losses (2) | | — | | | (3) | |
| Ending balance | | $ | 470 | | | $ | 527 | |
(1)Included as a component of amortization of DAC on the Consolidated Statements of Operations.
(2)Represents the change in the DAC adjustment for unrealized capital gains and losses. The DAC adjustment represents the amount by which the amortization of DAC would increase or decrease if the unrealized gains and losses in the respective product portfolios were realized.
| | | | | | | | | | | | | | | | | | | | |
Operating costs and expenses |
| | For the years ended December 31, |
| ($ in millions) | | 2020 | | 2019 | | 2018 |
| Non-deferrable commissions | | $ | 99 | | | $ | 104 | | | $ | 109 | |
| General and administrative expenses | | 223 | | | 181 | | | 169 | |
| Total operating costs and expenses | | $ | 322 | | | $ | 285 | | | $ | 278 | |
Operating costs and expenses increased 13.0% or $37 million in 2020 compared to 2019, primarily due to a $41 million, pre-tax, write-off of capitalized software costs associated with a billing system in the second quarter of 2020 and higher technology costs.
Operating expense ratio increased to 29.4 in 2020 compared to 24.9 in 2019, primarily due to a $41 million, pre-tax, software write-off.
The Allstate Corporation 77
2020 Form 10-K Allstate Benefits
Analysis of reserves
| | | | | | | | | | | | | | | | |
Reserve for life-contingent contract benefits | | |
| | As of December 31, | | |
| ($ in millions) | | 2020 | | 2019 | | |
| Traditional life insurance | | $ | 299 | | | $ | 285 | | | |
| Accident and health insurance | | 729 | | | 749 | | | |
| Reserve for life-contingent contract benefits | | $ | 1,028 | | | $ | 1,034 | | | |
| | | | | | |
| | | | | | |
| | | | | | |
| | | | | | |
| | | | | | |
| | | | | | |
| | | | | | |
Allstate Benefits reinsurance ceded
The vast majority of reinsurance relates to the disposition of long-term care and other closed blocks of business several years ago. We retain primary liability as a direct insurer for all risks ceded to reinsurers.
| | | | | | | | | | | | | | | | | | | | |
| Reinsurance recoverables by reinsurer, net |
| | S&P financial strength rating | | Reinsurance recoverable on paid and unpaid benefits |
| | |
| | | | As of December 31, |
| ($ in millions) | | | | 2020 | | 2019 |
| Mutual of Omaha Insurance | | A+ | | $ | 60 | | | $ | 64 | |
| General Re Life Corporation | | AA+ | | 17 | | | 18 | |
Other (1) | | | | 5 | | | 6 | |
| Credit loss allowance | | | | (1) | | | — | |
| Total | | | | $ | 81 | | | $ | 88 | |
(1)As of both December 31, 2020 and 2019, the other category includes $4 million of recoverables due from reinsurers rated A- or better by S&P.
We continuously monitor the creditworthiness of reinsurers in order to determine our risk of recoverability on an individual and aggregate basis. In connection with the adoption of the measurement of credit losses on financial instruments accounting standard in 2020, the method of calculating the allowance for reinsurance recoverables changed. See Note 2 of the consolidated financial statements for additional details. No reinsurance recoverables have been written off in the three-years ended December 31, 2020.
We enter into certain intercompany reinsurance transactions for the Allstate Benefits operations in order to maintain underwriting control and manage insurance risk among various legal entities. These reinsurance agreements have been approved by the appropriate regulatory authorities. All significant intercompany transactions have been eliminated in consolidation.
Allstate Annuities 2020 Form 10-K
Allstate Annuities Segment
Allstate Annuities consists primarily of deferred fixed annuities and immediate fixed annuities (including standard and sub-standard structured settlements). In 2020, Allstate Annuities represented 2.3% of total revenue and 0.1% of total PIF. We discontinued the sale of proprietary annuities over an eight-year period from 2006 to 2014, reflecting our expectations of declining returns. This segment is in run-off, and we manage it with a focus on increasing economic value through our investment strategy.
On January 26, 2021, we announced an agreement to sell ALIC and certain affiliates, which represent approximately 75% of Allstate Annuities reserves for life-contingent contract benefits and contractholder funds. Allstate will retain ownership of ALNY unless an agreement can be reached with a third party to assume some or all of ALNY’s liabilities. For additional information on our strategy and outlook, see Part I, Item 1. Business - Strategy and Segment Information.
| | | | | | | | | | | | | | | | | | | | |
Summarized financial information |
| | For the years ended December 31, |
| ($ in millions) | | 2020 | | 2019 | | 2018 |
| Revenues | | | | | | |
| Contract charges | | $ | 10 | | | $ | 13 | | | $ | 15 | |
| Net investment income | | 761 | | | 917 | | | 1,096 | |
| Realized capital gains (losses) | | 279 | | | 346 | | | (166) | |
| Total revenues | | 1,050 | | | 1,276 | | | 945 | |
| | | | | | |
| Costs and expenses | | | | | | |
| Contract benefits | | (763) | | | (583) | | | (569) | |
| Interest credited to contractholder funds | | (276) | | | (307) | | | (334) | |
| Amortization of DAC | | (4) | | | (7) | | | (7) | |
| Operating costs and expenses | | (25) | | | (29) | | | (31) | |
| Restructuring and related charges | | (2) | | | (1) | | | — | |
| Total costs and expenses | | (1,070) | | | (927) | | | (941) | |
| | | | | | |
| Gain on disposition of operations | | 4 | | | 6 | | | 6 | |
| Income tax benefit (expense) | | 7 | | | (73) | | | 66 | |
| Net (loss) income applicable to common shareholders | | $ | (9) | | | $ | 282 | | | $ | 76 | |
| | | | | | |
| Adjusted net (loss) income | | $ | (53) | | | $ | 10 | | | $ | 131 | |
| Realized capital gains (losses), after-tax | | 221 | | | 274 | | | (131) | |
| Valuation changes on embedded derivatives that are not hedged, after-tax | | (2) | | | (6) | | | 3 | |
| Premium deficiency for immediate annuities, after-tax | | (178) | | | — | | | — | |
| | | | | | |
| Gain on disposition of operations, after-tax | | 3 | | | 4 | | | 4 | |
| Tax Legislation benefit | | — | | | — | | | 69 | |
| Net (loss) income applicable to common shareholders | | $ | (9) | | | $ | 282 | | | $ | 76 | |
| | | | | | |
| Reserve for life-contingent contract benefits as of December 31 | | $ | 8,985 | | | $ | 8,530 | | | $ | 8,524 | |
| | | | | | |
| Contractholder funds as of December 31 | | $ | 8,343 | | | $ | 8,972 | | | $ | 9,817 | |
| | | | | | |
| Policies in force as of December 31 (in thousands) | | | | | | |
| Deferred annuities | | 104 | | | 114 | | | 127 | |
| Immediate annuities | | 73 | | | 78 | | | 84 | |
| Total | | 177 | | | 192 | | | 211 | |
Net loss applicable to common shareholders was $9 million in 2020 compared to net income of $282 million in 2019. Net loss in 2020 includes a $178 million, after-tax, ($225 million, pre-tax) premium deficiency for immediate annuities with life contingencies recognized in the third quarter.
We periodically review the adequacy of reserves for immediate annuities with life contingencies using actual experience and current assumptions. In the event actual experience and current assumptions are adverse compared to the original assumptions and a
premium deficiency is determined to exist, the establishment of a premium deficiency reserve (“PDR”) is required.
In third quarter 2020, our long-term investment yield assumption was lowered, which resulted in the prior sufficiency changing to a deficiency. The deficiency was recognized as an increase in the reserve for life-contingent contract benefits. The original assumptions used to establish reserves were updated to reflect current assumptions, and the primary changes included mortality expectations, where
The Allstate Corporation 79
2020 Form 10-K Allstate Annuities
annuitants are living longer than originally anticipated, and long-term investment yields.
Our annual review of assumptions in 2020 also resulted in a $5 million increase in reserves primarily for guaranteed withdrawal benefits on equity-indexed annuities due to higher projected guaranteed benefits. In 2019, the review resulted in no adjustment to reserves for guaranteed benefits.
Adjusted net loss was $53 million in 2020 compared to adjusted net income of $10 million in 2019, primarily due to lower net investment income, partially offset by lower contract benefits.
Net investment income decreased 17.0% or $156 million in 2020 compared to 2019, primarily due to a decline in market-based income driven by lower interest-bearing portfolio yields as well as lower performance-based investment results and lower average investment balances.
The investment portfolio supporting immediate annuities is managed to ensure the assets match the characteristics of the liabilities and provide the long-term returns needed to support this business. To better match the long-term nature of our immediate annuities, we use performance-based investments in which we have ownership interests, and a greater proportion of return is derived from idiosyncratic asset or operating performance. Performance-based income can vary significantly between periods and is influenced by economic conditions, equity market performance, comparable public company earnings multiples, capitalization rates, operating performance of the underlying investments and the timing of asset sales.
Net realized capital gains in 2020 primarily related to increased valuation of equity investments. Net
realized capital gains in 2019 primarily related to increased valuation of equity investments and gains on sales of fixed income securities.
Contract benefits increased 30.9% or $180 million in 2020 compared to 2019, primarily due to the premium deficiency for immediate annuities, partially offset by immediate annuity mortality experience that was favorable in comparison to the prior year.
Benefit spread reflects our mortality results using the difference between contract charges earned and contract benefits excluding the portion related to the implied interest on immediate annuities with life contingencies. This implied interest totaled $494 million and $479 million in 2020 and 2019, respectively. Total benefit spread was $(260) million and $(95) million in 2020 and 2019, respectively.
Interest credited to contractholder funds decreased 10.1% or $31 million in 2020 compared to 2019, primarily due to lower average contractholder funds.
Valuation changes on derivatives embedded in equity-indexed annuity contracts that are not hedged increased interest credited to contractholder funds by $3 million in 2020 compared to an increase of $8 million in 2019. These valuation changes are primarily driven by changes in interest rates.
Investment spread reflects the difference between net investment income and the sum of interest credited to contractholder funds and the implied interest on immediate annuities with life contingencies, which is included as a component of contract benefits and is used to analyze the impact of net investment income and interest credited to contractholders on net income.
| | | | | | | | | | | | | | | | | | | | |
Investment spread |
| | For the years ended December 31, |
| ($ in millions) | | 2020 | | 2019 | | 2018 |
| Investment spread before valuation changes on embedded derivatives that are not hedged | | $ | (6) | | | $ | 139 | | | $ | 267 | |
| Valuation changes on derivatives embedded in equity-indexed annuity contracts that are not hedged | | (3) | | | (8) | | | 3 | |
| Total investment spread | | $ | (9) | | | $ | 131 | | | $ | 270 | |
Investment spread before valuation changes on embedded derivatives that are not hedged decreased $145 million in 2020 compared to 2019, primarily due to lower investment income, partially offset by lower interest credited to contractholder funds.
To further analyze investment spreads, the following table summarizes the weighted average investment yield on assets supporting product liabilities, interest crediting rates and investment spreads. Investment spreads may vary significantly between periods due to the variability in investment income, particularly for immediate fixed annuities where the investment portfolio includes performance-based investments.
| | | | | | | | | | | | | | | | | | | | | | | | | | | | | | | | | | | | | | | | | | | | | | | | | | | | | | | | |
Analysis of investment spread |
| | Weighted average investment yield | | Weighted average interest crediting rate | | Weighted average investment spreads |
| | 2020 | | 2019 | | 2018 | | 2020 | | 2019 | | 2018 | | 2020 | | 2019 | | 2018 |
| Deferred fixed annuities | | 4.0 | % | | 4.3 | % | | 4.1 | % | | 2.7 | % | | 2.7 | % | | 2.8 | % | | 1.3 | % | | 1.6 | % | | 1.3 | % |
| Immediate fixed annuities with and without life contingencies | | 4.2 | | | 5.0 | | | 6.4 | | | 6.1 | | | 5.9 | | | 6.0 | | | (1.9) | | | (0.9) | | | 0.4 | |
Allstate Annuities 2020 Form 10-K
The following table summarizes the weighted average guaranteed crediting rates and weighted average current crediting rates as of December 31, 2020 for certain fixed annuities where management has the ability to change the crediting rate, subject to a contractual minimum. Other products, including equity-indexed, variable and immediate annuities totaling $3.87 billion of contractholder funds, have been excluded from the analysis because management does not have the ability to change the crediting rate or the minimum crediting rate is not considered meaningful in this context.
| | | | | | | | | | | | | | | | | | | | |
| Weighted average guaranteed crediting rates and weighted average current crediting rates |
| ($ in millions) | | Weighted average guaranteed crediting rates | | Weighted average current crediting rates | | Contractholder
funds |
| Annuities with annual crediting rate resets | | 3.17 | % | | 3.17 | % | | $ | 3,950 | |
Annuities with multi-year rate guarantees (1): | | | | | | |
| Resettable in next 12 months | | 2.18 | | | 2.67 | | | 103 | |
| Resettable after 12 months | | 2.29 | | | 2.63 | | | 425 | |
| | | | | | |
(1)These contracts include interest rate guarantee periods, the majority of which are 5 years.
Operating costs and expenses decreased 13.8% or $4 million in 2020 compared to 2019, primarily due to lower technology and employee-related costs. In July 2020, we entered into an agreement to transition the servicing of annuities to a third-party administrator. The migration is expected to be completed by the end of 2022. Restructuring charges were recorded in the third quarter of 2020 related to employee severance costs in connection with the migration.
Analysis of reserves and contractholder funds
| | | | | | | | | | | | | | | | |
Product liabilities | | |
| | As of December 31, | | |
| ($ in millions) | | 2020 | | 2019 | | |
| Immediate fixed annuities with life contingencies | | | | | | |
Sub-standard structured settlements and group pension terminations (1) | | $ | 5,780 | | | $ | 5,085 | | | |
Standard structured settlements and SPIA (2) | | 3,138 | | | 3,367 | | | |
| Other | | 67 | | | 78 | | | |
| Reserve for life-contingent contract benefits | | $ | 8,985 | | | $ | 8,530 | | | |
| | | | | | |
| | | | | | |
| Deferred fixed annuities | | $ | 6,033 | | | $ | 6,499 | | | |
| Immediate fixed annuities without life contingencies | | 2,163 | | | 2,346 | | | |
| Other | | 147 | | | 127 | | | |
| Contractholder funds | | $ | 8,343 | | | $ | 8,972 | | | |
(1)Comprises structured settlement annuities for annuitants with severe injuries or other health impairments which increased their expected mortality rate at the time the annuity was issued (“sub-standard structured settlements”) and group annuity contracts issued to sponsors of terminated pension plans.
(2)Comprises structured settlement annuities for annuitants with standard life expectancy (“standard structured settlements”) and single premium immediate annuities (“SPIA”) with life contingencies.
The Allstate Corporation 81
2020 Form 10-K Allstate Annuities
Contractholder funds represent interest-bearing liabilities arising from the sale of products such as fixed annuities. The balance of contractholder funds is equal to the cumulative deposits received and interest credited to the contractholder less cumulative contract benefits, surrenders, withdrawals and contract charges for mortality or administrative expenses.
| | | | | | | | | | | | | | | | | | | | |
Changes in contractholder funds |
| | For the years ended December 31, |
| ($ in millions) | | 2020 | | 2019 | | 2018 |
| Contractholder funds, beginning balance | | $ | 8,972 | | | $ | 9,817 | | | $ | 10,936 | |
| | | | | | |
| | | | | | |
| | | | | | |
| Deposits | | 20 | | | 16 | | | 15 | |
| | | | | | |
| Interest credited | | 273 | | | 304 | | | 331 | |
| | | | | | |
| Benefits, withdrawals and other adjustments | | | | | | |
| Benefits | | (511) | | | (547) | | | (587) | |
| Surrenders and partial withdrawals | | (442) | | | (602) | | | (854) | |
| | | | | | |
| Contract charges | | (9) | | | (9) | | | (9) | |
| | | | | | |
Other adjustments (1) | | 40 | | | (7) | | | (15) | |
| Total benefits, withdrawals and other adjustments | | (922) | | | (1,165) | | | (1,465) | |
| Contractholder funds, ending balance | | $ | 8,343 | | | $ | 8,972 | | | $ | 9,817 | |
(1)The table above illustrates the changes in contractholder funds, which are presented gross of reinsurance recoverables on the Consolidated Statements of Financial Position. The table above is intended to supplement our discussion and analysis of revenues, which are presented net of reinsurance on the Consolidated Statements of Operations. As a result, the net change in contractholder funds associated with products reinsured is reflected as a component of the other adjustments line.
Contractholder funds decreased 7.0% in 2020, primarily due to the continued runoff of our deferred fixed annuity business. We discontinued the sale of annuities but still accept additional deposits on existing contracts.
Surrenders and partial withdrawals decreased 26.6% or $160 million in 2020 compared to 2019. 2018 had elevated surrenders on fixed annuities resulting from an increased number of contracts reaching the 30-45 day period during which there is no surrender charge. The surrender and partial withdrawal rate on deferred fixed annuities, based on the beginning of year contractholder funds, was 7.5% in 2020 compared to 9.2% in 2019.
Allstate Annuities reinsurance ceded
We ceded substantially all of the risk associated with our variable annuity business to Prudential Insurance Company of America (“Prudential”). Our reinsurance recoverables from Prudential totaled $1.28 billion and $1.29 billion as of December 31, 2020 and 2019, respectively. We also have reinsurance recoverables from other reinsurers of $14 million and $17 million as of December 31, 2020 and 2019, respectively. As of December 31, 2020, the allowance for expected credit losses was $5 million. There was no valuation allowance as of December 31, 2019.
We retain primary liability as a direct insurer for all risks ceded to reinsurers. We continuously monitor the creditworthiness of reinsurers in order to determine our risk of recoverability on an individual and aggregate basis. In connection with the adoption of the measurement of credit losses on financial instruments accounting standard in 2020, the method of calculating the allowance for reinsurance recoverables changed. See Note 2 of the consolidated financial statements for additional details. No reinsurance recoverables have been written off in the three-years ended December 31, 2020.
Investments 2020 Form 10-K
Investments
Overview and strategy The return on our investment portfolios is an important component of our ability to offer good value to customers, fund business improvements and create value for shareholders. Investment portfolios are held for Property-Liability, Protection Services, Allstate Life, Allstate Benefits, Allstate Annuities, and Corporate and Other operations. While taking into consideration the investment portfolio in aggregate, management of the underlying portfolios is significantly influenced by the nature of each respective business and its corresponding liability profile. For each business, we identify a strategic asset allocation which considers both the nature of the liabilities and the risk and return characteristics of the various asset classes in which we invest. This allocation is informed by our long-term business and market expectations, as well as other considerations such as risk appetite, portfolio diversification, duration, desired liquidity and capital. Within appropriate ranges relative to strategic allocations, tactical allocations are made in consideration of prevailing and potential future market conditions. We manage risks that involve uncertainty related to interest rates, credit spreads, equity returns and currency exchange rates.
The Property-Liability portfolio emphasizes protection of principal and consistent income generation, within a total return framework. This approach has produced competitive returns over the long term and is designed to ensure financial strength and stability for paying claims, while maximizing economic value and surplus growth. Products with lower liquidity needs, such as auto insurance and discontinued lines and coverages, and capital create capacity to invest in less liquid higher yielding fixed income securities, performance-based investments such as limited partnerships and equity securities. Products with higher liquidity needs, such as homeowners insurance, are invested primarily in high quality liquid fixed income securities.
The Protection Services portfolio is focused on protection of principal and consistent income generation, within a total return framework. The portfolio is largely comprised of fixed income securities with a lesser allocation to equity securities and short-term investments.
The Allstate Life portfolio is comprised of assets chosen to generate returns to support corresponding liabilities within an asset-liability framework that targets an appropriate return on capital. This portfolio is well diversified and primarily consists of longer duration fixed income securities and commercial mortgage loans.
The Allstate Benefits portfolio is focused on protection of principal and consistent income generation while targeting an appropriate return on capital. The portfolio is largely comprised of fixed income securities and commercial mortgage loans with a small allocation to equity securities.
The Allstate Annuities portfolio is managed to ensure the assets match the characteristics of the liabilities. For longer-term immediate annuity liabilities,
we invest primarily in performance-based investments such as limited partnerships and equity securities. For shorter-term annuity liabilities, we invest primarily in fixed income securities and commercial mortgage loans with maturity profiles aligned with liability cash flow requirements.
The pending sale of ALIC and certain affiliates is expected to decrease Allstate Life, Allstate Annuities and total consolidated portfolios by approximately 85%, 80% and 30%, respectively.
The Corporate and Other portfolio balances liquidity needs related to the corporate capital structure with the pursuit of returns.
Within each segment, we utilize two primary strategies to manage risks and returns and to position our portfolio to take advantage of market opportunities while attempting to mitigate adverse effects. As strategies and market conditions evolve, the asset allocation may change or assets may be moved between strategies.
Market-based strategy includes investments primarily in public fixed income and equity securities. It seeks to deliver predictable earnings aligned to business needs and take advantage of short-term opportunities primarily through public and private fixed income investments and public equity securities.
Performance-based strategy seeks to deliver attractive risk-adjusted returns and supplement market risk with idiosyncratic risk. Returns are impacted by a variety of factors including general macroeconomic and public market conditions as public benchmarks are often used in the valuation of underlying investments. Variability in earnings will also result from the performance of the underlying assets or business and the timing of sales of those investments. Earnings from the sales of investments may be recorded as net investment income or realized capital gains and losses. The portfolio, which primarily includes private equity and real estate with a majority being limited partnerships, is diversified across a number of characteristics, including managers or partners, vintage years, strategies, geographies (including international) and industry sectors or property types. These investments are generally illiquid in nature, often require specialized expertise, typically involve a third-party manager, and often enhance returns and income through transformation at the company or property level. A portion of these investments seek returns in markets or asset classes that are dislocated or special situations, primarily in private markets.
The Allstate Corporation 83
2020 Form 10-K Investments
Coronavirus impacts
Ongoing uncertainty related to the future path of the pandemic has and may continue to create market volatility that has impacted the valuations, liquidity, prospects and risks of fixed income securities, equity securities and performance-based investments, primarily limited partnership interests, during 2020. Fixed income securities in certain sectors such as energy, automotive, retail, travel, lodging and airlines were negatively impacted. Although fixed income and equity security values generally increased since the first quarter, future investment results will depend on developments, including the duration and spread of the outbreak, preventive measures to combat the spread of the virus, and capital market conditions, including the pace of economic recovery and effectiveness of the fiscal and monetary policy responses. During the second quarter of 2020, short-term loan modifications were executed to grant temporary partial deferral of payments on $274 million of commercial mortgage loans with $2 million of modified payments outstanding as of December 31, 2020.
The ongoing impact of the Coronavirus on financial markets and the overall economy remain uncertain.
Some of the restrictions implemented to contain the pandemic have been relaxed, but reduced economic activity, limits on large gatherings and events and higher unemployment continue. Additionally, there is no way of predicting with certainty how long the pandemic might last, including the potential for restrictions being restored or new restrictions being implemented that could result in further economic volatility.
Impact of Low Interest Rate Environment
In January 2021, the Federal Open Market Committee (“FOMC”) maintained the target range for federal funds rate at 0 percent to 1/4 percent. The FOMC noted that the ongoing public health crisis will continue to weigh on economic activity, employment and inflation and poses considerable risks to the economic outlook. The FOMC expects to maintain this target range until labor market conditions have reached levels consistent with the Committee’s assessments of maximum employment and inflation has risen to 2 percent and is on track to moderately exceed 2 percent for some time.
| | | | | | | | | | | | | | | | | | | | | | | | | | |
Contractual maturities and yields of fixed income securities and mortgage loans for the next three years |
| | Fixed income securities | | Mortgage loans |
| ($ in millions) | | Carrying value | | Investment yield | | Carrying value | | Investment yield |
| 2021 | | $ | 3,136 | | | 3.8 | % | | $ | 277 | | | 4.5 | % |
| 2022 | | 5,317 | | | 2.9 | | | 388 | | | 4.3 | |
| 2023 | | 6,373 | | | 2.9 | | | 556 | | | 4.4 | |
Investing activity will continue to decrease our portfolio yield as long as market yields remain below the current portfolio yield. Any decline in market-based portfolio yield is expected to result in lower net investment income in future periods. Interest-bearing investments are comprised of fixed income securities, mortgage loans, short-term investments and other investments, including bank and agent loans.
In the Allstate Annuities segment, the decline in the portfolio yield has been partially mitigated because a portion of the investment cash flows have been used to fund the managed reduction in spread-based liabilities. The decline in market-based portfolio yield and Allstate Annuities invested assets are expected to result in lower net investment income in future periods.
Investments Outlook
We plan to focus on the following priorities:
•Enhance investment portfolio returns through use of a dynamic capital allocation framework and focus on tax efficiency.
•Leverage our broad capabilities to shift the portfolio mix to earn higher risk-adjusted returns on capital.
•Invest for the specific needs and characteristics of Allstate’s businesses, including its corresponding liability profile.
We continue to increase performance-based investments in our Property-Liability portfolio, consistent with our ongoing strategy to have a greater proportion of return derived from idiosyncratic asset or operating performance.
Invested assets and market-based income are expected to decline with reductions in contractholder funds for the Allstate Annuities segment.
Income related to performance-based investments will result in variability of earnings for the Property-Liability and Allstate Annuities portfolios.
Investments 2020 Form 10-K
| | | | | | | | | | | | | | | | | | | | | | | | | | | | | | | | | | | | | | | | | | | | | | |
Portfolio composition and strategy by reporting segment (1) | | |
| | As of December 31, 2020 | | |
| ($ in millions) | | Property-Liability | | Protection Services | | Allstate Life | | Allstate Benefits | | Allstate Annuities | | Corporate and Other | | Total | | |
Fixed income securities (2) | | $ | 38,793 | | | $ | 1,604 | | | $ | 9,076 | | | $ | 1,485 | | | $ | 14,713 | | | $ | 683 | | | $ | 66,354 | | | |
Equity securities (3) | | 2,598 | | | 97 | | | 133 | | | 132 | | | 1,409 | | | 341 | | | 4,710 | | | |
| Mortgage loans, net | | 568 | | | — | | | 1,476 | | | 178 | | | 1,853 | | | — | | | 4,075 | | | |
| Limited partnership interests | | 4,563 | | | — | | | — | | | — | | | 3,046 | | | — | | | 7,609 | | | |
Short-term investments (4) | | 2,104 | | | 121 | | | 367 | | | 36 | | | 626 | | | 4,546 | | | 7,800 | | | |
| Other, net | | 1,508 | | | — | | | 1,354 | | | 181 | | | 644 | | | 2 | | | 3,689 | | | |
| Total | | $ | 50,134 | | | $ | 1,822 | | | $ | 12,406 | | | $ | 2,012 | | | $ | 22,291 | | | $ | 5,572 | | | $ | 94,237 | | | |
| | | | | | | | | | | | | | | | |
| Percent to total | | 53.2 | % | | 1.9 | % | | 13.2 | % | | 2.1 | % | | 23.7 | % | | 5.9 | % | | 100.0 | % | | |
| | | | | | | | | | | | | | | | |
| | | | | | | | | | | | | | | | |
| | | | | | | | | | | | | | | | |
| Market-based | | $ | 44,712 | | | $ | 1,822 | | | $ | 12,406 | | | $ | 2,012 | | | $ | 18,963 | | | $ | 5,570 | | | $ | 85,485 | | | |
| Performance-based | | 5,422 | | | — | | | — | | | — | | | 3,328 | | | 2 | | | 8,752 | | | |
| Total | | $ | 50,134 | | | $ | 1,822 | | | $ | 12,406 | | | $ | 2,012 | | | $ | 22,291 | | | $ | 5,572 | | | $ | 94,237 | | | |
(1)Balances reflect the elimination of related party investments between segments.
(2)Fixed income securities are carried at fair value. Amortized cost, net for these securities was $36.52 billion, $1.51 billion, $8.05 billion, $1.36 billion, $13.37 billion, $642 million and $61.45 billion for Property-Liability, Protection Services, Allstate Life, Allstate Benefits, Allstate Annuities, Corporate and Other, and in total, respectively.
(3)Equity securities are carried at fair value. The fair value of equity securities, held as of December 31, 2020, was $857 million in excess of cost. These net gains were primarily concentrated in the technology and consumer goods sectors and in equity index funds. Equity securities include $1.29 billion of funds with underlying investments in fixed income securities as of December 31, 2020.
(4)Short-term investments are carried at fair value.
Investments totaled $94.24 billion as of December 31, 2020, increasing from $88.36 billion as of December 31, 2019, primarily due to higher fixed income valuations, positive operating cash flows and issuance of senior
debt, partially offset by common share repurchases, dividends paid to shareholders, net reductions in contractholder funds and repayment of preferred stock.
| | | | | | | | | | | | | | | | | | | | | | | | |
Portfolio composition by investment strategy |
| | | | | | As of December 31, 2020 |
| ($ in millions) | | | | | | Market-
based | | Performance-based | | Total |
| Fixed income securities | | | | | | $ | 66,242 | | | $ | 112 | | | $ | 66,354 | |
| Equity securities | | | | | | 4,342 | | | 368 | | | 4,710 | |
| Mortgage loans, net | | | | | | 4,075 | | | — | | | 4,075 | |
| Limited partnership interests | | | | | | 410 | | | 7,199 | | | 7,609 | |
| Short-term investments | | | | | | 7,800 | | | — | | | 7,800 | |
| Other, net | | | | | | 2,616 | | | 1,073 | | | 3,689 | |
| Total | | | | | | $ | 85,485 | | | $ | 8,752 | | | $ | 94,237 | |
| | | | | | | | | | |
| Percent to total | | | | | | 90.7 | % | | 9.3 | % | | 100.0 | % |
| | | | | | | | | | |
| Unrealized net capital gains and losses | | | | | | | | | | |
| Fixed income securities | | | | | | $ | 4,901 | | | $ | 2 | | | $ | 4,903 | |
| | | | | | | | | | |
| | | | | | | | | | |
| Limited partnership interests | | | | | | — | | | (4) | | | (4) | |
| | | | | | | | | | |
| Other | | | | | | (3) | | | — | | | (3) | |
| Total | | | | | | $ | 4,898 | | | $ | (2) | | | $ | 4,896 | |
During 2020, strategic actions focused on optimizing portfolio yield, return and risk in the low interest rate environment.
We continued to increase performance-based investments in the Property-Liability portfolio.
We increased the maturity profile of fixed income securities in our Allstate Life and Allstate Annuities portfolios to a duration of 6.4 years and 5.3 years, respectively, while maintaining duration at 5.0 years in our Property-Liability portfolio.
In the Allstate Annuities portfolio, invested assets and market-based income declined with reductions in contractholder funds. Performance-based investments and equity securities will continue to be allocated primarily to the longer-term immediate annuity liabilities to reduce the risk that investment returns are below levels required to meet their funding needs while shorter-term annuity liabilities will be invested in market-based investments.
The Allstate Corporation 85
2020 Form 10-K Investments
| | | | | | | | | | | | | | | | | | |
Fixed income securities by type | | |
| | Fair value as of December 31, | | |
| ($ in millions) | | 2020 | | | | 2019 | | |
| U.S. government and agencies | | $ | 3,222 | | | | | $ | 5,086 | | | |
| Municipal | | 9,587 | | | | | 8,620 | | | |
| Corporate | | 51,142 | | | | | 43,078 | | | |
| Foreign government | | 1,055 | | | | | 979 | | | |
| Asset-backed securities (“ABS”) | | 1,270 | | | | | 862 | | | |
| Mortgage-backed securities (“MBS”) | | 78 | | | | | 419 | | | |
| Total fixed income securities | | $ | 66,354 | | | | | $ | 59,044 | | | |
Fixed income securities are rated by third-party credit rating agencies or are internally rated. As of December 31, 2020, 86.4% of the consolidated fixed income securities portfolio was rated investment grade, which is defined as a security having a rating of Aaa, Aa, A or Baa from Moody’s, a rating of AAA, AA, A or BBB from S&P, a comparable rating from another nationally recognized rating agency, or a comparable internal rating if an externally provided rating is not available. Credit ratings below these designations are considered lower credit quality or below investment grade, which includes high yield bonds. Market prices for certain securities may have credit spreads which imply higher or lower credit quality than the current third-party rating. Our initial investment decisions and ongoing
monitoring procedures for fixed income securities are based on a due diligence process which includes, but is not limited to, an assessment of the credit quality, sector, structure and liquidity risks of each issue.
Fixed income portfolio monitoring is a comprehensive process to identify and evaluate each fixed income security that may require a credit loss allowance. The process includes a quarterly review of all securities to identify instances where the fair value of a security compared to its amortized cost is below internally established thresholds. For further detail on our fixed income portfolio monitoring process, see Note 5 of the consolidated financial statements.
| | | | | | | | | | | | | | | | | | | | | | | | | | | | | | | | | | | | | | |
Fair value and unrealized net capital gains (losses) for fixed income securities by credit rating |
| | December 31, 2020 |
| | A and above | | BBB | | BB |
| ($ in millions) | | Fair value | | Unrealized gain (loss) | | Fair value | | Unrealized gain (loss) | | Fair value | | Unrealized gain (loss) |
| U.S. government and agencies | | $ | 3,222 | | | $ | 93 | | | $ | — | | | $ | — | | | $ | — | | | $ | — | |
| Municipal | | 9,246 | | | 794 | | | 294 | | | 35 | | | 5 | | | 1 | |
| Corporate | | | | | | | | | | | | |
| Public | | 13,902 | | | 1,233 | | | 19,071 | | | 1,604 | | | 2,894 | | | 219 | |
| Privately placed | | 4,121 | | | 316 | | | 5,194 | | | 343 | | | 2,763 | | | 115 | |
| Total corporate | | 18,023 | | | 1,549 | | | 24,265 | | | 1,947 | | | 5,657 | | | 334 | |
| Foreign government | | 1,039 | | | 41 | | | 11 | | | 1 | | | 5 | | | — | |
| ABS | | 1,165 | | | 8 | | | 18 | | | (2) | | | 17 | | | — | |
| MBS | | 44 | | | 3 | | | 25 | | | — | | | 2 | | | — | |
| Total fixed income securities | | $ | 32,739 | | | $ | 2,488 | | | $ | 24,613 | | | $ | 1,981 | | | $ | 5,686 | | | $ | 335 | |
| | | | | | | | | | | | |
| | B | | CCC and lower | | Total |
| | Fair value | | Unrealized gain (loss) | | Fair value | | Unrealized gain (loss) | | Fair value | | Unrealized gain (loss) |
| U.S. government and agencies | | $ | — | | | $ | — | | | $ | — | | | $ | — | | | $ | 3,222 | | | $ | 93 | |
| Municipal | | 11 | | | 1 | | | 31 | | | 4 | | | 9,587 | | | 835 | |
| Corporate | | | | | | | | | | | | |
| Public | | 531 | | | 7 | | | 46 | | | (1) | | | 36,444 | | | 3,062 | |
| Privately placed | | 2,348 | | | 66 | | | 272 | | | 14 | | | 14,698 | | | 854 | |
| Total corporate | | 2,879 | | | 73 | | | 318 | | | 13 | | | 51,142 | | | 3,916 | |
| Foreign government | | — | | | — | | | — | | | — | | | 1,055 | | | 42 | |
| ABS | | 13 | | | (1) | | | 57 | | | 5 | | | 1,270 | | | 10 | |
| MBS | | — | | | — | | | 7 | | | 4 | | | 78 | | | 7 | |
| Total fixed income securities | | $ | 2,903 | | | $ | 73 | | | $ | 413 | | | $ | 26 | | | $ | 66,354 | | | $ | 4,903 | |
Investments 2020 Form 10-K
Municipal bonds, including tax exempt and taxable securities, include general obligations of state and local issuers and revenue bonds.
Our practice for acquiring and monitoring municipal bonds is predominantly based on the underlying credit quality of the primary obligor. We currently rely on the primary obligor to pay all contractual cash flows and are not relying on bond insurers for payments. As a result of downgrades in the insurers’ credit ratings, the ratings of the insured municipal bonds generally reflect the underlying ratings of the primary obligor.
Corporate bonds include publicly traded and privately placed securities. Privately placed securities primarily consist of corporate issued senior debt securities that are negotiated with the borrower or are issued by public entities in unregistered form.
Our portfolio of privately placed securities is diversified by issuer, industry sector and country. The portfolio is made up of 561 issuers. Privately placed corporate obligations may contain structural security features such as financial covenants and call protections that provide investors greater protection against credit deterioration, reinvestment risk or fluctuations in interest rates than those typically found in publicly registered debt securities. Additionally, investments in these securities are made after due diligence of the issuer, typically including discussions with senior management and on-site visits to company facilities. Ongoing monitoring includes direct periodic dialogue with senior management of the issuer and continuous monitoring of operating performance and financial position. Every issue not rated by an independent rating agency is internally rated with a formal rating affirmation at least once a year. Liquidity of securities issued by public entities in unregistered form is similar to public debt markets.
Our corporate bonds portfolio includes $8.85 billion of below investment grade bonds, $5.38 billion of which are privately placed. These securities are diversified by issuer and industry sector. The below investment grade corporate bonds portfolio is made up of 378 issuers. We employ fundamental analyses of issuers and sectors along with macro and asset class views to identify investment opportunities. This results in a portfolio with broad exposure to the high yield market with an emphasis on idiosyncratic positions reflective of our views of market conditions and opportunities.
Foreign government securities include 90.8% of Canadian governmental and provincial securities (all of which are held by our Canadian companies), 8.6% backed by the U.S. government and 0.6% that are highly diversified in other foreign governments.
ABS and MBS are structured securities that are primarily collateralized by consumer or corporate borrowings and residential and commercial real estate loans. The cash flows from the underlying collateral paid to the securitization trust are generally applied in a pre-determined order and are designed so that each security issued by the trust, typically referred to as a “class”, qualifies for a specific original rating.
For example, the “senior” portion or “top” of the capital structure, or rating class, which would originally qualify for a rating of Aaa typically has priority in receiving principal repayments on the underlying collateral and retains this priority until the class is paid in full. In a sequential structure, underlying collateral principal repayments are directed to the most senior rated Aaa class in the structure until paid in full, after which principal repayments are directed to the next most senior Aaa class in the structure until it is paid in full. Senior Aaa classes generally share any losses from the underlying collateral on a pro-rata basis after losses are absorbed by classes with lower original ratings.
The payment priority and class subordination included in these securities serves as credit enhancement for holders of the senior or top portions of the structures. These securities continue to retain the payment priority features that existed at the origination of the securitization trust. Other forms of credit enhancement may include structural features embedded in the securitization trust, such as overcollateralization, excess spread and bond insurance. The underlying collateral may contain fixed interest rates, variable interest rates (such as adjustable rate mortgages), or both fixed and variable rate features.
ABS includes collateralized debt obligations, consumer and other ABS. Credit risk is managed by monitoring the performance of the underlying collateral. Many of the securities in the ABS portfolio have credit enhancement with features such as overcollateralization, subordinated structures, reserve funds, guarantees or insurance.
MBS includes residential mortgage-backed securities (“RMBS”) and commercial mortgage-backed securities (“CMBS”). RMBS is subject to interest rate risk, but unlike other fixed income securities, is additionally subject to prepayment risk from the underlying residential mortgage loans. RMBS consists of a U.S. agency portfolio having collateral issued or guaranteed by U.S. government agencies and a non-agency portfolio consisting of securities collateralized by Prime, Alt-A and Subprime loans. CMBS investments are primarily traditional conduit transactions collateralized by commercial mortgage loans and typically are diversified across property types and geographical area.
Equity securities primarily include common stocks, exchange traded and mutual funds, non-redeemable preferred stocks and real estate investment trust (“REIT”) equity investments. Certain exchange traded and mutual funds have fixed income securities as their underlying investments.
Mortgage loans mainly comprise loans secured by first mortgages on developed commercial real estate. Key considerations used to manage our exposure include property type and geographic diversification. For further detail on our mortgage loan portfolio, see Note 5 of the consolidated financial statements.
The Allstate Corporation 87
2020 Form 10-K Investments
Limited partnership interests include $6.13 billion of interests in private equity funds, $1.07 billion of interests in real estate funds and $410 million of interests in other funds as of December 31, 2020. We have commitments to invest additional amounts in limited partnership interests totaling $2.93 billion as of December 31, 2020.
| | | | | | | | |
| Private equity limited partnerships by sector |
| (% of carrying value) | | December 31, 2020 |
| Industrial | | 18.5 | % |
| Consumer staples | | 11.8 | |
| Consumer discretionary | | 10.8 | |
| Information technology | | 10.2 | |
| Utilities | | 10.1 | |
| Healthcare | | 9.6 | |
| Other | | 29.0 | |
| Total | | 100.0 | % |
| | | | | | | | |
| Real estate limited partnerships by sector |
| (% of carrying value) | | December 31, 2020 |
| Industrial | | 31.3 | % |
| Residential | | 23.9 | |
| Office | | 13.2 | |
| Other | | 31.6 | |
| Total | | 100.0 | % |
Short-term investments primarily comprise money market funds, commercial paper, U.S. Treasury bills and other short-term investments, including securities lending collateral of $1.24 billion.
Other investments primarily comprise $1.02 billion of bank loans, $974 million of real estate, $754 million of policy loans, $631 million of agent loans (loans issued to exclusive Allstate agents) and $204 million of derivatives as of December 31, 2020. For further detail on our use of derivatives, see Note 7 of the consolidated financial statements.
| | | | | | | | |
| Direct real estate investments by sector |
| (% of carrying value) | | December 31, 2020 |
| Residential | | 43.9 | % |
| Retail | | 14.2 | |
| Agriculture | | 12.6 | |
| Industrial | | 12.1 | |
| Timber | | 10.6 | |
| Other | | 6.6 | |
| Total | | 100.0 | % |
| | | | | | | | | | | | | | |
Unrealized net capital gains (losses) |
| | As of December 31, |
| ($ in millions) | | 2020 | | 2019 |
| U.S. government and agencies | | $ | 93 | | | $ | 115 | |
| Municipal | | 835 | | | 540 | |
| Corporate | | 3,916 | | | 1,988 | |
| Foreign government | | 42 | | | 11 | |
| ABS | | 10 | | | 2 | |
| MBS | | 7 | | | 95 | |
| | | | |
| | | | |
| | | | |
| Fixed income securities | | 4,903 | | | 2,751 | |
| Derivatives | | (3) | | | (3) | |
Equity method of accounting (“EMA”) limited partnerships | | (4) | | | (4) | |
| Unrealized net capital gains and losses, pre-tax | | $ | 4,896 | | | $ | 2,744 | |
| | | | |
| | | | |
| | | | |
| | | | |
| | | | |
Investments 2020 Form 10-K
| | | | | | | | | | | | | | | | | | | | | | | | | | |
Gross unrealized gains (losses) on fixed income securities by type and sector |
| | As of December 31, 2020 |
| | Amortized cost, net | | Gross unrealized | | Fair value |
| ($ in millions) | | | Gains | | Losses | |
| Corporate | | | | | | | | |
| Transportation | | | | | | | | |
| Airlines | | $ | 341 | | | $ | 12 | | | $ | (9) | | | $ | 344 | |
| Railroad and other | | 1,588 | | | 198 | | | (9) | | | 1,777 | |
| Total transportation | | 1,929 | | | 210 | | | (18) | | | 2,121 | |
| Banking | | 5,352 | | | 322 | | | (14) | | | 5,660 | |
| Energy | | | | | | | | |
| Midstream | | 1,662 | | | 128 | | | (1) | | | 1,789 | |
| Integrated | | 517 | | | 59 | | | — | | | 576 | |
| Independent/upstream | | 312 | | | 36 | | | (2) | | | 346 | |
| Other | | 240 | | | 16 | | | (4) | | | 252 | |
| Total energy | | 2,731 | | | 239 | | | (7) | | | 2,963 | |
| Financial services | | | | | | | | |
| Finance companies | | 494 | | | 31 | | | (4) | | | 521 | |
| Life insurance | | 903 | | | 64 | | | (1) | | | 966 | |
| Other | | 1,436 | | | 111 | | | (1) | | | 1,546 | |
| Total financial services | | 2,833 | | | 206 | | | (6) | | | 3,033 | |
| Utilities | | 5,948 | | | 622 | | | (6) | | | 6,564 | |
| Communications | | 3,691 | | | 328 | | | (6) | | | 4,013 | |
| Consumer goods | | | | | | | | |
| Cyclical | | | | | | | | |
| Automotive | | 1,706 | | | 109 | | | — | | | 1,815 | |
| Gaming, lodging, and leisure | | 711 | | | 44 | | | — | | | 755 | |
| Retailers | | 1,185 | | | 122 | | | — | | | 1,307 | |
| Restaurants | | 472 | | | 39 | | | — | | | 511 | |
| Other | | 1,078 | | | 84 | | | (1) | | | 1,161 | |
| Total cyclical | | 5,152 | | | 398 | | | (1) | | | 5,549 | |
| Non-cyclical | | 7,991 | | | 639 | | | (2) | | | 8,628 | |
| Total consumer goods | | 13,143 | | | 1,037 | | | (3) | | | 14,177 | |
| Capital goods | | 5,259 | | | 449 | | | (2) | | | 5,706 | |
| Technology | | 3,662 | | | 313 | | | (2) | | | 3,973 | |
| Basic industry | | 2,378 | | | 240 | | | (1) | | | 2,617 | |
| Other | | 300 | | | 15 | | | — | | | 315 | |
| Total corporate fixed income portfolio | | 47,226 | | | 3,981 | | | (65) | | | 51,142 | |
| U.S. government and agencies | | 3,129 | | | 94 | | | (1) | | | 3,222 | |
| Municipal | | 8,752 | | | 837 | | | (2) | | | 9,587 | |
| Foreign government | | 1,013 | | | 42 | | | — | | | 1,055 | |
| ABS | | 1,260 | | | 15 | | | (5) | | | 1,270 | |
| MBS | | 71 | | | 7 | | | — | | | 78 | |
| Total fixed income securities | | $ | 61,451 | | | $ | 4,976 | | | $ | (73) | | | $ | 66,354 | |
The Allstate Corporation 89
2020 Form 10-K Investments
| | | | | | | | | | | | | | | | | | | | | | | | | | |
Gross unrealized gains (losses) on fixed income securities by type and sector |
| | December 31, 2019 |
| | Amortized cost | | Gross unrealized | | Fair value |
| ($ in millions) | | | Gains | | Losses | |
| Corporate | | | | | | | | |
| Transportation | | | | | | | | |
| Airlines | | $ | 418 | | | $ | 12 | | | $ | — | | | $ | 430 | |
| Railroad and other | | 1,613 | | | 120 | | | — | | | 1,733 | |
| Total transportation | | 2,031 | | | 132 | | | — | | | 2,163 | |
| Banking | | 4,610 | | | 143 | | | (14) | | | 4,739 | |
| Energy | | | | | | | | |
| Midstream | | 1,570 | | | 77 | | | (4) | | | 1,643 | |
| Independent/upstream | | 422 | | | 19 | | | (10) | | | 431 | |
| Integrated | | 406 | | | 32 | | | — | | | 438 | |
| Other | | 237 | | | 11 | | | — | | | 248 | |
| Total energy | | 2,635 | | | 139 | | | (14) | | | 2,760 | |
| Financial services | | | | | | | | |
| Finance companies | | 582 | | | 24 | | | — | | | 606 | |
| Life insurance | | 725 | | | 30 | | | — | | | 755 | |
| Other | | 1,169 | | | 53 | | | (2) | | | 1,220 | |
| Total financial services | | 2,476 | | | 107 | | | (2) | | | 2,581 | |
| Utilities | | 5,197 | | | 385 | | | (6) | | | 5,576 | |
| Communications | | 2,721 | | | 158 | | | (2) | | | 2,877 | |
| Consumer goods | | | | | | | | |
| Cyclical | | | | | | | | |
| Gaming, lodging and leisure | | 596 | | | 28 | | | — | | | 624 | |
| Automotive | | 1,463 | | | 42 | | | (1) | | | 1,504 | |
| Retailers | | 920 | | | 52 | | | — | | | 972 | |
| Restaurants | | 390 | | | 19 | | | — | | | 409 | |
| Other | | 1,056 | | | 49 | | | (3) | | | 1,102 | |
| Total cyclical | | 4,425 | | | 190 | | | (4) | | | 4,611 | |
| Non-cyclical | | 7,112 | | | 316 | | | (1) | | | 7,427 | |
| Total consumer goods | | 11,537 | | | 506 | | | (5) | | | 12,038 | |
| Capital goods | | 4,945 | | | 229 | | | (1) | | | 5,173 | |
| Technology | | 2,765 | | | 112 | | | (1) | | | 2,876 | |
| Basic industry | | 1,897 | | | 114 | | | (2) | | | 2,009 | |
| Other | | 276 | | | 10 | | | — | | | 286 | |
| Total corporate fixed income portfolio | | 41,090 | | | 2,035 | | | (47) | | | 43,078 | |
| U.S. government and agencies | | 4,971 | | | 141 | | | (26) | | | 5,086 | |
| Municipal | | 8,080 | | | 551 | | | (11) | | | 8,620 | |
| Foreign government | | 968 | | | 16 | | | (5) | | | 979 | |
| ABS | | 860 | | | 8 | | | (6) | | | 862 | |
| MBS | | 324 | | | 96 | | | (1) | | | 419 | |
| Total fixed income securities | | $ | 56,293 | | | $ | 2,847 | | | $ | (96) | | | $ | 59,044 | |
In general, the gross unrealized losses are related to an increase in market yields, which may include increased risk-free interest rates and wider credit spreads since the time of initial purchase.
Similarly, gross unrealized gains reflect a decrease in market yields since the time of initial purchase.
Investments 2020 Form 10-K
| | | | | | | | | | | | | | | | | | | | | | | | | | | | | | | | | | | | | | |
| Equity securities by sector |
| ($ in millions) | | December 31, 2020 | | December 31, 2019 |
| Cost | | Over (under) cost | | Fair value | | Cost | | Over (under) cost | | Fair value |
| Energy | | $ | 112 | | | $ | 6 | | | $ | 118 | | | $ | 275 | | | $ | 15 | | | $ | 290 | |
| Utilities | | 53 | | | 13 | | | 66 | | | 116 | | | 38 | | | 154 | |
| Transportation | | 37 | | | 13 | | | 50 | | | 81 | | | 32 | | | 113 | |
| Capital goods | | 157 | | | 16 | | | 173 | | | 331 | | | 91 | | | 422 | |
| Basic industry | | 47 | | | 26 | | | 73 | | | 135 | | | 40 | | | 175 | |
Other (1) | | 1,260 | | | 549 | | | 1,809 | | | 2,526 | | | 1,062 | | | 3,588 | |
| Funds | | | | | | | | | | | | |
| Fixed income | | 1,228 | | | 65 | | | 1,293 | | | 1,727 | | | 62 | | | 1,789 | |
| Equities | | 959 | | | 169 | | | 1,128 | | | 1,377 | | | 254 | | | 1,631 | |
| Total funds | | 2,187 | | | 234 | | | 2,421 | | | 3,104 | | | 316 | | | 3,420 | |
| Total equity securities | | $ | 3,853 | | | $ | 857 | | | $ | 4,710 | | | $ | 6,568 | | | $ | 1,594 | | | $ | 8,162 | |
(1)Other is comprised of REITs, communications, financial services, banking, consumer goods and technology sectors.
| | | | | | | | | | | | | | | | | | | | |
Net investment income |
| | For the years ended December 31, |
($ in millions) | | 2020 | | 2019 | | 2018 |
| Fixed income securities | | $ | 2,136 | | | $ | 2,175 | | | $ | 2,077 | |
| Equity securities | | 98 | | | 206 | | | 170 | |
| Mortgage loans | | 220 | | | 220 | | | 217 | |
| Limited partnership interests | | 338 | | | 471 | | | 705 | |
| Short-term investments | | 23 | | | 102 | | | 73 | |
| Other | | 251 | | | 262 | | | 272 | |
| Investment income, before expense | | 3,066 | | | 3,436 | | | 3,514 | |
| Investment expense | | | | | | |
Investee level expenses (1) | | (59) | | | (81) | | | (71) | |
| Securities lending expense | | (6) | | | (40) | | | (28) | |
| Operating costs and expenses | | (148) | | | (156) | | | (175) | |
| Total investment expense | | (213) | | | (277) | | | (274) | |
Net investment income | | $ | 2,853 | | | $ | 3,159 | | | $ | 3,240 | |
| | | | | | |
| Market-based | | $ | 2,663 | | | $ | 2,893 | | | $ | 2,734 | |
| Performance-based | | 403 | | | 543 | | | 780 | |
Investment income, before expense | | $ | 3,066 | | | $ | 3,436 | | | $ | 3,514 | |
(1)Beginning January 1, 2020, depreciation previously included in investee level expenses is reported as realized capital gains or losses.
Net investment income decreased 9.7% or $306 million in 2020 compared to 2019, primarily due to a decline in market-based income driven by lower interest-bearing portfolio yields and lower performance-based results, primarily from limited partnerships.
The Allstate Corporation 91
2020 Form 10-K Investments
| | | | | | | | | | | | | | | | | | | | |
Performance-based investment income |
| | For the years ended December 31, |
| ($ in millions) | | 2020 | | 2019 | | 2018 |
| Limited partnerships | | | | | | |
| Private equity | | $ | 297 | | | $ | 330 | | | $ | 582 | |
| Real estate | | 38 | | | 138 | | | 123 | |
| Performance-based - limited partnerships | | 335 | | | 468 | | | 705 | |
| | | | | | |
| Non-limited partnerships | | | | | | |
| Private equity | | (12) | | | 9 | | | 9 | |
| Real estate | | 80 | | | 66 | | | 66 | |
| Performance-based - non-limited partnerships | | 68 | | | 75 | | | 75 | |
| | | | | | |
| Total | | | | | | |
| Private equity | | 285 | | | 339 | | | 591 | |
| Real estate | | 118 | | | 204 | | | 189 | |
| Total performance-based | | $ | 403 | | | $ | 543 | | | $ | 780 | |
| | | | | | |
Investee level expenses (1) | | $ | (55) | | | $ | (74) | | | $ | (64) | |
| | | | | | |
| | | | | | |
| | | | | | |
| | | | | | |
| | | | | | |
(1)Investee level expenses include depreciation and asset level operating expenses reported in investment expense. Beginning January 1, 2020, depreciation previously included in investee level expenses is reported as realized capital gains or losses.
Performance-based investment income decreased 25.8% or $140 million in 2020 compared to 2019, due to lower valuations of real estate and private equity investments, partially offset by net gains on sales of underlying investments.
Performance-based investment results and income can vary significantly between periods and are influenced by economic conditions, equity market performance, comparable public company earnings multiples, capitalization rates, operating performance of the underlying investments and the timing of asset sales.
| | | | | | | | | | | | | | | | | | | | |
Components of realized capital gains (losses) and the related tax effect |
| | For the year December 31, |
| ($ in millions) | | 2020 | | 2019 | | 2018 |
Sales (1) | | $ | 1,017 | | | 575 | | | $ | (215) | |
Credit losses (2) | | | | | | |
| Fixed income securities | | (5) | | | (14) | | | (10) | |
| | | | | | |
| Mortgage loans | | (38) | | | — | | | — | |
| Limited partnership interests | | (10) | | | (6) | | | (3) | |
| Other investments | | (27) | | | (27) | | | (1) | |
| Total credit losses | | (80) | | | (47) | | | (14) | |
| Valuation of equity investments - appreciation (decline): | | | | | | |
| Equity securities | | 321 | | | 1,117 | | | (567) | |
| Equity fund investments in fixed income securities | | 25 | | | 93 | | | (27) | |
Limited partnerships (3) | | 20 | | | 162 | | | (97) | |
| Total valuation of equity investments | | 366 | | | 1,372 | | | (691) | |
| Valuation and settlements of derivative instruments | | 53 | | | (15) | | | 43 | |
| Realized capital gains and losses, pre-tax | | 1,356 | | | 1,885 | | | (877) | |
| Income tax (expense) benefit | | (293) | | | (397) | | | 189 | |
| Realized capital gains and losses, after-tax | | $ | 1,063 | | | $ | 1,488 | | | $ | (688) | |
| | | | | | |
| | | | | | |
| | | | | | |
| | | | | | |
| | | | | | |
| | | | | | |
| | | | | | |
| | | | | | |
| Market-based | | $ | 1,288 | | | $ | 1,750 | | | $ | (946) | |
| Performance-based | | 68 | | | 135 | | | 69 | |
| Realized capital gains and losses, pre-tax | | $ | 1,356 | | | $ | 1,885 | | | $ | (877) | |
(1)Beginning January 1, 2020, depreciation previously included in investee level expenses is reported as realized capital gains or losses.
(2)Due to the adoption of the measurement of credit losses on financial instruments accounting standard, realized capital losses previously reported as other-than-temporary impairment write-downs are now presented as credit losses.
(3)Relates to limited partnerships where the underlying assets are predominately public equity securities.
Sales in 2020 related primarily to fixed income securities in connection with ongoing portfolio management. Sales in 2019 related primarily to fixed income securities in connection with ongoing portfolio management, as well as gains from limited partnerships.
Valuation and settlements of derivative instruments in 2020 primarily comprised gains on interest rate futures used for asset replication and equity futures used for risk management due to a decrease in indices in first quarter 2020,
Investments 2020 Form 10-K
partially offset by losses on interest rate futures used for risk management and foreign currency contracts due to weakening of the U.S. dollar in the second half of 2020. 2019 primarily comprised losses on equity options and futures used for risk management, partially offset by gains on interest rate futures and total return swaps used for asset replication due to increases in equity indices.
| | | | | | | | | | | | | | | | | | | | |
Realized capital gains (losses) for performance-based investments |
| | For the years ended December 31, |
| ($ in millions) | | 2020 | | 2019 | | 2018 |
Sales (1) | | $ | 39 | | | $ | 103 | | | $ | 7 | |
Credit losses (2) | | (10) | | | (6) | | | (3) | |
| Valuation of equity investments | | 60 | | | 31 | | | 36 | |
| Valuation and settlements of derivative instruments | | (21) | | | 7 | | | 29 | |
| Total performance-based | | $ | 68 | | | $ | 135 | | | $ | 69 | |
(1)Beginning January 1, 2020, depreciation previously included in investee level expenses is reported as realized capital gains or losses.
(2)Due to the adoption of the measurement of credit losses on financial instruments accounting standard, realized capital losses previously reported as other-than-temporary impairment write-downs are now presented as credit losses.
Realized capital gains for performance-based investments in 2020 primarily related to increased valuation of equity investments and gains on sales of real estate investments, partially offset by losses on valuation and settlement of derivative instruments. 2019 primarily related to gains on sales of investments in directly held real estate, a gain on the sale of a limited partnership and increased valuation of equity investments.
The Allstate Corporation 93
2020 Form 10-K Market Risk
Market Risk
Market risk is the risk that we will incur losses due to adverse changes in interest rates, credit spreads, equity prices, commodity prices or currency exchange rates. Adverse changes to these rates and prices may occur due to changes in fiscal policy, the economic climate, the liquidity of a market or market segment, insolvency or financial distress of key market makers or participants or changes in market perceptions of credit worthiness or risk tolerance. Our primary market risk exposures are to changes in interest rates, credit spreads and equity prices. We also have direct and indirect exposure to commodity price changes through our diversified investments in timber, agriculture, infrastructure and energy primarily held in limited partnership interests and consolidated subsidiaries.
The active management of market risk is integral to our results of operations. We may use the following approaches to manage exposure to market risk within defined tolerance ranges:
1)Rebalancing existing asset or liability portfolios
2)Changing the type of investments purchased in the future
3)Using derivative instruments to modify the market risk characteristics of existing assets and liabilities or assets expected to be purchased
Overview In formulating and implementing guidelines for investing funds, we seek to earn attractive risk-adjusted returns that enhance our ability to offer competitive rates and prices to customers while contributing to stable profits and long-term capital growth. Accordingly, our investment decisions and objectives are informed by the underlying risks and product profiles. Investment policies define the overall framework for managing market and other investment risks, including accountability and controls over risk management activities. Subsidiaries that conduct investment activities follow policies that have been approved by their respective boards of directors and which specify the investment limits and strategies that are appropriate given the liquidity, surplus, product profile and regulatory requirements of the subsidiary. Executive oversight of investment activities is conducted primarily through the subsidiaries’ boards of directors and legal entity investment committees. The Enterprise Risk and Return Council (“ERRC”) oversees the aggregate risk of Allstate and its subsidiaries. Working in conjunction with the board or the investment committee of each subsidiary, as applicable, the ERRC evaluates the risk tolerance of each subsidiary and determines the aggregate risk tolerance of the enterprise.
For life and annuity products, the asset-liability management (“ALM”) policies further define the overall framework for managing market and investment risks and are approved by the subsidiaries’ respective boards of directors. ALM focuses on strategies to enhance yields, mitigate market risks and optimize capital to improve profitability and returns while incorporating future expected cash requirements to repay liabilities. These ALM policies specify limits,
ranges or targets for investments that best meet business objectives in light of the unique demands and characteristics of the product liabilities and are intended to result in a prudent, methodical and effective adjudication of market risk and return. The pending sale of ALIC and certain affiliates is expected to decrease Allstate Life, Allstate Annuities and total consolidated portfolios by approximately 85%, 80% and 30%, respectively.
We use widely-accepted quantitative and qualitative approaches to measure, monitor and manage market risk. We evaluate our market risk exposure using multiple measures including but not limited to:
| | |
• Duration, a measure of the price sensitivity of assets and liabilities to changes in interest rates |
• Value-at-risk, a statistical estimate of the probability that the change in fair value of a portfolio will exceed a certain amount over a given time horizon |
• Scenario analysis, an estimate of the potential changes in the fair value of a portfolio that could occur under hypothetical market conditions defined by changes to multiple market risk factors: interest rates, credit spreads, equity prices or currency exchange rates |
• Sensitivity analysis, an estimate of the potential changes in the fair value of a portfolio that could occur using hypothetical shocks to a market risk factor.
The selection of measures used in our sensitivity analysis should not be construed as our prediction of future market events, but only as an illustration of the potential effect of such an event. |
In general, we establish investment portfolio asset allocation and market risk limits based upon a combination of these measures. The asset allocation limits place restrictions on the total funds that may be invested within an asset class. Comprehensive day-to-day management of market risk within defined tolerance ranges occurs as portfolio managers buy and sell within their respective markets based upon the acceptable boundaries established by investment policies. Although we apply a similar overall philosophy to market risk, the underlying business frameworks and the accounting and regulatory environments may differ between our products and therefore affect investment decisions and risk parameters.
Interest rate risk is the risk that we will incur a loss due to adverse changes in interest rates relative to the characteristics of our interest-bearing assets and liabilities. Interest rate risk includes risks related to changes in U.S. Treasury yields and other key risk-free reference yields. This risk arises from many of our primary activities, as we invest substantial funds in interest-sensitive assets and issue interest-sensitive liabilities. Changes in interest rates can have favorable and unfavorable effects on our results. For example, increases in rates can improve investment income, but decrease the fair value of our fixed income securities portfolio and increase policyholder surrenders requiring us to liquidate assets. Decreases in rates could increase the fair value of our fixed income securities portfolio while decreasing investment
Market Risk 2020 Form 10-K
income due to reinvesting at lower market yields and accelerating pay-downs and prepayments of certain investments.
For our corporate debt, we monitor market interest rates and evaluate refinancing opportunities as maturity dates approach. To mitigate this risk, we ladder the maturity dates of our debt. For our noncumulative perpetual preferred stock, we monitor market dividend rates and evaluate opportunities to redeem or refinance on or after specified dates. For further detail regarding our debt and our preferred stock, see Note 12 of the consolidated financial statements and the Capital Resources and Liquidity section of this Item.
We manage the interest rate risk in our assets relative to the interest rate risk in our liabilities and our assessment of overall economic and capital risk. One of the measures used to quantify this exposure is duration. The difference in the duration of our assets relative to our liabilities is our duration gap. To calculate the duration gap between assets and liabilities, we project asset and liability cash flows and calculate their net present value using a risk-free market interest rate adjusted for credit quality, sector attributes, liquidity and other specific risks. Duration is calculated by revaluing these cash flows at alternative interest rates and determining the percentage change in aggregate fair value. The cash flows used in this calculation include the expected maturity and repricing characteristics of our derivative financial instruments, all other financial instruments, and certain other items including unearned premiums, claims and claims expense reserves, annuity liabilities and other interest-sensitive liabilities.
The projections include assumptions (based upon historical market experience and our experience) that reflect the effect of changing interest rates on the prepayment, lapse, leverage or option features of instruments, where applicable. The preceding assumptions relate primarily to callable municipal and corporate bonds, fixed rate single and flexible premium deferred annuities, mortgage-backed securities and municipal housing bonds. Additionally, the calculations include assumptions regarding the renewal of property and casualty products.
As of December 31, 2020, the difference between our asset and liability duration was a (2.11) gap compared to a (1.48) gap as of December 31, 2019. The calculation excludes traditional and interest-sensitive life insurance and accident and health insurance products that are not considered financial instruments. A negative duration gap indicates that the fair value of our liabilities is more sensitive to interest rate movements than the fair value of our assets, while a positive duration gap indicates that the fair value of our assets is more sensitive to interest rate movements than the fair value of our liabilities. Due to the relatively short duration of our property and casualty liabilities, primarily related to auto and homeowners claims, the investments generally maintain a positive duration gap between assets and liabilities. In contrast, for our annuity products the
duration gap may be positive or negative as the assets and liabilities vary based on the characteristics of the products in-force and investing activity. As of December 31, 2020, property and casualty products had a positive duration gap while annuity products had a negative duration gap.
To reduce the risk that investment returns are below levels required to meet the funding needs of certain liabilities, we are executing our performance-based strategy that supplements market risk with idiosyncratic risk. We are using these investments, in addition to public equity securities, to support a portion of our property and casualty products and long-term annuity liabilities. Shorter-term annuity liabilities will continue to be invested in market-based investments to generate cash flows that will fund future claims, benefits and expenses, and that will earn stable returns across a wide variety of interest rate and economic scenarios. Performance-based investments and public equity securities are generally not interest-bearing; accordingly, using them to support interest-bearing liabilities contributes toward a negative duration gap.
| | | | | | | | | | | | | | |
Interest rate shock analysis (1) |
| | As of December 31, |
| ($ in millions) | | 2020 | | 2019 |
Increase in fair value of the assets net of liabilities (2) | | $ | 1,981 | | | $ | 1,209 | |
| | | | |
(1)Represents an immediate, parallel increase of 100 basis points based on information and assumptions used in the duration calculations and market interest rates as of December 31, 2020.
(2)Estimate excludes traditional and interest-sensitive life insurance and accident and health insurance products that are not considered financial instruments. The assets supporting these products totaled $12.58 billion and $12.14 billion as of December 31, 2020 and 2019, respectively. Based on assumptions described above, these assets would decrease in value by $673 million as of December 31, 2020 compared to a decrease of $649 million as of December 31, 2019.
To the extent that conditions differ from the assumptions we used in these calculations, duration and rate shock measures could be significantly impacted. Additionally, our calculations assume the current relationship between short-term and long-term interest rates (the term structure of interest rates) will remain constant over time. As a result, these calculations may not fully capture the effect of non-parallel changes in the term structure of interest rates or large changes in interest rates.
Credit spread risk is the risk that we will incur a loss due to adverse changes in credit spreads (“spreads”). Credit spread is the additional yield on fixed income securities and loans above the risk-free rate (typically referenced as the yield on U.S. Treasury securities) that market participants require to compensate them for assuming credit, liquidity or prepayment risks. The magnitude of the spread will depend on the likelihood that a particular issuer will default. This risk arises from many of our primary activities, as we invest substantial funds in spread-sensitive fixed income assets. We manage the spread
The Allstate Corporation 95
2020 Form 10-K Market Risk
risk in our assets. One of the measures used to quantify this exposure is spread duration. Spread duration measures the price sensitivity of the assets to changes in spreads. For example, if spreads increase 100 basis points, the fair value of an asset exhibiting a spread duration of 5 is expected to decrease in value by 5%.
Spread duration is calculated similarly to interest rate duration. As of December 31, 2020, the spread duration was 4.95 compared to 4.60 as of December 31, 2019.
| | | | | | | | | | | | | | |
Credit spread shock analysis (1) |
| | As of December 31, |
| ($ in millions) | | 2020 | | 2019 |
Decrease in net fair value of the assets (2) | | $ | 3,489 | | | $ | 2,877 | |
| | | | |
(1)Represents an immediate, parallel increase of 100 basis points across all asset classes, industry sectors and credit ratings based on information and assumptions used in the spread duration calculations and market interest rates as of December 31, 2020.
(2)Reflects effects of tactical positions that include the use of credit default swaps to manage spread risk.
Equity price risk is the risk that we will incur losses due to adverse changes in the general levels of the markets.
Equity investments As of December 31, 2020, we held $3.76 billion in equity securities, excluding those with fixed income securities as their underlying investments, and limited partnership interests where the underlying assets are predominately public equity securities, compared to $7.28 billion as of December 31, 2019. 62.6% of the common stocks and other investments with public equity risk supported property and casualty products as of December 31, 2020, compared to 80.4% as of December 31, 2019. As of December 31, 2020, these investments had an equity market portfolio beta of 1.07, compared to a beta of 1.02 as of December 31, 2019. Beta represents a widely used methodology to describe, quantitatively, an investment’s market risk characteristics relative to an index such as the Standard & Poor’s 500 Composite Price Index (“S&P 500”).
| | | | | | | | | | | | | | |
Change in S&P 500 by 10% |
| | As of December 31, |
| ($ in millions) | | 2020 | | 2019 |
| Change in net fair value of equity investments | | $ | 401 | | | $ | 742 | |
| | | | |
We periodically use put options to reduce equity price risk or call options to adjust our equity risk profile. Put options provide an offset to declines in equity market values below a targeted level, while call options provide participation in equity market appreciation above a targeted level. Options can expire, terminate early or the option can be exercised. If the equity index does not fall below the put’s strike price or rise above the call’s strike price, the maximum loss on purchased puts and calls is limited to the amount of the premium paid.
Limited partnership interests As of December 31, 2020, we held $7.20 billion in limited partnership interests excluding those limited partnership interests where the underlying assets are predominately public equity securities compared to $7.17 billion as of December 31, 2019. 60.5% of the limited partnership interests supported property and casualty products as of December 31, 2020, compared to 56.7% as of December 31, 2019. These investments are primarily comprised of private equity and real estate funds. These investments are idiosyncratic in nature and a greater portion of the return is derived from asset operating performance. They are not actively traded, and valuation changes typically reflect the performance of the underlying asset.
| | | | | | | | | | | | | | |
Change in private market valuations by 10% |
| | As of December 31, |
| ($ in millions) | | 2020 | | 2019 |
| Change in net fair value of limited partnership interests | | $ | 720 | | | $ | 717 | |
| | | | |
For limited partnership interests, quarterly changes in fair values may not be highly correlated to equity indices in the short term and changes in value of these investments are generally recognized on a three-month delay due to the availability of the related investee financial statements. The illustrations noted above may not reflect our actual experience if the future composition of the portfolio (hence its beta) and correlation relationships differ from the historical relationships.
Separate Accounts As of December 31, 2020 and 2019, we had separate account assets related to variable annuity and variable life contracts with account values totaling $3.34 billion and $3.04 billion, respectively. Equity risk exists for contract charges based on separate account balances and guarantees for death or income benefits provided by our variable products.
In 2006, we disposed of substantially all of the variable annuity business through reinsurance agreements with The Prudential Insurance Company of America, a subsidiary of Prudential Financial Inc. and therefore mitigated this aspect of our risk. Equity risk for our variable life business relates to contract charges and policyholder benefits. Total variable life contract charges, including reinsurance assumed, for 2020 and 2019 were $46 million and $45 million, respectively. Separate account liabilities related to variable life contracts were $109 million and $85 million as of December 31, 2020 and 2019, respectively.
Equity-indexed Life and Annuity Liabilities As of December 31, 2020 and 2019, we had $1.98 billion and $1.92 billion, respectively, in equity-indexed life and annuity liabilities that provide customers with interest crediting rates based on the performance of the S&P 500. We hedge the majority of the risk associated with these liabilities using equity-indexed options and futures and eurodollar futures, maintaining risk within specified value-at-risk limits.
Market Risk 2020 Form 10-K
Foreign currency exchange rate risk is the risk that we will incur economic losses due to adverse changes in foreign currency exchange rates. This risk primarily arises from our foreign equity investments, including common stocks, limited partnership interests, and our Canada, Northern Ireland and India operations. We use foreign currency derivative contracts to partially offset this risk.
As of December 31, 2020, we had $1.27 billion in foreign currency denominated equity investments, including the impact of foreign currency derivative contracts, $1.30 billion net investment in our foreign subsidiaries, primarily related to our Canada operations, and $77 million in unhedged non-U.S. dollar fixed income securities. These amounts were $2.80 billion, $1.08 billion, and $113 million, respectively, as of December 31, 2019.
| | | | | | | | | | | | | | |
Change in foreign currency exchange rates (1) |
| | As of December 31, |
| ($ in millions) | | 2020 | | 2019 |
| Decrease in value of foreign currency denominated instruments | | $ | 329 | | | $ | 402 | |
| | | | |
(1)Represents a 10% immediate unfavorable change in each of the foreign currency exchange rates to which we are exposed based on information and assumptions used, including the impact of foreign currency derivative contracts.
The modeling technique we use to report our currency exposure does not take into account correlation among foreign currency exchange rates. Even though we believe it is very unlikely that all of the foreign currency exchange rates that we are exposed to would simultaneously decrease by 10%, we nonetheless stress test our portfolio under this and other hypothetical extreme adverse market scenarios. Our actual experience may differ from these results because of assumptions we have used or because significant liquidity and market events could occur that we did not foresee.
The Allstate Corporation 97
2020 Form 10-K Capital Resources and Liquidity
Capital Resources and Liquidity
Capital resources consist of shareholders’ equity and debt, representing funds deployed or available to be deployed to support business operations or for general corporate purposes.
| | | | | | | | | | | | | | | | | | | | |
Capital resources | | | | | | |
| | As of December 31, |
| ($ in millions) | | 2020 | | 2019 | | 2018 |
| Preferred stock, common stock, treasury stock, retained income and other shareholders’ equity items | | $ | 26,913 | | | $ | 24,048 | | | $ | 21,194 | |
| Accumulated other comprehensive (loss) income | | 3,304 | | | 1,950 | | | 118 | |
| Total shareholders’ equity | | 30,217 | | | 25,998 | | | 21,312 | |
| Debt | | 7,825 | | | 6,631 | | | 6,451 | |
| Total capital resources | | $ | 38,042 | | | $ | 32,629 | | | $ | 27,763 | |
| Ratio of debt to shareholders’ equity | | 25.9 | % | | 25.5 | % | | 30.3 | % |
| Ratio of debt to capital resources | | 20.6 | % | | 20.3 | % | | 23.2 | % |
Shareholders’ equity increased in 2020, primarily due to net income and increased net unrealized capital gains on investments, partially offset by common share repurchases, dividends paid to shareholders and redemption of preferred stock. In 2020, we paid dividends of $668 million and $108 million related to our common and preferred shares, respectively. Shareholders’ equity increased in 2019, primarily due to net income, increased net unrealized capital gains on investments and issuance of preferred stock, partially offset by common share repurchases and dividends paid to shareholders. In 2019, we paid dividends of $653 million and $134 million related to our common and preferred shares, respectively.
Common share repurchases As of December 31, 2020, there was $1.56 billion remaining on the $3.00 billion common share repurchase program that is expected to be completed by the end of 2021.
In September 2020, we entered into an accelerated share repurchase agreement (“ASR agreement”) with Goldman Sachs & Co. LLC (“Goldman Sachs”) to purchase $750 million of our outstanding common stock. Under the ASR agreement, we paid $750 million upfront and initially acquired 7.0 million shares. The ASR agreement settled on January 12, 2021, and we repurchased a total of 7.8 million shares at an average price of $96.21. After the completion of the ASR, there was $1.45 billion remaining on the $3.00 billion common share repurchase program.
During 2020, we repurchased 17.4 million common shares, or 5.5% of total common shares outstanding as of December 31, 2019, for $1.70 billion. The common share repurchases were completed through open market transactions and ASR agreements.
Since 1995, we have acquired 742 million shares of our common stock at a cost of $36.93 billion, primarily as part of various stock repurchase programs. We have reissued 148 million common shares since 1995, primarily associated with our equity incentive plans, the 1999 acquisition of American Heritage Life Investment Corporation and the 2001 redemption of certain mandatorily redeemable preferred securities. Since 1995, total common shares outstanding has decreased by 594 million shares or 66.2%, primarily due to our repurchase programs.
Common shareholder dividends On January 2, 2020, April 1, 2020, July 1, 2020, and October 1, 2020, we paid common shareholder dividends of $0.50, $0.54, $0.54 and $0.54, respectively. On November 18, 2020, we declared a common shareholder dividend of $0.54, payable on January 4, 2021.
Redemption of preferred stock and issuance of debt On January 15, 2020, we redeemed all 11,500 shares of Fixed Rate Noncumulative Preferred Stock, Series A and the corresponding depositary shares for $288 million.
On November 19, 2020, we issued $600 million of 0.750% Senior Notes due 2025 and $600 million of 1.450% Senior Notes due 2030. Interest on the Senior Notes is payable semi-annually in arrears on June 15 and December 15 of each year, beginning on June 15, 2021. The Senior Notes are redeemable at any time at the applicable redemption price prior to the maturity date. The net proceeds of this issuance were used to partially fund the acquisition of National General.
For additional details on these transactions, see Note 12 of the consolidated financial statements.
Capital Resources and Liquidity 2020 Form 10-K
Financial ratings and strength
| | | | | | | | | | | | | | | | | | | | |
Senior long-term debt, commercial paper and insurance financial strength ratings |
| | As of December 31, 2020 |
| | Moody’s | | S&P Global Ratings | | A.M. Best |
| The Allstate Corporation (debt) | | A3 | | A- | | a |
| The Allstate Corporation (short-term issuer) | | P-2 | | A-2 | | AMB-1+ |
| Allstate Insurance Company (insurance financial strength) | | Aa3 | | AA- | | A+ |
| Allstate Life Insurance Company (insurance financial strength) | | A2 | | N/A | | A+ |
| Allstate Assurance Company (insurance financial strength) | | A2 | | N/A | | A+ |
Our ratings are influenced by many factors including our operating and financial performance, asset quality, liquidity, asset/liability management, overall portfolio mix, financial leverage (i.e., debt), exposure to risks such as catastrophes and the current level of operating leverage. The preferred stock and subordinated debentures are viewed as having a common equity component by certain rating agencies and are given equity credit up to a pre-determined limit in our capital structure as determined by their respective methodologies. These respective methodologies consider the existence of certain terms and features in the instruments such as the noncumulative dividend feature in the preferred stock.
The Allstate Corporation (the “Corporation”) and Allstate Insurance Company (“AIC”) In June 2020, A.M. Best affirmed the Corporation’s debt and short-term issuer ratings of a and AMB-1+, respectively, and the insurance financial strength rating of A+ for AIC. The outlook for the ratings is stable.
In July 2020, S&P affirmed the Corporation’s debt and short-term issuer ratings of A- and A-2, respectively, and the insurance financial strength rating of AA- for AIC. The outlook for the ratings is stable.
In January 2021, Moody’s affirmed the Corporation’s debt and short-term issuer ratings of A3 and P-2, respectively, and the insurance financial strength rating of Aa3 for AIC. The outlook for the ratings is stable.
ALIC and Allstate Assurance Company (“AAC”) In June 2020, A.M. Best affirmed the insurance financial strength ratings of A+ for ALIC and AAC. Subsequent to the announcement of the pending sale of ALIC and certain affiliates, A.M. Best affirmed the insurance financial strength rating of A+ for ALIC and AAC and placed these under review with negative implications.
Effective June 25, 2020, we are no longer requesting a rating from S&P for ALIC, which was rated A+ with a stable outlook at the time of the withdrawal.
Subsequent to the announcement of the pending sale of ALIC and certain affiliates, Moody’s downgraded the insurance financial strength rating for ALIC and AAC to A3 from A2 and placed these under review for potential further downgrade.
Other property and casualty companies We have distinct and separately capitalized groups of subsidiaries licensed to sell property and casualty insurance that maintain separate group ratings. The ratings of these groups are influenced by the risks that relate specifically to each group. Many mortgage companies require property owners to have insurance from an insurance carrier with a secure financial strength rating from an accredited rating agency. In June 2020, A.M. Best affirmed the A rating of ANJ, which writes auto and homeowners insurance in New Jersey, and the A+ rating of North Light, our excess and surplus lines carrier. The outlook for the ANJ rating and North Light rating is stable. ANJ also has a Financial Stability Rating® of A" from Demotech, which was affirmed in December 2020. In April 2020, A.M. Best affirmed the B+ rating of CKIC, which underwrites personal lines property insurance in Florida. CKIC also has a Financial Stability Rating of A’ from Demotech that was affirmed in November 2020. ANJ, North Light and CKIC do not have support agreements with AIC.
Allstate’s domestic property and casualty and life insurance subsidiaries prepare their statutory-basis financial statements in conformity with accounting practices prescribed or permitted by the insurance department of the applicable state of domicile. Statutory surplus is a measure that is often used as a basis for determining dividend paying capacity, operating leverage and premium growth capacity, and it is also reviewed by rating agencies in determining their ratings.
The property and casualty business is comprised of 29 insurance companies as of December 31, 2020, each of which has individual company dividend limitations. As of December 31, 2020, total statutory surplus is $21.38 billion compared to $20.40 billion as of December 31, 2019. Property and casualty subsidiaries surplus was $17.13 billion as of December 31, 2020, compared to $16.19 billion as of December 31, 2019. Life insurance subsidiaries surplus was $4.26 billion as of December 31, 2020, compared to $4.21 billion as of December 31, 2019.
The Allstate Corporation 99
2020 Form 10-K Capital Resources and Liquidity
The National Association of Insurance Commissioners (“NAIC”) has developed financial relationships or tests known as the Insurance Regulatory Information System to assist state insurance regulators in monitoring the financial condition of insurance companies and identifying companies that require special attention or actions by state insurance regulators. The NAIC analyzes financial data provided by insurance companies using prescribed ratios, each with defined “usual ranges”. Additional regulatory scrutiny may occur if a company’s ratios fall outside the usual ranges for four or more of the ratios. Two of our domestic life insurance companies have four ratios outside the usual ranges.
Liquidity sources and uses Our potential sources and uses of funds principally include the following activities below.
| | | | | | | | | | | | | | | | | | | | | | | | | | | | | | | | | | | | | | |
Activities for potential sources of funds |
| | Property- Liability | | Protection Services | | Allstate Life | | Allstate Benefits | | Allstate Annuities | | Corporate and Other |
| Receipt of insurance premiums | | ü | | ü | | ü | | ü | | | | |
| Recurring service fees | | ü | | ü | | | | ü | | | | |
| Contractholder fund deposits | | | | | | ü | | ü | | ü | | |
| Reinsurance and indemnification program recoveries | | ü | | ü | | ü | | ü | | ü | | |
| Receipts of principal, interest and dividends on investments | | ü | | ü | | ü | | ü | | ü | | ü |
| Sales of investments | | ü | | ü | | ü | | ü | | ü | | ü |
| Funds from securities lending, commercial paper and line of credit agreements | | ü | | | | ü | | | | ü
| | ü |
| Intercompany loans | | ü | | ü | | ü | | ü | | ü | | ü |
| Capital contributions from parent | | ü | | ü | | ü | | ü | | ü | | ü |
| Dividends or return of capital from subsidiaries | | ü | | ü | | ü | | ü | | ü | | ü |
| Tax refunds/settlements | | ü | | ü | | ü | | ü | | ü | | ü |
| Funds from periodic issuance of additional securities | | | | | | | | | | | | ü |
| Receipt of intercompany settlements related to employee benefit plans | | | | | | | | | | | | ü |
| | | | | | | | | | | | | | | | | | | | | | | | | | | | | | | | | | | | | | |
Activities for potential uses of funds |
| | Property- Liability | | Protection Services | | Allstate Life | | Allstate Benefits | | Allstate Annuities | | Corporate and Other |
| Payment of claims and related expenses | | ü | | ü
| | | | | | | | |
| Payment of contract benefits, surrenders and withdrawals | | | | | | ü | | ü | | ü | | |
| Reinsurance cessions and indemnification program payments | | ü | | ü | | ü | | ü | | ü | | |
| Operating costs and expenses | | ü | | ü | | ü | | ü | | ü | | ü |
| Purchase of investments | | ü | | ü | | ü | | ü | | ü | | ü |
| Repayment of securities lending, commercial paper and line of credit agreements | | ü | | | | ü | | | | ü | | ü |
| Payment or repayment of intercompany loans | | ü | | ü | | ü | | ü | | ü | | ü |
| Capital contributions to subsidiaries | | ü | | ü | | ü | | ü | | ü | | ü |
| Dividends or return of capital to shareholders/parent company | | ü | | ü | | ü | | ü | | ü | | ü |
| Tax payments/settlements | | ü | | ü | | ü | | ü | | ü | | ü |
| Common share repurchases | | | | | | | | | | | | ü |
| Debt service expenses and repayment | | ü | | | | | | | | | | ü |
| Payments related to employee benefit plans | | ü | | ü | | ü | | ü | | ü | | ü |
| Payments for acquisitions | | ü | | ü | | ü | | ü | | ü | | ü |
Contractual obligations and commitments We have short-term and long-term contractual obligations and commitments. We manage our short-term liquidity position to ensure the availability of a sufficient amount of liquid assets to extinguish short-term liabilities as they come due in the normal course of business, including utilizing potential sources of liquidity. Long-term obligations include known contractual commitments that require cash needs beyond 12 months.
Short-term contractual obligations are typically settled with cash or short-term investments and operating cash flows. Most of these obligations are paid within one year. These include unconditional purchase obligations, other liabilities and accrued expenses, including liabilities for collateral and operating leases, and net unrecognized tax benefits.
Capital Resources and Liquidity 2020 Form 10-K
We actively manage our financial position and liquidity levels in light of changing market, economic, and business conditions. Liquidity is managed at both the entity and enterprise level across the Company and is assessed on both base and stressed level liquidity needs. We believe we have sufficient liquidity to meet these needs. Additionally, we have existing intercompany agreements in place that facilitate liquidity management across the Company to enhance flexibility.
As of December 31, 2020, we held $7.44 billion of cash, U.S. government and agencies fixed income securities, and public equity securities which we would expect to be able to liquidate within one week. In addition, we regularly estimate how much of the total portfolio, which includes high quality corporate fixed income and municipal holdings, can be reasonably liquidated within one quarter. These estimates are subject to considerable uncertainty associated with evolving market conditions. As of December 31, 2020, cash and estimated liquidity available within one quarter, under normal market conditions and at current market prices, was $26.77 billion.
Certain remote events and circumstances could constrain our liquidity. Those events and circumstances include, for example, a catastrophe resulting in extraordinary losses, a downgrade in our senior long-term debt ratings to non-investment grade status, or a downgrade in AIC’s or ALIC’s financial strength ratings. The rating agencies also consider the interdependence of our individually rated entities; therefore, a rating change in one entity could potentially affect the ratings of other related entities.
The Allstate Corporation is party to an Amended and Restated Intercompany Liquidity Agreement (“Liquidity Agreement”) with certain subsidiaries, which include, but are not limited to, ALIC and AIC. The Liquidity Agreement allows for short-term advances of funds to be made between parties for liquidity and other general corporate purposes. The Liquidity Agreement does not establish a commitment to advance funds on the part of any party. ALIC and AIC each serve as a lender and borrower, certain other subsidiaries serve only as borrowers, and the Corporation serves only as a lender. AIC also has a capital support agreement with ALIC. Under the capital support agreement, AIC is committed to providing capital to ALIC to maintain an adequate capital level. The maximum amount of potential funding under each of these agreements is $1.00 billion.
In addition to the Liquidity Agreement, the Corporation also has an intercompany loan agreement with certain of its subsidiaries, which include, but are not limited to, AIC and ALIC. The amount of intercompany loans available to the Corporation’s subsidiaries is at the discretion of the Corporation. The maximum amount of loans the Corporation will have outstanding to all its eligible subsidiaries at any given point in time is limited to $1.00 billion. The Corporation may use commercial paper borrowings, bank lines of
credit and securities lending to fund intercompany borrowings.
Parent company capital capacity At the parent holding company level, we have deployable assets totaling $5.52 billion as of December 31, 2020 and approximately $4 billion were used to fund the purchase of National General, which closed on January 4, 2021. Deployable assets include $1.2 billion of proceeds from a debt issuance in November 2020 and comprise cash and investments that are generally saleable within one quarter. The substantial earnings capacity of the operating subsidiaries is the primary source of capital generation for the Corporation.
The payment of dividends by AIC to The Allstate Corporation is limited by Illinois insurance law to formula amounts based on statutory net income and statutory surplus, as well as the timing and amount of dividends paid in the preceding twelve months. Based on the greater of 2020 statutory net income or 10% of statutory surplus, the maximum amount of dividends that AIC will be able to pay, without prior Illinois Department of Insurance approval, at a given point in time in 2021 is estimated at $5.95 billion, less dividends paid during the preceding twelve months measured at that point in time. Notification and approval of intercompany lending activities are also required by the Illinois Department of Insurance for those transactions that exceed formula amounts based on statutory admitted assets and statutory surplus.
These holding company assets and subsidiary dividends provide funds for the parent company’s fixed charges and other corporate purposes.
Intercompany dividends were paid in 2020, 2019 and 2018 between the following companies: AIC, Allstate Insurance Holdings, LLC (“AIH”), the Corporation, ALIC, American Heritage Life Insurance Company (“AHL”) and Allstate Financial Insurance Holdings Corporation (“AFIHC”).
| | | | | | | | | | | | | | | | | | | | |
Intercompany dividends |
| ($ in millions) | | 2020 | | 2019 | | 2018 |
| AIC to AIH | | $ | 4,435 | | | $ | 2,732 | | | $ | 2,874 | |
| AIH to the Corporation | | 4,443 | | | 2,747 | | | 2,897 | |
| ALIC to AIC | | — | | | 75 | | | 250 | |
| AHL to AFIHC | | 80 | | | 80 | | | 55 | |
| AFIHC to the Corporation | | 115 | | | 50 | | | — | |
| | | | | | |
Dividends may not be paid or declared on our common stock and shares of common stock may not be repurchased unless the full dividends for the latest completed dividend period on our preferred stock have been declared and paid or provided for.
We are prohibited from declaring or paying dividends on our Series G preferred stock if we fail to meet specified capital adequacy, net income or shareholders’ equity levels, except out of the net proceeds of common stock issued during the 90 days prior to the date of declaration. As of December 31, 2020, we satisfied all the requirements with no current restrictions on the payment of preferred stock dividends. There were no capital contributions paid by
The Allstate Corporation 101
2020 Form 10-K Capital Resources and Liquidity
the Corporation to AIC or capital contributions by AIC to ALIC in 2020, 2019 or 2018.
The terms of our outstanding subordinated debentures also prohibit us from declaring or paying any dividends or distributions on our common or preferred stock or redeeming, purchasing, acquiring, or making liquidation payments on our common stock or preferred stock if we have elected to defer interest payments on the subordinated debentures, subject to certain limited exceptions. In 2020, we did not defer interest payments on the subordinated debentures.
Additional resources to support liquidity are as follows:
•The Corporation, AIC and ALIC have access to an unsecured revolving credit facility that is available for short-term liquidity requirements. In November 2020, we entered into a new agreement for a $750 million unsecured revolving credit facility with a maturity date of November 2025. The facility is fully subscribed among 11 lenders with the largest commitment being $95 million. The commitments of the lenders are several and no lender is responsible for any other lender’s commitment if such lender fails to make a loan under the facility. This facility contains an increase provision that would allow up to an additional $500 million of borrowing, subject to the lenders’ commitment. This facility has a financial covenant requiring that we not exceed a 37.5% debt to capitalization ratio as defined in the agreement. This ratio was 17.5% as of December 31, 2020. Although the right to borrow under the facility is not subject to a minimum rating requirement, the costs of maintaining the facility and borrowing under it are based on the ratings of our senior unsecured, unguaranteed long-term debt. There were no borrowings under the credit facility during 2020.
•The Corporation has access to a commercial paper facility with a borrowing limit equal to our undrawn credit facility balance of $750 million to cover short-term cash needs.
•As of December 31, 2020, there were no balances outstanding for the credit facility or the commercial paper facility and therefore the remaining borrowing capacity was $750 million.
•The Corporation has access to a universal shelf registration statement with the Securities and Exchange Commission that expires in 2021. We can use this shelf registration to issue an unspecified amount of debt securities, common stock (including 596 million shares of treasury stock as of December 31, 2020), preferred stock, depositary shares, warrants, stock purchase contracts, stock purchase units and securities of trust subsidiaries. The specific terms of any securities we issue under this registration statement will be provided in the applicable prospectus supplements.
Long-term contractual obligations
Defined benefit pension plans and other postretirement benefit plans (“OPEB”) Pension plan obligations within the next 12 months represent our planned contributions to certain unfunded non-qualified plans where the benefit obligation exceeds the assets. Obligations beyond 12 months are projected based on the average remaining service period using the current underfunded status of the plans. The OPEB plans’ obligations are estimated based on the expected benefits to be paid. See Note 17 of the consolidated financial statements for further information.
Reserves for property and casualty insurance claims and claims expense represent estimated amounts necessary to settle all outstanding claims, including claims that have been IBNR as of the balance sheet date. Estimated timing of payments for reserves is based on our historical experience and our expectation of future payment patterns. The ultimate cost of losses may vary materially from recorded amounts that are our best estimates. See Note 8 of the consolidated financial statements and Application of Critical Accounting Estimates section of the MD&A for further information.
Reserve for life-contingent contract benefits and contractholder funds We estimate the present value of cash payments to be made to contractholders and policyholders. We are currently making payments for contracts where the timing of a portion or all of the payments has been determined by the contract. Certain of these contracts, such as immediate annuities without life contingencies, involve payment obligations where the amount and timing of the payment are essentially fixed and determinable. Other contracts, such as interest-sensitive life, fixed deferred annuities, traditional life insurance and voluntary accident and health insurance, involve payment obligations where a portion or all of the amount and timing of future payments is uncertain. For immediate annuities with life contingencies, the amount of future payments is uncertain since payments will continue as long as the annuitant lives. We have estimated the timing of payments related to these contracts based on historical experience and our expectation of future payment patterns. Uncertainties relating to these liabilities include mortality, morbidity, expenses, customer lapse and withdrawal activity, estimated additional deposits for interest-sensitive life contracts, and renewal premium for life policies, which may significantly impact both the timing and amount of future payments. See Note 9 of the consolidated financial statements and Application of Critical Accounting Estimates section of the MD&A for further information. The pending sale of ALIC and certain affiliates represents approximately 90% of Allstate Life and 75% of Allstate Annuities reserves for life-contingent contract benefits and contractholder funds.
Capital Resources and Liquidity 2020 Form 10-K
Liquidity exposure Contractholder funds were $17.21 billion as of December 31, 2020.
| | | | | | | | | | | | | | |
Contractholder funds by contractual withdrawal provisions | | | | |
| ($ in millions) | | December 31, 2020 | | Percent to total |
| Not subject to discretionary withdrawal | | $ | 2,652 | | | 15.4 | % |
| Subject to discretionary withdrawal with adjustments: | | | | |
Specified surrender charges (1) | | 4,858 | | | 28.2 | |
Market value adjustments (2) | | 697 | | | 4.1 | |
Subject to discretionary withdrawal without adjustments (3) | | 9,006 | | | 52.3 | |
| Total contractholder funds | | $ | 17,213 | | | 100.0 | % |
(1)Includes $1.62 billion of liabilities with a contractual surrender charge of less than 5% of the account balance.
(2)$294 million of the contracts with market value adjusted surrenders have a 30-45 day period at the end of their initial and subsequent interest rate guarantee periods (which are typically 1, 5, 7 or 10 years) during which there is no surrender charge or market value adjustment.
(3)90% of these contracts have a minimum interest crediting rate guarantee of 3% or higher.
Retail life and annuity products may be surrendered by customers for a variety of reasons. Reasons unique to individual customers include a current or unexpected need for cash or a change in life insurance coverage needs. Other key factors that may impact the likelihood of customer surrender include the level of the contract surrender charge, the length of time the contract has been in force, distribution channel, market interest rates, equity market conditions and potential tax implications.
In addition, the propensity for retail life insurance policies to lapse is lower than it is for fixed annuities because of the need for the insured to be re-underwritten upon policy replacement.
The surrender and partial withdrawal rate on deferred fixed annuities and interest-sensitive life insurance products, based on the beginning of year contractholder funds, was 5.1% in 2020 and 6.0% in 2019. We strive to promptly pay customers who request cash surrenders; however, statutory regulations generally provide up to six months in most states to fulfill surrender requests.
Our asset-liability management practices enable us to manage the differences between the cash flows generated by our investment portfolio and the expected cash flow requirements of our life insurance and annuity product obligations.
Contractual commitments represent investment commitments such as private placements, limited partnership interests and other loans. Limited partnership interests are typically funded over the commitment period which is shorter than the contractual expiration date of the partnership and as a result, the actual timing of the funding may vary.
We have agreements in place for services we conduct, generally at cost, between subsidiaries relating to insurance, reinsurance, loans and capitalization. All material intercompany transactions have been appropriately eliminated in consolidation. Intercompany transactions among insurance subsidiaries and affiliates have been approved by the appropriate departments of insurance as required.
For a more detailed discussion of our off-balance sheet arrangements, see Note 7 of the consolidated financial statements.
The Allstate Corporation 103
2020 Form 10-K Enterprise Risk and Return Management
Enterprise Risk and Return Management
In addition to the normal risks of the business, Allstate is subject to significant risks as an insurer and a provider of other products and services. These risks are discussed in more detail in the Risk Factors section of this document.
We regularly identify, measure, manage, monitor and report all significant risks. Major categories of enterprise risk are strategic, insurance, investment, financial, operational and culture.
Allstate manages these risks through an Enterprise Risk and Return Management (“ERRM”) framework that includes governance, processes, culture, and activities that are performed on an integrated, enterprise-wide basis, following our risk and return principles. Our legal and capital structures are designed to manage capital and solvency on a legal entity basis. Our risk-return principles define how we operate and guide risk and return decision making. These principles state that our priority is to maintain a strong foundation by protecting solvency, complying with laws and acting with integrity. Building upon this foundation, we strive to build strategic value and optimize risk and return.
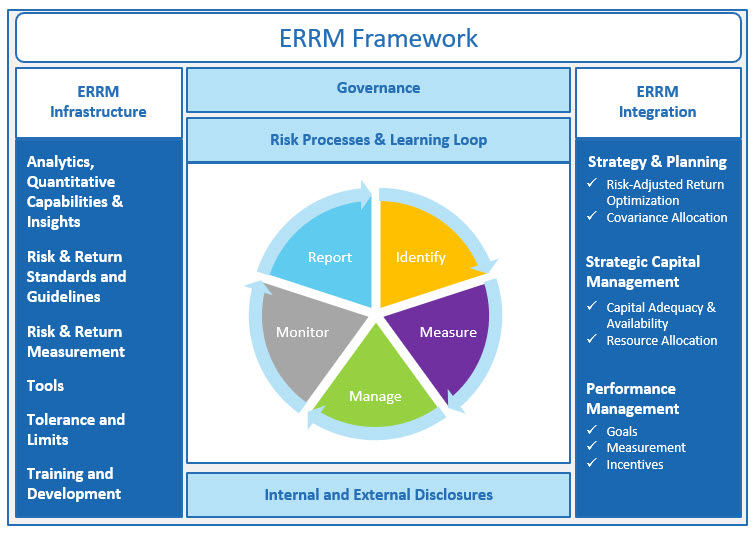
Governance ERRM governance includes board oversight, an executive management committee, and enterprise and market-facing business chief risk officers.
•The Allstate Corporation Board of Directors (“Allstate Board”) has overall responsibility for oversight of Management’s design and implementation of ERRM.
•The Risk and Return Committee (“RRC”) of the Allstate Board oversees effectiveness of the ERRM program, governance structure and risk-related decision-making, while focusing on the Company’s overall risk profile.
•The Audit Committee oversees the effectiveness of internal controls over financial reporting, disclosure controls and procedures as well as
management’s risk control framework and cybersecurity program.
•The Enterprise Risk and Return Council (“ERRC”), directs ERRM by establishing risk and return targets, determining economic capital levels and monitoring integrated strategies and actions from an enterprise risk and return perspective. The ERRC consists of Allstate’s chief executive officer, vice chair, chief financial officer, chief risk officer and other senior leaders.
•Other key committees work with the ERRC to direct ERRM activities, including the Operating Committee, the Operational Risk Council, the Information Security Council, the Corporate Asset Liability Committee, liability governance committees, and investment committees.
Enterprise Risk and Return Management 2020 Form 10-K
Key risks are assessed and reported through comprehensive ERRM reports prepared for senior management and the RRC. The risk summary report communicates alignment of Allstate’s risk profile with risk and return principles while providing a perspective on risk position. Discussion promotes active engagement with management and the RRC. Internal controls over key risks are managed and reported to senior management and the Audit Committee of the Company through a semiannual risk control dashboard. Annually, we review risks related to the strategic plan, operating plan and incentive compensation programs with the Allstate Board.
Framework We apply these principles using an integrated ERRM framework that focuses on assessment, transparency and dialogue. Our framework provides a comprehensive view of risks and is used by senior management and business managers to drive risk-return based decisions. We continually validate and improve our ERRM practices by benchmarking and obtaining external perspectives.
Management and the ERRC rely on internal and external perspectives to determine an appropriate level of target economic capital. Internal perspectives include enterprise solvency and volatility assessments, stress scenarios, model assumptions and management judgment. External considerations include NAIC risk-based capital as well as S&P’s, Moody’s, and A.M. Best’s capital adequacy measurement. Our economic capital reflects management’s view of the aggregate level of capital necessary to satisfy stakeholder interests, manage Allstate’s risk profile and maintain financial strength. The impact of strategic initiatives on enterprise risk is evaluated through the economic capital framework.
The NAIC has adopted the Risk Management and Own Risk and Solvency Assessment Model Act (“ORSA Model Act”), which has been enacted by our insurance subsidiaries’ domiciliary states. The ORSA Model Act requires that insurers maintain a risk management framework and conduct an internal own risk and solvency assessment of the insurer’s material risks in normal and stressed environments. Results of the assessment are filed annually.
Allstate’s risk appetite is measured through our economic capital framework. The enterprise risk appetite is cascaded into individual risk limits which set boundaries on the amount of risk we are willing to accept from one specific risk category before escalating for further management discussion and action. Risk limits are established based upon expected returns, volatility, potential tail losses and impact on the enterprise portfolio. To effectively operate within risk limits and for risk-return optimization, business units establish risk limits and capital targets specific to their businesses. Allstate’s risk management strategies adapt to changes in business and market environments.
Process Our ERRM framework establishes a basis for transparency and dialogue across the enterprise and for continuous learning by embedding our risk and return management culture of identifying, assessing,
managing, monitoring and reporting risks within the organization. Allstate designs business and enterprise strategies that seek to optimize risk-adjusted returns on capital. Risks are managed at both the legal entity and enterprise level.
A summary of our process to manage each of our major risk categories follows:
Strategic risk and return management addresses loss associated with inadequate or flawed business planning or strategy setting, including product mix, mergers or acquisitions and market positioning, and unexpected changes within the market or regulatory environment in which Allstate operates. This includes reputational risk, which is the potential for negative publicity regarding a company’s conduct or business practices to adversely impact its profitability, operations, consumer base or require costly litigation and other defensive measures.
We manage strategic risk through the Allstate Board and senior management strategy reviews that include a risk and return assessment of our strategic plans and ongoing monitoring of our strategic actions, key assumptions and the external competitive environment. Using the ERRM framework, Allstate designs strategies that seek to optimize risk-adjusted returns on economic capital for risk types including interest rate risk, credit risk, equity investments, including those with idiosyncratic return potential, auto profitability and growing property exposure.
Insurance risk and return management addresses fluctuations in the timing, frequency and severity of benefits, expenses, and premiums relative to the return expectations inclusive of systemic risk, concentration of insurance exposures, policy terms, reinsurance coverage, and claims handling practices.
Insurance risk exposures include our operating results and financial condition, claims frequency and severity, catastrophes and severe weather, and mortality and morbidity risk.
Insurance risk exposures are measured and monitored with different approaches including:
•Stochastic methods: measures and monitors risks such as natural catastrophes and severe weather. We develop probabilistic estimates of risk based on our exposures, historical observed volatility or industry-recognized models in the case of catastrophe risk.
•Scenario analysis: measures and monitors risks and estimated losses due to extreme low frequency events that include combined multiple event scenarios across risk categories and time periods.
Investment risk and return management addresses financial loss due to changes in the valuations of assets held in the Allstate investment portfolio, as well as liability valuation within the Life and Annuity business. Such losses may be caused by macro developments, such as changes to interest rates, credit spreads and equity price levels, or could be specific to individual investments in the portfolio.
The Allstate Corporation 105
2020 Form 10-K Enterprise Risk and Return Management
These losses can encompass both daily market volatility and permanent impairments of capital due to credit defaults and equity write-downs.
Investment risk exposures include interest rate risk, credit spread risk, equity price risk and foreign currency exchange rate risk.
Investment risk exposures are measured and monitored in a number of ways including:
•Sensitivity analysis: measures the impact from a unit change in a market risk input.
•Stochastic and probabilistic estimation of potential losses: combines portfolio risk exposures with historical or recent market volatilities and correlations to assess the potential range of future investment results.
•Scenario analysis: measures material adverse outcomes such as shock scenarios applied to credit, public and private equity markets.
Some of the stress scenarios are a combination of multiple scenarios across risk categories and over multiple time periods, considering the effects of macroeconomic conditions.
Financial risk and return management addresses the risk of insufficient cash flows to meet corporate or policyholder needs, risk of inadequate aggregate capital or capital within any subsidiary, inability to access capital markets, credit risk that arises when an external party fails to meet a contractual obligation such as reinsurance for ceded claims, or risk associated with a business counterparty default.
We actively manage our capital and liquidity levels in light of changing market, economic and business conditions. Our capital position, capital generation capacity, and targeted risk profile provide strategic and financial flexibility.
We generally assess solvency on a statutory accounting basis, but also consider holding company capital and liquidity needs. Current enterprise capital, which exceeds economic targeted levels, is based on a combination of statutory surplus and deployable assets at the parent holding company level.
Operational risk and return management addresses loss as a result of the failure of people, processes, systems or culture. Operational risk exposures include human capital, privacy, regulatory compliance, ethics, fraud, system availability, cybersecurity, data quality, disaster recovery and business continuity.
Operational risk is managed at the enterprise and market-facing business levels, through an integrated Operational Risk and Return Management (“ORRM”) program, with resources throughout the enterprise identifying, measuring, monitoring, managing, and reporting on operational risks at a detailed level.
From time to time, we engage independent advisors to assess and consult on operational risks. We also perform assessments of the quality of our operational risk program and identify opportunities to strengthen our internal controls.
Culture risk and return management addresses the potential for loss of stakeholder value from a suboptimal work environment, missed opportunities, or ineffective risk management practices. Allstate defines organization culture as a self-sustaining system of shared values, principles and priorities that shape beliefs, drive behavior and influence decision-making within an organization.
Culture is managed based on a set of core cultural elements that have been established as a basis for assessment and measurement. Results of culture risk assessment are reported to the ERRC and RRC throughout the year.
Application of Critical Accounting Estimates 2020 Form 10-K
Application of Critical Accounting Estimates
The preparation of financial statements in conformity with GAAP requires management to adopt accounting policies and make estimates and assumptions that affect amounts reported in the consolidated financial statements. The most critical estimates, presented in the order they appear in the Consolidated Statements of Financial Position, include those used in determining:
•Fair value of financial assets
•Impairment of fixed income securities
•Deferred policy acquisition costs amortization
•Evaluation of goodwill for impairment
•Reserve for property and casualty insurance claims and claims expense estimation
•Reserve for life-contingent contract benefits estimation
•Pension and other postretirement plans net costs and assumptions
In making these determinations, management makes subjective and complex judgments that frequently require estimates about matters that are inherently uncertain. Many of these policies, estimates and related judgments are common in the insurance and financial services industries; others are specific to our businesses and operations. It is reasonably likely that changes in these estimates could occur from period to period and result in a material impact on our consolidated financial statements.
A summary of each of these critical accounting estimates follows. For a more detailed discussion of the effect of these estimates on our consolidated financial statements, and the judgments and assumptions related to these estimates, see the referenced sections of this document. For a more detailed summary of our significant accounting policies, see the notes to the consolidated financial statements.
Fair value of financial assets Fair value is defined as the price that would be received to sell an asset or paid to transfer a liability in an orderly transaction between market participants at the measurement date. We are responsible for the determination of fair value of financial assets and the supporting assumptions and methodologies. We use independent third-party valuation service providers, broker quotes and internal pricing methods to determine fair values. We obtain or calculate only one single quote or price for each financial instrument.
Valuation service providers typically obtain data about market transactions and other key valuation model inputs from multiple sources and, through the use of proprietary models, produce valuation information in the form of a single fair value for individual fixed income and other securities for which a fair value has been requested under the terms of our agreements. The inputs used by the valuation service providers include, but are not limited to, market prices
from recently completed transactions and transactions of comparable securities, interest rate yield curves, credit spreads, liquidity spreads, currency rates, and other information, as applicable. Credit and liquidity spreads are typically implied from completed transactions and transactions of comparable securities. Valuation service providers also use proprietary discounted cash flow models that are widely accepted in the financial services industry and similar to those used by other market participants to value the same financial instruments. The valuation models take into account, among other things, market observable information as of the measurement date, as described above, as well as the specific attributes of the security being valued including its term, interest rate, credit rating, industry sector, and where applicable, collateral quality and other issue or issuer specific information. Executing valuation models effectively requires seasoned professional judgment and experience. For certain equity securities, valuation service providers provide market quotations for completed transactions on the measurement date. In cases where market transactions or other market observable data is limited, the extent to which judgment is applied varies inversely with the availability of market observable information.
For certain of our financial assets measured at fair value, where our valuation service providers cannot provide fair value determinations, we obtain a single non-binding price quote from a broker familiar with the security who, similar to our valuation service providers, may consider transactions or activity in similar securities among other information. The brokers providing price quotes are generally from the brokerage divisions of financial institutions with market making, underwriting and distribution expertise regarding the security subject to valuation.
The fair value of certain financial assets, including privately placed corporate fixed income securities and free-standing derivatives, for which our valuation service providers or brokers do not provide fair value determinations, is developed using valuation methods and models widely accepted in the financial services industry. Our internal pricing methods are primarily based on models using discounted cash flow methodologies that develop a single best estimate of fair value. Our models generally incorporate inputs that we believe are representative of inputs other market participants would use to determine fair value of the same instruments, including yield curves, quoted market prices of comparable securities or instruments, published credit spreads, and other applicable market data as well as instrument-specific characteristics that include, but are not limited to, coupon rates, expected cash flows, sector of the issuer, and call provisions. Because judgment is required in developing the fair values of these financial assets, they may differ from the amount actually received to sell an asset in an orderly transaction between market participants at the measurement date. Moreover, the use of different valuation assumptions may have a material effect on the financial assets’ fair values.
The Allstate Corporation 107
2020 Form 10-K Application of Critical Accounting Estimates
For most of our financial assets measured at fair value, all significant inputs are based on or corroborated by market observable data, and significant management judgment does not affect the periodic determination of fair value. The determination of fair value using discounted cash flow models involves management judgment when significant model inputs are not based on or corroborated by market observable data. However, where market observable data is available, it takes precedence, and as a result, no range of reasonably likely inputs exists from which the basis of a sensitivity analysis could be constructed.
We gain assurance that our financial assets are appropriately valued through the execution of various processes and controls designed to ensure the overall reasonableness and consistent application of valuation methodologies, including inputs and assumptions, and compliance with accounting standards. For fair values received from third parties or internally estimated, our processes and controls are designed to ensure that the valuation methodologies are appropriate and consistently applied, the inputs and assumptions are reasonable and consistent with the objective of determining fair value, and the fair values are accurately recorded. For example, on a continuing basis, we assess the reasonableness of individual fair values that have stale security prices or that exceed certain thresholds as compared to previous fair values received from valuation service providers or brokers or derived from internal models. We perform procedures to understand and assess the methodologies,
processes and controls of valuation service providers. In addition, we may validate the reasonableness of fair values by comparing information obtained from valuation service providers or brokers to other third-party valuation sources for selected securities. We perform ongoing price validation procedures such as back-testing of actual sales, which corroborate the various inputs used in internal models to market observable data. When fair value determinations are expected to be more variable, we validate them through reviews by members of management who have relevant expertise and who are independent of those charged with executing investment transactions.
We also perform an analysis to determine whether there has been a significant decrease in the volume and level of activity for the asset when compared to normal market activity, and if so, whether transactions may not be orderly. Among the indicators we consider in determining whether a significant decrease in the volume and level of market activity for a specific asset has occurred include the level of new issuances in the primary market, trading volume in the secondary market, level of credit spreads over historical levels, bid-ask spread, and price consensuses among market participants and sources. If evidence indicates that prices are based on transactions that are not orderly, we place little, if any, weight on the transaction price and will estimate fair value using an internal model. As of December 31, 2020 and 2019, we did not adjust fair values provided by our valuation service providers or brokers or substitute them with an internal model for such securities.
| | | | | | | | | | | | | | |
Fixed income, equity securities and short-term investments by source of fair value determination |
| | December 31, 2020 |
| ($ in millions) | | Fair value | | Percent to total |
| Fair value based on internal sources | | $ | 2,225 | | | 2.8 | % |
Fair value based on external sources (1) | | 76,639 | | | 97.2 | |
| Total | | $ | 78,864 | | | 100.0 | % |
(1)Includes $1.27 billion that are valued using broker quotes and $375 million that are valued using quoted prices or quoted net asset values from deal sponsors.
For additional detail on fair value measurements, see Note 6 of the consolidated financial statements.
Impairment of fixed income securities For fixed income securities classified as available-for-sale, the difference between amortized cost, net of credit loss allowance (“amortized cost, net”) and fair value, net of certain other items and deferred income taxes (as disclosed in Note 5 of the consolidated financial statements), is reported as a component of accumulated other comprehensive income (“AOCI”) on the Consolidated Statements of Financial Position and is not reflected in the operating results of any period until reclassified to net income upon the consummation of a transaction with an unrelated third party or when a credit loss allowance is recorded. We have a comprehensive portfolio monitoring process to identify and evaluate each fixed income security that may require a credit loss allowance.
For each fixed income security in an unrealized loss position, we assess whether management with the
appropriate authority has made the decision to sell or whether it is more likely than not we will be required to sell the security before recovery of the amortized cost basis for reasons such as liquidity, contractual or regulatory purposes. If a security meets either of these criteria, any existing credit loss allowance would be written-off against the amortized cost basis of the asset along with any remaining unrealized losses, with the incremental losses recorded in earnings.
If we have not made the decision to sell the fixed income security and it is not more likely than not we will be required to sell the fixed income security before recovery of its amortized cost basis, we evaluate whether we expect to receive cash flows sufficient to recover the entire amortized cost basis of the security. We calculate the estimated recovery value based on the best estimate of future cash flows considering past events, current conditions and reasonable and supportable forecasts. The estimated future cash flows are discounted at the security’s current effective rate, and are compared to the amortized cost of the
Application of Critical Accounting Estimates 2020 Form 10-K
security. The determination of cash flow estimates is inherently subjective, and methodologies may vary depending on facts and circumstances specific to the security. All reasonably available information relevant to the collectability of the security are considered when developing the estimate of cash flows expected to be collected. That information generally includes, but is not limited to, the remaining payment terms of the security, prepayment speeds, the financial condition and future earnings potential of the issue or issuer, expected defaults, expected recoveries, the value of underlying collateral, origination vintage year, geographic concentration of underlying collateral, available reserves or escrows, current subordination levels, third-party guarantees and other credit enhancements. Other information, such as industry analyst reports and forecasts, sector credit ratings, financial condition of the bond insurer for insured fixed income securities, and other market data relevant to the realizability of contractual cash flows, may also be considered. The estimated fair value of collateral will be used to estimate recovery value if we determine that the security is dependent on the liquidation of collateral for ultimate settlement.
If we do not expect to receive cash flows sufficient to recover the entire amortized cost basis of the fixed income security, a credit loss allowance is recorded in earnings for the shortfall in expected cash flows; however, the amortized cost, net of the credit loss allowance, may not be lower than the fair value of the security. The portion of the unrealized loss related to factors other than credit remains classified in AOCI. If we determine that the fixed income security does not have sufficient cash flow or other information to estimate a recovery value for the security, we may conclude that the entire decline in fair value is deemed to be credit related and the loss is recorded in earnings.
When a security is sold or otherwise disposed or the security is deemed uncollectible and written off, we remove amounts previously recognized in the credit loss allowance. Recoveries after write-offs are recognized when received.
For additional detail on investment impairments, see Note 5 of the consolidated financial statements.
Deferred policy acquisition costs amortization We incur significant costs in connection with acquiring insurance policies and investment contracts. In accordance with GAAP, costs that are related directly to the successful acquisition of new or renewal insurance policies and investment contracts are deferred and recorded as an asset on the Consolidated Statements of Financial Position.
DAC related to property and casualty contracts is amortized into income as premiums are earned, typically over periods of six or twelve months for personal lines policies or generally one to five years for protection plans and other contracts (primarily related to finance and insurance products).
DAC related to traditional life and voluntary accident and health insurance is amortized over the premium paying period of the related policies in
proportion to the estimated revenues on such business. Significant assumptions relating to estimated premiums, investment returns, as well as mortality, persistency and expenses to administer the business are established at the time the policy is issued and are generally not revised during the life of the policy. The assumptions for determining the timing and amount of DAC amortization are consistent with the assumptions used to calculate the reserve for life-contingent contract benefits. Any deviations from projected business in force resulting from actual policy terminations differing from expected levels and any estimated premium deficiencies may result in a change to the rate of amortization in the period such events occur. Generally, the amortization periods for these policies approximate the estimated lives of the policies. The recovery of DAC is dependent upon the future profitability of the business.
We periodically review the adequacy of reserves and recoverability of DAC using actual experience and current assumptions. We evaluate our traditional life insurance products, immediate annuities with life contingencies, and voluntary accident and health insurance products individually. In the event actual experience and current assumptions are adverse compared to the original assumptions and a premium deficiency is determined to exist, any remaining unamortized DAC balance must be expensed to the extent not recoverable and a premium deficiency reserve may be required if the remaining DAC balance is insufficient to absorb the deficiency. In 2020 and 2019, our DAC recoverability evaluation concluded that all recorded DAC balances were recoverable. For additional detail on reserve adequacy, see the Reserve for life-contingent contract benefits estimation section.
DAC related to interest-sensitive life insurance is amortized in proportion to the incidence of the total present value of gross profits, which includes both actual historical gross profits (“AGP”) and estimated future gross profits (“EGP”) expected to be earned over the estimated lives of the contracts. The amortization is net of interest on the prior period DAC balance using rates established at the inception of the contracts. Actual amortization periods generally range from 15-30 years; however, incorporating estimates of the rate of customer surrenders, partial withdrawals and deaths generally results in the majority of the DAC being amortized during the surrender charge period, which is typically 10-20 years for interest-sensitive life. The rate of DAC amortization is reestimated and adjusted by a cumulative charge or credit to income when there is a difference between the incidence of actual versus expected gross profits in a reporting period or when there is a change in total EGP.
AGP and EGP primarily consist of the following components: contract charges for the cost of insurance less mortality costs and other benefits (benefit margin); investment income and realized capital gains and losses less interest credited (investment margin); and surrender and other contract charges less maintenance expenses (expense margin). The principal assumptions for determining the amount of EGP are mortality, persistency, expenses,
The Allstate Corporation 109
2020 Form 10-K Application of Critical Accounting Estimates
investment returns, including capital gains and losses on assets supporting contract liabilities, interest crediting rates to contractholders, and the effects of any hedges. These assumptions are reasonably likely to have the greatest impact on the amount of DAC amortization. Changes in these assumptions can be offsetting and we are unable to reasonably predict their future movements or offsetting impacts over time.
Each reporting period, DAC amortization is recognized in proportion to AGP for that period adjusted for interest on the prior period DAC balance. This amortization process includes an assessment of AGP compared to EGP, the actual amount of business remaining in force and realized capital gains and losses on investments supporting the product liability. The impact of realized capital gains and losses on amortization of DAC depends upon which product liability is supported by the assets that give rise to the gain or loss. If the AGP is greater than EGP in the period, but the total EGP is unchanged, the amount of DAC amortization will generally increase, resulting in a current period decrease to earnings. The opposite result generally occurs when the AGP is less than the EGP in the period, but the total EGP is unchanged. However, when DAC amortization or a component of gross profits for a quarterly period is potentially negative (which would result in an increase of the DAC balance) as a result of negative AGP, the specific facts
and circumstances surrounding the potential negative amortization are considered to determine whether it is appropriate for recognition in the consolidated financial statements. Negative amortization is only recorded when the increased DAC balance is determined to be recoverable based on facts and circumstances. For products whose supporting investments are exposed to capital losses in excess of our expectations which may cause periodic AGP to become temporarily negative, EGP and AGP utilized in DAC amortization may be modified to exclude the excess capital losses.
Annually, we review and update the assumptions underlying the projections of EGP, including mortality, persistency, expenses, investment returns, comprising investment income and realized capital gains and losses, interest crediting rates and the effect of any hedges, using our experience and industry experience. At each reporting period, we assess whether any revisions to assumptions used to determine DAC amortization are required. These reviews and updates may result in amortization acceleration or deceleration, which are referred to as “DAC unlocking”. If the update of assumptions causes total EGP to increase, the rate of DAC amortization will generally decrease, resulting in a current period increase to earnings. A decrease to earnings generally occurs when the assumption update causes the total EGP to decrease.
| | | | | | | | | | | | | | |
Effect on DAC amortization of changes in assumptions relating to gross profit components |
| | For the years ended December 31, |
| ($ in millions) | | 2020 | | 2019 |
| | | | |
| Investment margin | | $ | 157 | | | $ | 23 | |
| Benefit margin | | (7) | | | 38 | |
| Expense margin | | (41) | | | (1) | |
| Net acceleration | | $ | 109 | | | $ | 60 | |
In 2020, DAC amortization acceleration for changes in the investment margin component of EGP related to interest-sensitive life insurance and was due to lower projected future interest rates and investment returns compared to our previous expectations. The deceleration related to benefit margin was due to decreased projected mortality. The expense margin deceleration was due to a decrease in projected expenses.
In 2019, DAC amortization acceleration for changes in the investment margin component of EGP was due to lower projected future interest rates and investment returns compared to our previous expectations. The acceleration related to benefit margin was due to decreased projected interest rates that result in lower projected policyholder account values which increases benefits on guaranteed products and more refined policy level information and assumptions.
Application of Critical Accounting Estimates 2020 Form 10-K
The following table displays the sensitivity of reasonably likely changes in assumptions included in the gross profit components of investment margin or
benefit margin to amortization of the DAC balance as of December 31, 2020.
| | | | | | | | | | | | | | |
|
| | |
| ($ in millions) | | Increase/(reduction) |
| | | | |
| Increase in future investment margins of 25 basis points | | $ | 54 | |
| Decrease in future investment margins of 25 basis points | | | (60) | |
| | | | |
| | | | |
| Decrease in future life mortality by 1% | | $ | 15 | |
| Increase in future life mortality by 1% | | | (16) | |
Any potential changes in assumptions discussed above are measured without consideration of correlation among assumptions. Therefore, it would be inappropriate to add them together in an attempt to estimate overall variability in amortization.
For additional detail related to DAC, see the Allstate Life Segment section of the MD&A.
Evaluation of goodwill for impairment Goodwill represents the excess of amounts paid for acquiring businesses over the fair value of the net assets acquired, less any impairment of goodwill recognized. Goodwill is recognized when acquired and allocated to reporting units based on which unit is expected to benefit from the synergies of the business combination. Our goodwill reporting units are equivalent to our reportable segments: Allstate Protection, Protection Services, Allstate Life and Allstate Benefits to which goodwill has been assigned.
Upon acquisition, the purchase price of the acquired business is assumed to be its fair value. Subsequently, we estimate the fair value of our businesses in each goodwill reporting unit, utilizing a combination of widely accepted valuation techniques including a stock price and market capitalization analysis, discounted cash flow (“DCF”) calculations and an estimate of a business’s fair value using market to book multiples derived from peer company analysis. The stock price and market capitalization analysis takes into consideration the quoted market price of our outstanding common stock and includes a control premium, derived from relevant historical acquisition activity, in determining the estimated fair value of the consolidated entity before allocating that fair value to individual reporting units. The DCF analysis utilizes long term assumptions for revenues, investment income, benefits, claims, other operating expenses and income taxes to produce projections of both income and cash flows available for dividends that are present valued using the weighted average cost of capital. Market to book multiples represent the mean market to book multiple for selected peer companies with operations similar to our goodwill reporting units to which the multiple is applied. The outputs from these methods are weighted based on the nature of the business and the relative amount of market observable assumptions supporting the estimates. The computed values are then weighted to reflect the fair value estimate based on the specific attributes of each goodwill reporting unit.
Estimating the fair value of reporting units is a subjective process that involves the use of significant estimates by management. Changes in market inputs
or other events impacting the fair value of these businesses, including discount rates, operating results, investment returns, strategies and growth rate assumptions, among other factors, could result in goodwill impairments, resulting in a charge to income. Certain of our goodwill reporting units are comprised of a combination of legacy and acquired businesses and as a result have substantial internally generated and unrecognized intangibles and fair values that significantly exceed their carrying values. Our Protection Services goodwill reporting unit is more heavily comprised of newly acquired businesses and as a result does not have a significant excess of fair value over its carrying value attributable to internally generated unrecognized intangibles. Therefore, this reporting unit may be more susceptible to potential future goodwill impairment based on changes to growth or margin assumptions.
The most significant assumptions utilized in the determination of the estimated fair value of the Protection Services reporting unit are the earnings growth rate and discount rate. The growth rate utilized in our fair value estimates is consistent with our plans to grow these businesses more rapidly over the near-term with more moderated growth rates in later years.
The discount rate, which is consistent with the weighted average cost of capital expected by a market participant, is based upon industry specific required rates of return, including consideration of both debt and equity components of the capital structure. Our discount rate may be impacted by changes in the risk-free rate, cost of debt, equity risk premium and entity specific risks.
Changes in our growth assumptions, including the risk of loss of key customers, or adverse changes in the discount rates could result in a decline in fair value and result in a goodwill impairment charge.
Reserve for property and casualty insurance claims and claims expense estimation Reserves are established to provide for the estimated costs of paying claims and claims expenses under insurance policies we have issued. Underwriting results are significantly influenced by estimates of property and casualty insurance claims and claims expense reserves. These reserves are an estimate of amounts necessary to settle all outstanding claims, including IBNR, as of the financial statement date.
Characteristics of reserves Reserves are established independently of business segment management for each business segment and line of business based on estimates of the ultimate cost to
The Allstate Corporation 111
2020 Form 10-K Application of Critical Accounting Estimates
settle claims, less losses that have been paid. The significant lines of business are auto, homeowners, and other personal lines for Allstate Protection, and asbestos, environmental, and other discontinued lines for Discontinued Lines and Coverages. Allstate Protection’s claims are typically reported promptly with relatively little reporting lag between the date of occurrence and the date the loss is reported. Auto and homeowners liability losses generally take an average of about two years to settle, while auto physical damage, homeowners property and other personal lines have an average settlement time of less than one year. Discontinued Lines and Coverages involve long-tail losses, such as those related to asbestos and environmental claims, which often involve substantial reporting lags and extended times to settle.
Reserves are the difference between the estimated ultimate cost of losses incurred and the amount of paid losses as of the reporting date. Reserves are estimated for both reported and unreported claims, and include estimates of all expenses associated with processing and settling all incurred claims. We update most of our reserve estimates quarterly and as new information becomes available or as events emerge that may affect the resolution of unsettled claims. Changes in prior reserve estimates (reserve reestimates), which may be material, are determined by comparing updated estimates of ultimate losses to prior estimates, with the differences recorded as property and casualty insurance claims and claims expense in the Consolidated Statements of Operations in the period such changes are determined. Estimating the ultimate cost of claims and claims expenses is an inherently uncertain and complex process involving a high degree of judgment and is subject to the evaluation of numerous variables.
The actuarial methods used to develop reserve estimates Reserve estimates are derived by using several different actuarial estimation methods that are variations on one primary actuarial technique. The actuarial technique is known as a “chain ladder” estimation process in which historical loss patterns are applied to actual paid losses and reported losses (paid losses plus individual case reserves established by claim adjusters) for an accident year or a report year to create an estimate of how losses are likely to develop over time. An accident year refers to classifying claims based on the year in which the claims occurred. A report year refers to classifying claims based on the year in which the claims are reported. Both classifications are used to prepare estimates of required reserves for payments to be made in the future. The key assumptions affecting our reserve estimates comprise data elements including claim counts, paid losses, case reserves, and development factors calculated with this data.
See Discontinued and Lines and Coverages reserve estimates section for specific disclosures of industry and actuarial best practices for this segment.
In the chain ladder estimation technique, a ratio (development factor) is calculated which compares current period results to results in the prior period for
each accident year. A multi-year average development factor, based on historical results, is usually multiplied by the current period experience to estimate the development of losses of each accident year into the next time period. The development factors for the future time periods for each accident year are compounded over the remaining future periods to calculate an estimate of ultimate losses for each accident year. The implicit assumption of this technique is that an average of historical development factors is predictive of future loss development, as the significant size of our experience database achieves a high degree of statistical credibility in actuarial projections of this type. The effects of inflation are implicitly considered in the reserving process, the implicit assumption being that a multi-year average development factor includes an adequate provision. The development factor estimation methodology may require modification when data changes due to changing claim reporting practices, changing claim settlement patterns, external regulatory or financial influences, or contractual coverage changes. In these situations, actuarial estimation techniques are applied to appropriately modify the “chain ladder” assumptions. These actuarial techniques are necessary to analyze the effects of changing loss data to develop modified development factor selections. The actuarial estimation techniques include exclusion of unusual losses or aberrations and adjustment of historical data to present conditions. Actuarially modified patterns of development are calculated with the adjusted historical data. Actuarial judgment is then applied to make appropriate development factor assumptions needed to develop a best estimate of gross ultimate losses. These developments are discussed further in the Allstate brand loss ratio disclosures in the Allstate Protection Segment and the Claims and Claims Expense Reserves sections of the MD&A.
How reserve estimates are established and updated Reserve estimates are developed at a very detailed level, and the results of these numerous micro-level best estimates are aggregated to form a consolidated reserve estimate. For example, over one thousand actuarial estimates of the types described above are prepared each quarter to estimate losses for each line of insurance, major components of losses (such as coverages and perils), major states or groups of states and for reported losses and IBNR. The actuarial methods described above are used to analyze the settlement patterns of claims by determining the development factors for specific data elements that are necessary components of a reserve estimation process. Development factors are calculated quarterly and periodically throughout the year for data elements such as claim counts reported and settled, paid losses, and paid losses combined with case reserves. The calculation of development factors from changes in these data elements also impacts claim severity trends. The historical development patterns for these data elements are used as the assumptions to calculate reserve estimates.
Often, several different estimates are prepared for each detailed component, incorporating alternative
Application of Critical Accounting Estimates 2020 Form 10-K
analyses of changing claim settlement patterns and other influences on losses, from which we select our best estimate for each component, occasionally incorporating additional analyses and actuarial judgment, as described above. These micro-level estimates are not based on a single set of assumptions. Actuarial judgments that may be applied to these components of certain micro-level estimates generally do not have a material impact on the consolidated level of reserves. Moreover, this detailed micro-level process does not permit or result in a compilation of a company-wide roll up to generate a range of needed loss reserves that would be meaningful. Based on our review of these estimates, our best estimate of required reserves for each state/line/coverage component is recorded for each accident year, and the required reserves for each component are summed to create the reserve balance carried on our Consolidated Statements of Financial Position.
Reserves are reestimated quarterly and periodically throughout the year, by combining historical results with current actual results to calculate new development factors. This process continuously incorporates the historic and latest actual trends, and other underlying changes in the data elements used to calculate reserve estimates. New development factors are likely to differ from previous development factors used in prior reserve estimates because actual results
(claims reported or settled, losses paid, or changes to case reserves) occur differently than the implied assumptions contained in the previous development factor calculations. If claims reported, paid losses, or case reserve changes are greater or less than the levels estimated by previous development factors, reserve reestimates increase or decrease. When actual development of these data elements is different than the historical development pattern used in a prior period reserve estimate, a new reserve is determined. The difference between indicated reserves based on new reserve estimates and recorded reserves (the previous estimate) is the amount of reserve reestimate and is recognized as an increase or decrease in claims and claims expense in the Consolidated Statements of Operations. Total net reserve reestimates, after-tax, favorable impact on net income applicable to common shareholders were 6.3%, 2.2% and 10.0% in 2020, 2019 and 2018, respectively. The 3-year average of net reserve reestimates as a percentage of total reserves was a favorable 2.0% for Allstate Protection, an unfavorable 8.0% for Discontinued Lines and Coverages and a favorable 4.1% for Protection Services, each of these results being consistent within a reasonable actuarial tolerance for the respective businesses. A more detailed discussion of reserve reestimates is presented in the Claims and Claims Expense Reserves section of the MD&A.
| | | | | | | | | | | | | | | | | | | | |
Net claims and claims expense reserves by segment and line of business | | |
| | As of December 31, |
| ($ in millions) | | 2020 | | 2019 | | 2018 |
| Allstate Protection | | | | | | |
| Auto | | $ | 14,164 | | | $ | 14,728 | | | $ | 14,378 | |
| Homeowners | | 2,315 | | | 2,138 | | | 2,157 | |
| Other lines | | 2,657 | | | 2,530 | | | 2,290 | |
| Total Allstate Protection | | 19,136 | | | 19,396 | | | 18,825 | |
| Discontinued Lines and Coverages | | | | | | |
| Asbestos | | 827 | | | 810 | | | 866 | |
| Environmental | | 206 | | | 179 | | | 170 | |
| Other discontinued lines | | 375 | | | 376 | | | 355 | |
| Total Discontinued Lines and Coverages | | 1,408 | | | 1,365 | | | 1,391 | |
Total Protection Services | | 33 | | | 39 | | | 52 | |
| Total net claims and claims expense reserves | | $ | 20,577 | | | $ | 20,800 | | | $ | 20,268 | |
Allstate Protection reserve estimate
Factors affecting reserve estimates Reserve estimates are developed based on the processes and historical development trends described above. These estimates are considered in conjunction with known facts and interpretations of circumstances and factors including our experience with similar cases, actual claims paid, historical trends involving claim payment patterns and pending levels of unpaid claims, loss management programs, product mix and contractual terms, changes in law and regulation, judicial decisions, and economic conditions. When we experience changes of the type previously mentioned, we may need to apply actuarial judgment in the determination and selection of development factors considered more reflective of the new trends, such as combining shorter or longer periods of historical results with current actual results to produce development factors based
on two-year, three-year, or longer development periods to reestimate our reserves. For example:
•The Coronavirus has had a significant impact on driving patterns and auto frequency that may lead to historical development trends being less predictive of future loss development, potentially creating additional reserve variability.
•If a legal change is expected to have a significant impact on the development of claim severity for a coverage which is part of a particular line of insurance in a specific state, actuarial judgment is applied to determine appropriate development factors that will most accurately reflect the expected impact on that specific estimate.
•A change in economic conditions is expected to affect the cost of repairs to damaged autos or
The Allstate Corporation 113
2020 Form 10-K Application of Critical Accounting Estimates
property for a particular line, coverage, or state, actuarial judgment is applied to determine appropriate development factors to use in the reserve estimate that will most accurately reflect the expected impacts on severity development.
As claims are reported, for certain liability claims of sufficient size and complexity, the field adjusting staff establishes case reserve estimates of ultimate cost, based on their assessment of facts and circumstances related to each individual claim. For other claims which occur in large volumes and settle in a relatively short time frame, it is not practical or efficient to set case reserves for each claim, and a statistical case reserve is set for these claims based on estimation techniques described above. In the normal course of business, we may also supplement our claims processes by utilizing third-party adjusters, appraisers, engineers, inspectors, and other professionals and information sources to assess and settle catastrophe and non-catastrophe related claims.
Historically, the case reserves set by the field adjusting staff have not proven to be an entirely accurate estimate of the ultimate cost of claims. To provide for this, a development reserve is estimated using the processes described above and allocated to pending claims as a supplement to case reserves. Typically, the case, including statistical case, and supplemental development reserves comprise about 90% of total reserves.
Another major component of reserves is IBNR, which comprises about 10% of total reserves. IBNR can be a small percentage of reserves for relatively short-term claims, such as auto physical damage claims, or a large percentage of reserves for claims that have uncertain payout requirements over a long period of time, such as auto injury and MCCA claims. All major components of reserves are affected by changes in claim frequency as well as claim severity.
Generally, the initial reserves for a new accident year are established based on actual claim frequency and severity assumptions for different business segments, lines and coverages based on historical relationships to relevant inflation indicators. Reserves for prior accident years are statistically determined using processes described above. Changes in auto claim frequency may result from changes in mix of business, the rate of distracted driving, miles driven or other macroeconomic factors. Changes in auto current year claim severity are generally influenced by inflation in the medical and auto repair sectors of the economy and the effectiveness and efficiency of our claim practices. We mitigate these effects through various loss management programs. Injury claims are affected largely by medical cost inflation while physical damage claims are affected largely by auto repair cost inflation and used car prices. For auto physical damage coverages, we monitor our rate of increase in average cost per claim against the auto maintenance, repair, parts and equipment price indices. We believe our claim settlement initiatives, such as improvements to the claim review and settlement process, the use of special investigative units to detect fraud and handle suspect claims, litigation management and defense
strategies, as well as various other loss management initiatives underway, contribute to the mitigation of injury and physical damage severity trends.
Changes in homeowners current year claim severity are generally influenced by inflation in the cost of building materials, the cost of construction and property repair services, the cost of replacing home furnishings and other contents, the types of claims that qualify for coverage, deductibles, other economic and environmental factors and the effectiveness and efficiency of our claim practices. We employ various loss management programs to mitigate the effect of these factors.
As loss experience for the current year develops for each type of loss, it is monitored relative to initial assumptions until it is judged to have sufficient statistical credibility. From that point in time and forward, reserves are reestimated using statistical actuarial processes to reflect the impact actual loss trends have on development factors incorporated into the actuarial estimation processes. Statistical credibility is usually achieved by the end of the first calendar year; however, when trends for the current accident year exceed initial assumptions sooner, they are usually determined to be credible, and reserves are increased accordingly.
The very detailed processes for developing reserve estimates, and the lack of a need and existence of a common set of assumptions or development factors, limits aggregate reserve level testing for variability of data elements. However, by applying standard actuarial methods to consolidated historic accident year loss data for major loss types, comprising auto injury losses, auto physical damage losses and homeowner losses, we develop variability analyses consistent with the way we develop reserves by measuring the potential variability of development factors, as described in the section titled “Potential Reserve Estimate Variability” below.
Causes of reserve estimate uncertainty Since reserves are estimates of unpaid portions of claims and claims expenses that have occurred, including IBNR losses, the establishment of appropriate reserves, including reserves for catastrophe losses, requires regular reevaluation and refinement of estimates to determine our ultimate loss estimate.
At each reporting date, the highest degree of uncertainty in estimates for most of our losses from ongoing businesses arise from claims remaining to be settled for the current accident year and the most recent preceding accident year. The greatest degree of uncertainty exists in the current accident year because the current accident year contains the greatest proportion of losses that have not been reported or settled but must be estimated as of the current reporting date. Most of these losses relate to damaged property such as automobiles and homes, and medical care for injuries from accidents. During the first year after the end of an accident year, a large portion of the total losses for that accident year are settled. When accident year losses paid through the end of the first year following the initial accident year
Application of Critical Accounting Estimates 2020 Form 10-K
are incorporated into updated actuarial estimates, the trends inherent in the settlement of claims emerge more clearly. Consequently, this is the point in time at which we tend to make our largest reestimates of losses for an accident year. After the second year, the losses that we pay for an accident year typically relate to claims that are more difficult to settle, such as those involving serious injuries or litigation. Private passenger auto insurance provides a good illustration of the uncertainty of future loss estimates: our typical annual percentage payout of reserves remaining at December 31 for an accident year is approximately 45% in the first year after the end of the accident year, 20% in the second year, 15% in the third year, 10% in the fourth year, and the remaining 10% thereafter.
Reserves for catastrophe losses Catastrophe losses are an inherent risk of the property and casualty insurance industry that have contributed, and will continue to contribute, to potentially material year-to-year fluctuations in our results of operations and financial position. We define a “catastrophe” as an event that produces pre-tax losses before reinsurance in excess of $1 million and involves multiple first party policyholders, or a winter weather event that produces a number of claims in excess of a preset, per-event threshold of average claims in a specific area, occurring within a certain amount of time following the event. Catastrophes are caused by various natural events including high winds, winter storms and freezes, tornadoes, hailstorms, wildfires, tropical storms, hurricanes, earthquakes and volcanoes. We are also exposed to man-made catastrophic events, such as certain types of terrorism or industrial accidents. The nature and level of catastrophes in any period cannot be reliably predicted.
The estimation of claims and claims expense reserves for catastrophe losses also comprises estimates of losses from reported claims and IBNR, primarily for damage to property. In general, our estimates for catastrophe reserves are based on claim adjuster inspections and the application of historical loss development factors as described above. However, depending on the nature of the catastrophe, the estimation process can be further complicated. For example, for hurricanes, complications could include the inability of insureds to promptly report losses, limitations placed on claims adjusting staff affecting their ability to inspect losses, determining whether losses are covered by our homeowners policy (generally for damage caused by wind or wind driven rain) or specifically excluded coverage caused by flood, estimating additional living expenses, and assessing the impact of demand surge, exposure to mold damage, and the effects of numerous other considerations, including the timing of a catastrophe in relation to other events, such as at or near the end of a financial reporting period, which can affect the availability of information needed to estimate reserves for that reporting period. In these situations, we may need to adapt our practices to accommodate these circumstances in order to determine a best estimate of our losses from a catastrophe. For example, to complete estimates for certain areas affected by catastrophes not yet inspected by our claims adjusting
staff, or where we believed our historical loss development factors were not predictive, we rely on analysis of actual claim notices received compared to total PIF, as well as visual, governmental and third-party information, including aerial photos, using satellites, aircrafts and drones, area observations, and data on wind speed and flood depth to the extent available.
Potential reserve estimate variability The aggregation of numerous micro-level estimates for each business segment, line of insurance, major components of losses (such as coverages and perils), and major states or groups of states for reported losses and IBNR forms the reserve liability recorded in the Consolidated Statements of Financial Position. Because of this detailed approach to developing our reserve estimates, there is not a single set of assumptions that determines our reserve estimates at the consolidated level. Given the numerous micro-level estimates for reported losses and IBNR, management does not believe the processes that we follow will produce a statistically credible or reliable actuarial reserve range that would be meaningful. Reserve estimates, by their very nature, are very complex to determine and subject to significant judgment, and do not represent an exact determination for each outstanding claim. Accordingly, as actual claims, paid losses, and case reserve results emerge, our estimate of the ultimate cost to settle will be different than previously estimated.
To develop a statistical indication of potential reserve variability within reasonably likely possible outcomes, an actuarial technique (stochastic modeling) is applied to the countrywide consolidated data elements for paid losses and paid losses combined with case reserves separately for injury losses, auto physical damage losses, and homeowners losses excluding catastrophe losses. Based on the combined historical variability of the development factors calculated for these data elements, an estimate of the standard error or standard deviation around these reserve estimates is calculated within each accident year for the last twelve years for each type of loss. The variability of these reserve estimates within one standard deviation of the mean (a measure of frequency of dispersion often viewed to be an acceptable level of accuracy) is believed by management to represent a reasonable and statistically probable measure of potential variability. Based on our products and coverages, historical experience, the statistical credibility of our extensive data and stochastic modeling of actuarial chain ladder methodologies used to develop reserve estimates, we estimate that the potential variability of our Allstate Protection reserves, excluding reserves for catastrophe losses, within a reasonable probability of other possible outcomes, may be approximately plus or minus 4%, or plus or minus $800 million in net income applicable to common shareholders. A lower level of variability exists for auto injury losses, which comprise approximately 80% of reserves, due to their relatively stable development patterns over a longer duration of time required to settle claims. Other types of losses, such as auto physical damage, homeowners losses and
The Allstate Corporation 115
2020 Form 10-K Application of Critical Accounting Estimates
other personal lines losses, which comprise about 20% of reserves, tend to have greater variability but are settled in a much shorter period of time. Although this evaluation reflects most reasonably likely outcomes, it is possible the final outcome may fall below or above these amounts. Historical variability of reserve estimates is reported in the Claims and Claims Expense Reserves section of the MD&A.
Reserves for Michigan and New Jersey unlimited personal injury protection Claims and claims expense reserves include reserves for Michigan mandatory unlimited personal injury protection coverage to insureds involved in qualifying motor vehicle accidents. The administration of this program is through the MCCA, a state-mandated, non-profit association of which all insurers actively writing automobile coverage in Michigan are members.
The process employed to estimate MCCA covered losses involves a number of activities including the comprehensive review and interpretation of MCCA actuarial reports, other MCCA members’ reports and our personal injury protection loss trends which have increased in severity over time. A significant portion of incurred claim reserves can be attributed to a small number of catastrophic claims and thus a large portion of the recoverable is similarly concentrated. We conduct comprehensive claim file reviews to develop case reserve type estimates of specific claims, which inform our view of future claim development and longevity of claimants. Each year, we update the actuarial estimate of our ultimate reserves and recoverables. We report our paid and unpaid claims based on MCCA requirements. The MCCA develops its own reserving estimates based on its own reserve methodologies, which may not align with our estimations. The MCCA does not provide member companies with its estimate of a company’s claim costs. We continue to update each comprehensive claim file case reserve estimate when there is a significant change in the status of the claimant, or once every three years if there have been no significant changes.
We provide similar personal injury protection coverage in New Jersey for auto policies issued or renewed in New Jersey prior to 1991 that is administered by PLIGA. We use similar actuarial estimating techniques as for the MCCA exposures to estimate loss reserves for unlimited personal injury protection coverage for policies covered by PLIGA. We continue to update our estimates for these claims as the status of claimant’s changes. However, unlimited coverage was no longer offered after 1991; therefore, no new claimants are being added.
Reserve estimates are confidential and proprietary and by their nature are very complex to determine and subject to significant judgments. Reserve estimates do not represent an exact determination for each outstanding claim. Claims may be subject to litigation. As actual claims, paid losses and case reserve results emerge, our estimate of the ultimate cost to settle may be materially greater or less than previously estimated amounts.
For additional information related to indemnification recoverables, see Item 1 - Regulation, Indemnification Programs and Note 10 of the consolidated financial statements.
Adequacy of reserve estimates We believe our net claims and claims expense reserves are appropriately established based on available methodologies, facts, technology, laws and regulations. We calculate and record a single best reserve estimate, in conformance with generally accepted actuarial standards and practices, for each line of insurance, its components (coverages and perils) and state, for reported losses and for IBNR losses, and as a result we believe that no other estimate is better than our recorded amount. Due to the uncertainties involved, the ultimate cost of losses may vary materially from recorded amounts, which are based on our best estimates.
Discontinued Lines and Coverages reserve estimates
Characteristics of Discontinued Lines exposure Our exposure to asbestos, environmental and other discontinued lines claims arise principally from assumed reinsurance coverage written during the 1960s through the mid-1980s, including reinsurance on primary insurance written on large U.S. companies, and from direct excess commercial insurance written from 1972 through 1985, including substantial excess general liability coverages on large U.S. companies. Additional exposure stems from direct primary commercial insurance written during the 1960s through the mid-1980s. Asbestos claims relate primarily to bodily injuries asserted by claimants who were exposed to asbestos or products containing asbestos. Environmental claims relate primarily to pollution and related clean-up costs. Other discontinued lines exposures primarily relate to general liability and product liability mass tort claims, such as those for medical devices and other products, workers’ compensation claims and claims for various other coverage exposures other than asbestos and environmental.
In 1986, the general liability policy form used by us and others in the property and casualty industry was amended to introduce an “absolute pollution exclusion,” which excluded coverage for environmental damage claims, and to add an asbestos exclusion. Most general liability policies issued prior to 1987 contain annual aggregate limits for product liability coverage. General liability policies issued in 1987 and thereafter contain annual aggregate limits for product liability coverage and annual aggregate limits for all coverages. Our experience to date is that these policy form changes have limited the extent of our exposure to environmental and asbestos claim risks.
Our exposure to liability for asbestos, environmental and other discontinued lines losses manifests differently depending on whether it arises from assumed reinsurance coverage, direct excess commercial insurance or direct primary commercial insurance. The direct insurance coverage we provided that covered asbestos, environmental and other discontinued lines was substantially “excess” in nature.
Application of Critical Accounting Estimates 2020 Form 10-K
Direct excess commercial insurance and reinsurance involve coverage written by us for specific layers of protection above retentions and other insurance plans. The nature of excess coverage and reinsurance provided to other insurers limits our exposure to loss to specific layers of protection in excess of policyholder retention on primary insurance plans. Our exposure is further limited by the significant reinsurance that we had purchased on our direct excess business.
Our assumed reinsurance business involved writing generally small participations in other insurers’ reinsurance programs. The reinsured losses in which we participate may be a proportion of all eligible losses or eligible losses in excess of defined retentions. The majority of our assumed reinsurance exposure, approximately 85%, is for excess of loss coverage, while the remaining 15% is for pro-rata coverage.
Our direct primary commercial insurance business did not include coverage to large asbestos manufacturers. This business comprises a cross section of policyholders engaged in many diverse business sectors throughout the country.
How reserve estimates are established and updated We conduct an annual review in the third quarter to evaluate, establish and adjust as necessary, asbestos, environmental and other discontinued lines reserves. Changes to reserves are recorded in the reporting period in which they are determined. Using established industry and actuarial best practices and assuming no change in the regulatory or economic environment, this detailed and comprehensive methodology determines asbestos reserves based on assessments of the characteristics of exposure (i.e. claim activity, potential liability, jurisdiction, products versus non-products exposure) presented by individual policyholders, and determines environmental reserves based on assessments of the characteristics of exposure (i.e. environmental damages, respective shares of liability of potentially responsible parties, appropriateness and cost of remediation) to pollution and related clean-up costs. The number and cost of these claims are affected by advertising by trial lawyers seeking asbestos plaintiffs, and entities with asbestos exposure seeking bankruptcy protection as a result of asbestos liabilities, initially causing a delay in the reporting of claims, often followed by an acceleration and an increase in claims and claims expenses as settlements occur.
After evaluating our insureds’ probable liabilities for asbestos and environmental claims, we evaluate our insureds’ coverage programs for such claims. We consider our insureds’ total available insurance coverage, including the coverage we issued. We also consider relevant judicial interpretations of policy language and applicable coverage defenses or determinations, if any.
Evaluation of both the insureds’ estimated liabilities and our exposure to the insureds depends heavily on an analysis of the relevant legal issues and litigation environment. This analysis is conducted by our specialized claims adjusting staff and legal counsel.
Based on these evaluations, case reserves are established by claims adjusting staff and actuarial analysis is employed to develop an IBNR reserve, which includes estimated potential reserve development and claims that have occurred but have not been reported. As of December 31, 2020 and 2019, IBNR was 50% and 49%, respectively, of combined net asbestos and environmental reserves.
For both asbestos and environmental reserves, we also evaluate our historical direct net loss and expense paid and incurred experience to assess any emerging trends, fluctuations or characteristics suggested by the aggregate paid and incurred activity. Other discontinued lines reserves are based on considerations similar to those described above, as they relate to the characteristics of specific individual coverage exposures.
Potential reserve estimate variability Establishing Discontinued Lines and Coverages net loss reserves for asbestos, environmental and other discontinued lines claims is subject to uncertainties that are much greater than those presented by other types of property and casualty claims. Among the complications are lack of historical data, long reporting delays, uncertainty as to the number and identity of insureds with potential exposure and unresolved legal issues regarding policy coverage; unresolved legal issues regarding the determination, availability and timing of exhaustion of policy limits; plaintiffs’ evolving and expanding theories of liability; availability and collectability of recoveries from reinsurance; retrospectively determined premiums and other contractual agreements; estimates of the extent and timing of any contractual liability; the impact of bankruptcy protection sought by various asbestos producers and other asbestos defendants; and other uncertainties. There are also complex legal issues concerning the interpretation of various insurance policy provisions and whether those losses are covered, or were ever intended to be covered, and could be recoverable through retrospectively determined premium, reinsurance or other contractual agreements. Courts have reached different and sometimes inconsistent conclusions as to when losses are deemed to have occurred and which policies provide coverage; what types of losses are covered; whether there is an insurer obligation to defend; how policy limits are determined; how policy exclusions and conditions are applied and interpreted; and whether clean-up costs represent insured property damage. Our reserves for asbestos and environmental exposures could be affected by tort reform, class action litigation, and other potential legislation and judicial decisions. Environmental exposures could also be affected by a change in the existing federal Superfund law and similar state statutes. There can be no assurance that any reform legislation will be enacted or that any such legislation will provide for a fair, effective and cost-efficient system for settlement of asbestos or environmental claims. We believe these issues are not likely to be resolved in the near future, and the ultimate costs may vary materially from the amounts currently recorded resulting in material changes in loss reserves. Historical variability of
The Allstate Corporation 117
2020 Form 10-K Application of Critical Accounting Estimates
reserve estimates is demonstrated in the Claims and Claims Expense Reserves section of the MD&A.
Adequacy of reserve estimates Management believes its net loss reserves for asbestos, environmental and other discontinued lines exposures are appropriately established based on available facts, technology, laws, regulations, and assessments of other pertinent factors and characteristics of exposure (i.e. claim activity, potential liability, jurisdiction, products versus non-products exposure) presented by individual policyholders, assuming no change in the legal, legislative or economic environment. Due to the uncertainties and factors described above, management believes it is not practicable to develop a meaningful range for any such additional net loss reserves that may be required.
Further discussion of reserve estimates For further discussion of these estimates and quantification of the impact of reserve estimates, reserve reestimates and assumptions, see Notes 8 and 14 of the consolidated financial statements and the Claims and Claims Expense Reserves section of the MD&A.
Reserve for life-contingent contract benefits estimation Due to the long-term nature of traditional life insurance, life-contingent immediate annuities and voluntary accident and health insurance products, benefits are payable over many years; accordingly, the reserves are calculated as the present value of future expected benefits to be paid, reduced by the present value of future expected net premiums. Long-term actuarial assumptions of future investment yields, mortality, morbidity, policy terminations and expenses are used when establishing the reserve for life-contingent contract benefits payable under these insurance policies. These assumptions, which for traditional life insurance are applied using the net level premium method, include provisions for adverse deviation and generally vary by characteristics such as type of coverage, year of issue and policy duration. Future investment yield assumptions are determined based upon prevailing investment yields as well as estimated reinvestment yields. Mortality, morbidity and policy termination assumptions are based on our experience and industry experience. Expense assumptions include the estimated effects of inflation and expenses to be incurred beyond the premium-paying period. These assumptions are established at the time the policy is issued, are consistent with assumptions for determining DAC amortization for these policies, and are generally not changed during the policy coverage period. However, if actual experience emerges in a manner that is significantly adverse relative to the original assumptions, adjustments to DAC or reserves may be required resulting in a charge to earnings which could have a material effect on our operating results and financial condition.
We periodically review the adequacy of reserves and recoverability of DAC using actual experience and current assumptions. In the event actual experience and current assumptions are adverse compared to the original assumptions and a premium deficiency is determined to exist, any remaining unamortized DAC
balance must be expensed to the extent not recoverable and the establishment of a premium deficiency reserve may be required.
We evaluate our traditional life insurance products, immediate annuities with life contingencies, and voluntary accident and health insurance individually.
In the third quarter of 2020, the premium deficiency evaluation of our immediate annuities with life contingencies resulted in a premium deficiency reserve (“PDR”) of $225 million, pre-tax. Our long-term investment yield assumption was lowered, which resulted in the prior sufficiency changing to a deficiency. The deficiency was recognized as an increase in the reserve for life contingent contract benefits. The original assumptions used to establish reserves were updated to reflect current assumptions, and the primary changes included mortality expectations, where annuitants are living longer than originally anticipated, and long-term investment yields. As of December 31, 2020, our reviews concluded that no additional premium deficiency adjustments were necessary for our immediate annuities with life contingencies.
As of December 31, 2020, traditional life insurance and accident and health insurance both have a substantial sufficiency. In 2019, our reviews concluded that no premium deficiency adjustments were necessary.
We also review these policies for circumstances where projected profits would be recognized in early years followed by projected losses in later years. In 2020 and 2019, our reviews concluded that there were no projected losses following projected profits in each long-term projection.
We will continue to monitor the experience of our traditional life insurance and immediate annuities. We periodically complete comprehensive mortality studies for our structured settlement annuities with life contingencies to determine whether annuitants are living for a longer period than originally estimated. We anticipate that investment and reinvestment yields, mortality, and policy terminations are the factors that would be most likely to require premium deficiency adjustments to reserves or related DAC. Mortality rates and investment and reinvestment yields are the factors that would be most likely to require a profits followed by losses liability accrual.
For further detail on the reserve for life-contingent contract benefits, see Note 9 of the consolidated financial statements.
The pending sale of ALIC and certain affiliates represents approximately 90% of Allstate Life and 75% of Allstate Annuities reserves for life-contingent contract benefits and contractholder funds. For further detail on this transaction, see Note 3 of the consolidated financial statements.
Pension and other postretirement plans net costs and assumptions Our defined benefit pension plans cover most full-time employees, certain part-time employees and employee-agents. Benefits are based primarily on a cash balance formula; however,
Application of Critical Accounting Estimates 2020 Form 10-K
certain participants have a significant portion of their benefits attributable to a former final average pay formula. 87% of the projected benefit obligation (“PBO”) of our primary qualified employee plan is related to the former final average pay formula. See Note 17 of the consolidated financial statements for a discussion of these plans and their effect on the consolidated financial statements.
Our pension and other postretirement benefit costs are calculated using various actuarial assumptions and methodologies. These assumptions include discount rates, health care cost trend rates, inflation, expected returns on plan assets, mortality and other factors. The assumptions utilized in recording the obligations under our pension plans represent our best estimates and we believe they are reasonable based on information as to historical experience and performance as well as other factors that might cause future expectations to differ from past trends.
Net costs for our defined benefit plans are recognized on the Consolidated Statements of Operations and consist of two elements: 1) costs comprised of service and interest costs, expected return of plan assets, amortization of prior service credit and curtailment gains and losses which are reported in property and casualty claims and claims expense, operating costs and expenses, net investment income and, if applicable, restructuring and related charges and 2) remeasurement gains and losses comprised of changes in actuarial assumptions and the difference between actual and expected returns on plan assets which are recognized
immediately in earnings as part of pension and other postretirement remeasurement gains and losses.
We recognize expected returns on plan assets using an unadjusted fair value method. Our policy is to remeasure our pension and postretirement plans on a quarterly basis. We immediately recognize remeasurement of projected benefit obligation and plan assets in earnings as it provides greater transparency of our economic obligations in accounting results and better aligns the recognition of the effects of economic and interest rate changes on pension and other postretirement plan assets and liabilities in the year in which the gains and losses are incurred.
Differences in actual experience or changes in assumptions affect our pension and other postretirement obligations, plan assets and expenses. The primary factors contributing to pension and postretirement remeasurement gains and losses are 1) changes in the discount rate used to value pension and postretirement obligations as of the measurement date, 2) differences between the expected and the actual return on plan assets, 3) changes in demographic assumptions, including mortality and participant experience.
Pension and other postretirement service cost, interest cost, expected return on plan assets and amortization of prior service credits are allocated to our reportable segments. The pension and other postretirement remeasurement gains and losses are reported in the Corporate and Other segment.
| | | | | | | | | | | | | | |
Pension and postretirement benefits remeasurement gains and losses | | | | |
| | For the years ended December 31, |
| ($ in millions) | | 2020 | | 2019 |
| Remeasurement of projected benefit obligation (gains) losses: | | | | |
| Discount rate | | $ | 553 | | | $ | 633 | |
| Other assumptions | | 282 | | | 313 | |
| Remeasurement of plan assets (gains) losses | | (886) | | | (832) | |
| Remeasurement (gains) losses | | $ | (51) | | | $ | 114 | |
Impact of assumption changes to net cost for pension and other postretirement plans Remeasurement gains in 2020 primarily related to favorable asset performance compared to the expected return on plan assets, partially offset by a decrease in the discount rate and changes in actuarial assumptions. Remeasurement losses in 2019 primarily related to a decrease in discount rate and changes in actuarial assumptions, partially offset by favorable asset performance compared to the expected return on plan assets.
The discount rate is based on rates at which expected pension benefits attributable to past employee service could effectively be settled on a present value basis at the measurement date. We develop the assumed discount rate by utilizing the weighted average yield of a theoretical dedicated portfolio derived from non-callable bonds and callable bonds with a make-whole provision available in the Bloomberg corporate bond universe having ratings of at least “AA” by S&P or at least “Aa” by Moody’s on the
measurement date with cash flows that match expected plan benefit requirements. Significant changes in discount rates, such as those caused by changes in the credit spreads, yield curve, the mix of bonds available in the market, the duration of selected bonds and expected benefit payments, may result in volatility in pension cost. The weighted average discount rate used to measure the benefit obligation decreased to 2.51% in 2020 compared to 3.31% in 2019, resulting in losses for 2020.
The expected long-term rate of return on plan assets reflects the average rate of earnings expected on plan assets. While this rate reflects long-term assumptions and is consistent with long-term historical returns, sustained changes in the market or changes in the mix of plan assets may lead to revisions in the assumed long-term rate of return on plan assets that may result in variability of pension cost. Differences between the actual return on plan assets and the expected long-term rate of return on plan assets are immediately recognized through earnings upon
The Allstate Corporation 119
2020 Form 10-K Application of Critical Accounting Estimates
remeasurement. Short-term asset performance can differ significantly from the expected rate of return, especially in volatile markets. In 2020, the actual return on plan assets was higher than the expected return primarily due to a decline in interest rates which increased the fair value of our fixed income investments and strong equity market performance. In 2019, the actual return on plan assets was higher than the expected return due to strong equity market performance and declines in interest rates which increased the fair value of our fixed income investments.
We complete periodic evaluations of demographic information and historical experience that affects our pension and other postretirement obligations to identify any required changes to long-term actuarial assumptions and methodologies. Demographic assumptions affect both our pension and postretirement plans and include elements such as retirement rates and participation rates in our postretirement programs, among other factors.
These actuarial assumption updates affect our pension and other postretirement obligations and are incorporated into our best estimates of these assumptions. Remeasurement losses for other assumptions in 2020 primarily related to a decrease in lump sum interest rates and changes in the estimated percentage of employees taking lump sum distributions. Remeasurement losses for other assumptions in 2019 primarily related to a decrease in lump sum interest rates, recognizing participant experience different from demographic assumptions for mortality, terminations, and retirements and the percentage of employees taking lump sum distributions.
The assumed health care trend rate represents the rate at which health care costs are assumed to increase and is based on historical and expected experience. Assumed health care cost trend rates have a significant effect on the amounts reported for the postretirement health care plans. An increase in the trend rate would increase our obligation and expense.
| | | | | | | | | | | | | | |
Sensitivity of assumption changes included in the calculation of net cost as of December 31, 2020 |
| ($ in millions) | | Basis/percentage point change | | Increase (decrease) to net cost |
| Pension plans discount rate | | +100 basis points | | $ | (873) | |
| -100 basis points | | 1,092 | |
| Expected long-term rate of return on assets | | +100 basis points | | (66) | |
| -100 basis points | | 66 | |
| Postretirement plans assumed health care cost trend rate | | +1% | | 13 | |
| -1% | | (11) | |
Regulation and Legal Proceedings
We are subject to extensive regulation and we are involved in various legal and regulatory actions, all of which have an effect on specific aspects of our business. For a detailed discussion of the legal and regulatory actions in which we are involved, see Note 14 of the consolidated financial statements.
Pending Accounting Standards
There are several pending accounting standards that we have not implemented because the implementation date has not yet occurred. For a discussion of these pending standards, see Note 2 of the consolidated financial statements.
The effect of implementing certain accounting standards on our financial results and financial condition is often based in part on market conditions at the time of implementation of the standard and other factors we are unable to determine prior to implementation. For this reason, we are sometimes unable to estimate the effect of certain pending accounting standards until the relevant authoritative body finalizes these standards or until we implement them.
Item 7A. Quantitative and Qualitative Disclosures About Market Risk
Information required for Item 7A is incorporated by reference to the material under the caption “Market Risk” in Part II, Item 7 of this report.
The Allstate Corporation 121
Item 8. Financial Statements and Supplementary Data
| | | | | | | | | | | |
| Consolidated Financial Statements | | Page |
| | |
| | |
| | |
| Consolidated Statements of Shareholders’ Equity | | |
| | |
| | | |
| | |
| Note 1 | General | | |
| Note 2 | Summary of Significant Accounting Policies | | |
| Note 3 | Acquisitions and Disposition | | |
| Note 4 | Reportable Segments | | |
| Note 5 | Investments | | |
| Note 6 | Fair Value of Assets and Liabilities | | |
| Note 7 | Derivative Financial Instruments and Off-balance Sheet Financial Instruments | | |
| Note 8 | Reserve for Property and Casualty Insurance Claims and Claims Expense | | |
| Note 9 | Reserve for Life-Contingent Contract Benefits and Contractholder Funds | | |
| Note 10 | Reinsurance and Indemnification | | |
| Note 11 | Deferred Policy Acquisition and Sales Inducement Costs | | |
| Note 12 | Capital Structure | | |
| Note 13 | Company Restructuring | | |
| Note 14 | Commitments, Guarantees and Contingent Liabilities | | |
| Note 15 | Income Taxes | | |
| Note 16 | Statutory Financial Information and Dividend Limitations | | |
| Note 17 | Benefit Plans | | |
| Note 18 | Equity Incentive Plans | | |
| Note 19 | Supplemental Cash Flow Information | | |
| Note 20 | Other Comprehensive Income | | |
| Note 21 | Quarterly Results (unaudited) | | |
| | | |
| | |
Financial Statements 2020 Form 10-K
The Allstate Corporation and Subsidiaries
Consolidated Statements of Operations
| | | | | | | | | | | | | | | | | | | | |
| | Years Ended December 31, |
| ($ in millions, except per share data) | | 2020 | | 2019 | | 2018 |
| Revenues | | | | | | |
Property and casualty insurance premiums (net of reinsurance ceded and indemnification programs of $1,141, $1,122 and $1,016) | | $ | 37,073 | | | $ | 36,076 | | | $ | 34,048 | |
Life premiums and contract charges (net of reinsurance ceded of $242, $285 and $290) | | 2,444 | | | 2,501 | | | 2,465 | |
| Other revenue | | 1,065 | | | 1,054 | | | 939 | |
| Net investment income | | 2,853 | | | 3,159 | | | 3,240 | |
| Realized capital gains (losses) | | 1,356 | | | 1,885 | | | (877) | |
| Total revenues | | 44,791 | | | 44,675 | | | 39,815 | |
| | | | | | |
| Costs and expenses | | | | | | |
Property and casualty insurance claims and claims expense (net of reinsurance ceded and indemnification programs of $530, $524 and $1,378) | | 22,001 | | | 23,976 | | | 22,778 | |
| Shelter-in-Place Payback expense | | 948 | | | — | | | — | |
Life contract benefits (net of reinsurance ceded of $155, $165 and $240) | | 2,243 | | | 2,039 | | | 1,973 | |
Interest credited to contractholder funds (net of reinsurance ceded of $27, $20 and $24) | | 638 | | | 640 | | | 654 | |
| Amortization of deferred policy acquisition costs | | 5,630 | | | 5,533 | | | 5,222 | |
| Operating costs and expenses | | 5,732 | | | 5,690 | | | 5,594 | |
| Pension and other postretirement remeasurement (gains) losses | | (51) | | | 114 | | | 468 | |
| Restructuring and related charges | | 259 | | | 41 | | | 67 | |
| Amortization of purchased intangibles | | 118 | | | 126 | | | 105 | |
| | | | | | |
| | | | | | |
| Impairment of purchased intangibles | | — | | | 106 | | | — | |
| Interest expense | | 318 | | | 327 | | | 332 | |
| Total costs and expenses | | 37,836 | | | 38,592 | | | 37,193 | |
| | | | | | |
| Gain on disposition of operations | | 4 | | | 6 | | | 6 | |
| | | | | | |
| Income from operations before income tax expense | | 6,959 | | | 6,089 | | | 2,628 | |
| | | | | | |
| Income tax expense | | 1,383 | | | 1,242 | | | 468 | |
| | | | | | |
Net income | | 5,576 | | | 4,847 | | | 2,160 | |
| | | | | | |
| Preferred stock dividends | | 115 | | | 169 | | | 148 | |
| | | | | | |
Net income applicable to common shareholders | | $ | 5,461 | | | $ | 4,678 | | | $ | 2,012 | |
| | | | | | |
| Earnings per common share: | | | | | | |
| Net income applicable to common shareholders per common share - Basic | | $ | 17.53 | | | $ | 14.25 | | | $ | 5.78 | |
| Weighted average common shares - Basic | | 311.6 | | | 328.2 | | | 347.8 | |
| Net income applicable to common shareholders per common share - Diluted | | $ | 17.31 | | | $ | 14.03 | | | $ | 5.70 | |
| Weighted average common shares - Diluted | | 315.5 | | | 333.5 | | | 353.2 | |
| | | | | | |
| | | | | | |
See notes to consolidated financial statements.
The Allstate Corporation 123
2020 Form 10-K Financial Statements
The Allstate Corporation and Subsidiaries
Consolidated Statements of Comprehensive Income
| | | | | | | | | | | | | | | | | | | | |
| | Years Ended December 31, |
| ($ in millions) | | 2020 | | 2019 | | 2018 |
| Net income | | $ | 5,576 | | | $ | 4,847 | | | $ | 2,160 | |
| | | | | | |
| Other comprehensive income (loss), after-tax | | | | | | |
| Changes in: | | | | | | |
| Unrealized net capital gains and losses | | 1,293 | | | 1,889 | | | (754) | |
| Unrealized foreign currency translation adjustments | | 52 | | | (10) | | | (48) | |
| Unamortized pension and other postretirement prior service credit | | 9 | | | (47) | | | (59) | |
| Other comprehensive income (loss), after-tax | | 1,354 | | | 1,832 | | | (861) | |
| | | | | | |
| Comprehensive income | | $ | 6,930 | | | $ | 6,679 | | | $ | 1,299 | |
See notes to consolidated financial statements.
Financial Statements 2020 Form 10-K
The Allstate Corporation and Subsidiaries
Consolidated Statements of Financial Position
| | | | | | | | | | | | | | |
| | December 31, |
| ($ in millions, except par value data) | | 2020 | | 2019 |
| Assets | | | | |
| Investments | | | | |
Fixed income securities, at fair value (amortized cost, net $61,451 and $56,293) | | $ | 66,354 | | | $ | 59,044 | |
Equity securities, at fair value (cost $3,853 and $6,568) | | 4,710 | | | 8,162 | |
| Mortgage loans, net | | 4,075 | | | 4,817 | |
| Limited partnership interests | | 7,609 | | | 8,078 | |
Short-term, at fair value (amortized cost $7,800 and $4,256) | | 7,800 | | | 4,256 | |
| Other, net | | 3,689 | | | 4,005 | |
| Total investments | | 94,237 | | | 88,362 | |
| Cash | | 377 | | | 338 | |
| Premium installment receivables, net | | 6,479 | | | 6,472 | |
| Deferred policy acquisition costs | | 4,700 | | | 4,699 | |
| Reinsurance and indemnification recoverables, net | | 9,220 | | | 9,211 | |
| Accrued investment income | | 600 | | | 600 | |
| Property and equipment, net | | 1,057 | | | 1,145 | |
| Goodwill | | 2,544 | | | 2,545 | |
| Other assets, net | | 3,429 | | | 3,534 | |
| Separate Accounts | | 3,344 | | | 3,044 | |
| | | | |
| Total assets | | $ | 125,987 | | | $ | 119,950 | |
| Liabilities | | | | |
| Reserve for property and casualty insurance claims and claims expense | | $ | 27,610 | | | $ | 27,712 | |
| Reserve for life-contingent contract benefits | | 12,768 | | | 12,300 | |
| Contractholder funds | | 17,213 | | | 17,692 | |
| Unearned premiums | | 15,949 | | | 15,343 | |
| Claim payments outstanding | | 957 | | | 929 | |
| Deferred income taxes | | 1,355 | | | 1,154 | |
| Other liabilities and accrued expenses | | 8,749 | | | 9,147 | |
| Long-term debt | | 7,825 | | | 6,631 | |
| Separate Accounts | | 3,344 | | | 3,044 | |
| | | | |
| Total liabilities | | 95,770 | | | 93,952 | |
| Commitments and Contingent Liabilities (Note 7, 8 and 14) | | | | |
| Shareholders’ equity | | | | |
Preferred stock and additional capital paid-in, $1 par value, 25 million shares authorized, 81.0 thousand and 92.5 thousand shares issued and outstanding, $2,025 and $2,313 aggregate liquidation preference | | 1,970 | | | 2,248 | |
Common stock, $.01 par value, 2.0 billion shares authorized and 900 million issued, 304 million and 319 million shares outstanding | | 9 | | | 9 | |
| Additional capital paid-in | | 3,498 | | | 3,463 | |
| Retained income | | 52,767 | | | 48,074 | |
| | | | |
Treasury stock, at cost (596 million and 581 million shares) | | (31,331) | | | (29,746) | |
| Accumulated other comprehensive income: | | | | |
| Unrealized net capital gains and losses on fixed income securities with credit losses | | — | | | 70 | |
| Other unrealized net capital gains and losses | | 3,860 | | | 2,094 | |
| Unrealized adjustment to DAC, DSI and insurance reserves | | (680) | | | (277) | |
| Total unrealized net capital gains and losses | | 3,180 | | | 1,887 | |
| Unrealized foreign currency translation adjustments | | (7) | | | (59) | |
| Unamortized pension and other postretirement prior service credit | | 131 | | | 122 | |
| Total accumulated other comprehensive income ("AOCI") | | 3,304 | | | 1,950 | |
| Total shareholders’ equity | | 30,217 | | | 25,998 | |
| Total liabilities and shareholders’ equity | | $ | 125,987 | | | $ | 119,950 | |
See notes to consolidated financial statements.
The Allstate Corporation 125
2020 Form 10-K Financial Statements
The Allstate Corporation and Subsidiaries
Consolidated Statements of Shareholders’ Equity
| | | | | | | | | | | | | | | | | | | | |
| | Years Ended December 31, |
| ($ in millions, except per share data) | | 2020 | | 2019 | | 2018 |
| | | | | | |
| Preferred stock par value | | $ | — | | | $ | — | | | $ | — | |
| Preferred stock additional capital paid-in | | | | | | |
| Balance, beginning of year | | 2,248 | | | 1,930 | | | 1,746 | |
| Preferred stock issuance, net of issuance costs | | — | | | 1,414 | | | 557 | |
| Preferred stock redemption | | (278) | | | (1,096) | | | (373) | |
| Balance, end of year | | 1,970 | | | 2,248 | | | 1,930 | |
| | | | | | |
| Common stock par value | | 9 | | | 9 | | | 9 | |
| Common stock additional capital paid-in | | | | | | |
| Balance, beginning of year | | 3,463 | | | 3,310 | | | 3,313 | |
| Forward contract on accelerated share repurchase agreement | | (38) | | | 75 | | | (105) | |
| Equity incentive plans activity | | 73 | | | 78 | | | 102 | |
| Balance, end of year | | 3,498 | | | 3,463 | | | 3,310 | |
| | | | | | |
| Retained income | | | | | | |
| Balance, beginning of year | | 48,074 | | | 44,033 | | | 41,579 | |
| Cumulative effect of change in accounting principle | | (88) | | | 21 | | | 1,088 | |
| Net income | | 5,576 | | | 4,847 | | | 2,160 | |
Dividends on common stock (declared per share of $2.16, $2.00 and $1.84) | | (680) | | | (658) | | | (646) | |
| Dividends on preferred stock | | (115) | | | (169) | | | (148) | |
| | | | | | |
| Balance, end of year | | 52,767 | | | 48,074 | | | 44,033 | |
| | | | | | |
| Deferred Employee Stock Ownership Plan (“ESOP”) expense | | | | | | |
| Balance, beginning of year | | — | | | (3) | | | (3) | |
| Payments | | — | | | 3 | | | — | |
| Balance, end of year | | — | | | — | | | (3) | |
| | | | | | |
| Treasury stock | | | | | | |
| Balance, beginning of year | | (29,746) | | | (28,085) | | | (25,982) | |
| Shares acquired | | (1,700) | | | (1,810) | | | (2,198) | |
| Shares reissued under equity incentive plans, net | | 115 | | | 149 | | | 95 | |
| Balance, end of year | | (31,331) | | | (29,746) | | | (28,085) | |
| | | | | | |
| Accumulated other comprehensive income (loss) | | | | | | |
| Balance, beginning of year | | 1,950 | | | 118 | | | 1,889 | |
| Cumulative effect of change in accounting principle | | — | | | — | | | (910) | |
| Change in unrealized net capital gains and losses | | 1,293 | | | 1,889 | | | (754) | |
| Change in unrealized foreign currency translation adjustments | | 52 | | | (10) | | | (48) | |
| Change in unamortized pension and other postretirement prior service credit | | 9 | | | (47) | | | (59) | |
| | | | | | |
| Balance, end of year | | 3,304 | | | 1,950 | | | 118 | |
| Total shareholders’ equity | | $ | 30,217 | | | $ | 25,998 | | | $ | 21,312 | |
See notes to consolidated financial statements.
Financial Statements 2020 Form 10-K
The Allstate Corporation and Subsidiaries
Consolidated Statements of Cash Flows
| | | | | | | | | | | | | | | | | | | | |
| | Years Ended December 31, |
| ($ in millions) | | 2020 | | 2019 | | 2018 |
| Cash flows from operating activities | | | | | | |
| Net income | | $ | 5,576 | | | $ | 4,847 | | | $ | 2,160 | |
| Adjustments to reconcile net income to net cash provided by operating activities: | | | | | | |
| Depreciation, amortization and other non-cash items | | 686 | | | 647 | | | 511 | |
| Realized capital (gains) losses | | (1,356) | | | (1,885) | | | 877 | |
| | | | | | |
| Pension and other postretirement remeasurement (gains) losses | | (51) | | | 114 | | | 468 | |
| Gain on disposition of operations | | (4) | | | (6) | | | (6) | |
| Interest credited to contractholder funds | | 638 | | | 640 | | | 654 | |
| Impairment of purchased intangibles | | — | | | 106 | | | — | |
| Changes in: | | | | | | |
| Policy benefits and other insurance reserves | | (682) | | | (508) | | | 469 | |
| Unearned premiums | | 598 | | | 801 | | | 915 | |
| Deferred policy acquisition costs | | (125) | | | (85) | | | (296) | |
| Premium installment receivables, net | | (3) | | | (299) | | | (396) | |
| Reinsurance recoverables, net | | (11) | | | 320 | | | (656) | |
| Income taxes | | (232) | | | 487 | | | (380) | |
| Other operating assets and liabilities | | 457 | | | (50) | | | 855 | |
| Net cash provided by operating activities | | 5,491 | | | 5,129 | | | 5,175 | |
| Cash flows from investing activities | | | | | | |
| Proceeds from sales | | | | | | |
| Fixed income securities | | 31,950 | | | 29,849 | | | 33,183 | |
| Equity securities | | 8,405 | | | 5,277 | | | 6,859 | |
| Limited partnership interests | | 1,350 | | | 756 | | | 764 | |
| Mortgage loans | | 230 | | | — | | | — | |
| Other investments | | 340 | | | 303 | | | 533 | |
| Investment collections | | | | | | |
| Fixed income securities | | 2,235 | | | 2,570 | | | 3,466 | |
| Mortgage loans | | 626 | | | 695 | | | 529 | |
| Other investments | | 209 | | | 254 | | | 488 | |
| Investment purchases | | | | | | |
| Fixed income securities | | (38,121) | | | (31,317) | | | (36,960) | |
| Equity securities | | (4,648) | | | (7,176) | | | (5,936) | |
| Limited partnership interests | | (1,265) | | | (1,332) | | | (1,679) | |
| Mortgage loans | | (203) | | | (844) | | | (664) | |
| Other investments | | (371) | | | (666) | | | (864) | |
| Change in short-term and other investments, net | | (3,871) | | | (725) | | | (603) | |
| Purchases of property and equipment, net | | (308) | | | (433) | | | (277) | |
| Acquisition of operations | | 1 | | | (18) | | | (558) | |
| Net cash used in investing activities | | (3,441) | | | (2,807) | | | (1,719) | |
| Cash flows from financing activities | | | | | | |
| Proceeds from issuance of long-term debt | | 1,189 | | | 491 | | | 498 | |
| Redemption and repayment of long-term debt | | — | | | (317) | | | (400) | |
| Proceeds from issuance of preferred stock | | — | | | 1,414 | | | 557 | |
| Redemption of preferred stock | | (288) | | | (1,132) | | | (385) | |
| Contractholder fund deposits | | 991 | | | 996 | | | 1,010 | |
| Contractholder fund withdrawals | | (1,494) | | | (1,662) | | | (1,967) | |
| Dividends paid on common stock | | (668) | | | (653) | | | (614) | |
| Dividends paid on preferred stock | | (108) | | | (134) | | | (134) | |
| Treasury stock purchases | | (1,737) | | | (1,735) | | | (2,303) | |
| Shares reissued under equity incentive plans, net | | 63 | | | 120 | | | 73 | |
| | | | | | |
| Other | | 41 | | | 129 | | | 91 | |
| Net cash used in financing activities | | (2,011) | | | (2,483) | | | (3,574) | |
| Net increase (decrease) in cash | | 39 | | | (161) | | | (118) | |
| Cash at beginning of year | | 338 | | | 499 | | | 617 | |
| Cash at end of year | | $ | 377 | | | $ | 338 | | | $ | 499 | |
See notes to consolidated financial statements.
The Allstate Corporation 127
2020 Form 10-K Notes to Consolidated Financial Statements
Notes to Consolidated Financial Statements
Basis of presentation
The accompanying consolidated financial statements include the accounts of The Allstate Corporation (the “Corporation”) and its wholly owned subsidiaries, primarily Allstate Insurance Company (“AIC”), a property and casualty insurance company with various property and casualty and life and investment subsidiaries, including Allstate Life Insurance Company (“ALIC”) (collectively referred to as the “Company” or “Allstate”). These consolidated financial statements have been prepared in conformity with accounting principles generally accepted in the United States of America (“GAAP”). All significant intercompany accounts and transactions have been eliminated.
The preparation of financial statements in conformity with GAAP requires management to make estimates and assumptions that affect the amounts reported in the consolidated financial statements and accompanying notes. Actual results could differ from those estimates.
Nature of operations
Allstate is engaged, principally in the United States, in the property and casualty insurance and life insurance businesses. Allstate is one of the country’s largest personal property and casualty insurers and is organized into seven reportable segments: Allstate Protection, Discontinued Lines and Coverages, Protection Services (previously Service Businesses), Allstate Life, Allstate Benefits, Allstate Annuities, and Corporate and Other.
Allstate’s primary business is the sale of private passenger auto and homeowners insurance. The Company also offers several other personal property and casualty insurance products, select commercial property and casualty coverages, consumer product protection plans, device and mobile data collection services and analytic solutions using automotive telematics information, roadside assistance, finance and insurance products, life insurance, voluntary accident and health insurance and identity protection. Allstate primarily distributes its products through exclusive agents, financial specialists, independent agents and brokers, major retailers, contact centers and the internet.
Risks and uncertainties
Allstate has exposure to catastrophic events, including wind and hail, wildfires, tornadoes, hurricanes, tropical storms, earthquakes, volcanic eruptions, terrorism and industrial accidents.
Catastrophes, an inherent risk of the property and casualty insurance business, have contributed, and will continue to contribute, to material year-to-year fluctuations in the Company’s results of operations and financial position (see Note 8). The nature and level of catastrophic loss experienced in any period cannot be
predicted and could be material to results of operations and financial position.
The Company considers the following categories and locations to be the greatest areas of potential catastrophe losses:
•Wildfires — California, Oregon, Colorado, and Texas
•Hurricanes — Major metropolitan centers in counties along the eastern and gulf coasts of the United States
•Wind/Hail, Rain and Tornado — Texas, Illinois, Georgia and Colorado
•Earthquakes and fires following earthquakes —Major metropolitan areas near fault lines in the states of California, Oregon, Washington, South Carolina, Missouri, Kentucky and Tennessee
Recent development
The Novel Coronavirus Pandemic or COVID-19 (“Coronavirus”) resulted in governments worldwide enacting emergency measures to combat the spread of the virus. These measures, which have included the implementation of travel restrictions, government-imposed shelter-in-place orders, quarantine periods, social distancing, and restrictions on large gatherings, have caused material disruption to businesses globally, resulting in increased unemployment, a recession and increased economic uncertainty. Additionally, there is no way of predicting with certainty how long the pandemic might last, including the potential for restrictions being restored or new restrictions being implemented that could result in further economic volatility.
The magnitude and duration of the global pandemic and the impact of actions taken by governmental authorities, businesses and consumers, including timing of vaccine distribution, to mitigate health risks create significant uncertainty. The Company will continue to closely monitor and proactively adapt to developments and changing conditions. Currently, it is not possible to reliably estimate the length and severity of the pandemic or its impact to the Company’s operations, but the effects could be material and may continue, emerge, evolve or accelerate in 2021.
Notes to Consolidated Financial Statements 2020 Form 10-K
| | | | | |
| Note 2 | Summary of Significant Accounting Policies |
Investments
Fixed income securities include bonds, asset-backed securities (“ABS”) and mortgage-backed securities (“MBS”). MBS includes residential and commercial mortgage-backed securities. Fixed income securities, which may be sold prior to their contractual maturity, are designated as available-for-sale (“AFS”) and are carried at fair value. The difference between amortized cost, net of credit loss allowances (“amortized cost, net”) and fair value, net of deferred income taxes and related life and annuity deferred policy acquisition costs (“DAC”), deferred sales inducement costs (“DSI”) and reserves for life-contingent contract benefits, is reflected as a component of AOCI. The Company excludes accrued interest receivable from the amortized cost basis of its AFS fixed income securities. Cash received from calls and make-whole payments is reflected as a component of proceeds from sales and cash received from maturities and pay-downs is reflected as a component of investment collections within the Consolidated Statements of Cash Flows.
Equity securities primarily include common stocks, exchange traded and mutual funds, non-redeemable preferred stocks and real estate investment trust equity investments. Certain exchange traded and mutual funds have fixed income securities as their underlying investments. Equity securities are carried at fair value. Equity securities without readily determinable or estimable fair values are measured using the measurement alternative, which is cost less impairment, if any, and adjustments resulting from observable price changes in orderly transactions for the identical or similar investment of the same issuer.
Mortgage loans and loans reported in other investments (bank loans and agent loans) are carried at amortized cost, net, which represent the amount expected to be collected. The Company excludes accrued interest receivable from the amortized cost basis of its mortgage, bank and agent loans. Credit loss allowances are estimates of expected credit losses, established for loans upon origination or purchase, and are established considering all relevant information available, including past events, current conditions, and reasonable and supportable forecasts over the life of the loans. Loans are evaluated on a pooled basis when they share similar risk characteristics; otherwise, they are evaluated individually.
Investments in limited partnership interests are primarily accounted for in accordance with the equity method of accounting (“EMA”) and include interests in private equity funds, real estate funds and other funds. Investments in limited partnership interests purchased prior to January 1, 2018, where the Company’s interest is so minor that it exercises virtually no influence over operating and financial policies, are accounted for at fair value primarily utilizing the net asset value (“NAV”) as a practical expedient to determine fair value.
Short-term investments, including money market funds, commercial paper, U.S. Treasury bills and other
short-term investments, are carried at fair value. Other investments primarily consist of bank loans, policy loans, real estate, agent loans and derivatives. Bank loans are primarily senior secured corporate loans. Policy loans are carried at unpaid principal balances. Real estate is carried at cost less accumulated depreciation. Agent loans are loans issued to exclusive Allstate agents. Derivatives are carried at fair value.
Investment income primarily consists of interest, dividends, income from limited partnership interests, rental income from real estate, and income from certain derivative transactions. Interest is recognized on an accrual basis using the effective yield method and dividends are recorded at the ex-dividend date. Interest income for ABS and MBS is determined considering estimated pay-downs, including prepayments, obtained from third-party data sources and internal estimates. Actual prepayment experience is periodically reviewed, and effective yields are recalculated when differences arise between the prepayments originally anticipated and the actual prepayments received and currently anticipated. For ABS and MBS of high credit quality with fixed interest rates, the effective yield is recalculated on a retrospective basis. For all others, the effective yield is generally recalculated on a prospective basis. Net investment income for AFS fixed income securities includes the impact of accreting the credit loss allowance for the time value of money. Accrual of income is suspended for fixed income securities when the timing and amount of cash flows expected to be received is not reasonably estimable. Accrual of income is suspended for mortgage loans, bank loans and agent loans that are in default or when full and timely collection of principal and interest payments is not probable. Accrued income receivable is monitored for recoverability and when not expected to be collected is written off through net investment income. Cash receipts on investments on nonaccrual status are generally recorded as a reduction of amortized cost. Income from limited partnership interests carried at fair value is recognized based upon the changes in fair value of the investee’s equity primarily determined using NAV. Income from EMA limited partnership interests is recognized based on the Company’s share of the partnerships’ earnings. Income from EMA limited partnership interests is generally recognized on a three month delay due to the availability of the related financial statements from investees.
Realized capital gains and losses include gains and losses on investment sales, changes in the credit loss allowances related to fixed income securities, mortgage loans, bank loans and agent loans, impairments, valuation changes of equity investments, including equity securities and certain limited partnerships where the underlying assets are predominately public equity securities, and periodic changes in fair value and settlements of certain derivatives, including hedge ineffectiveness. Realized capital gains and losses on investment sales are determined on a specific identification basis and are
The Allstate Corporation 129
2020 Form 10-K Notes to Consolidated Financial Statements
net of credit losses already recognized through an allowance.
Derivative and embedded derivative financial instruments
Derivative financial instruments include interest rate swaps, credit default swaps, futures (interest rate and equity), options (including swaptions), interest rate caps, warrants and rights, foreign currency swaps, foreign currency forwards, total return swaps and certain investment risk transfer reinsurance agreements. Derivatives required to be separated from the host instrument and accounted for as derivative financial instruments (“subject to bifurcation”) are embedded in equity-indexed life and annuity contracts and reinsured variable annuity contracts.
All derivatives are accounted for on a fair value basis and reported as other investments, other assets, other liabilities and accrued expenses or contractholder funds. Embedded derivative instruments subject to bifurcation are also accounted for on a fair value basis and are reported together with the host contract. The change in fair value of derivatives embedded in life and annuity product contracts and subject to bifurcation is reported in life and annuity contract benefits or interest credited to contractholder funds. Cash flows from embedded derivatives subject to bifurcation and derivatives receiving hedge accounting are reported consistently with the host contracts and hedged risks, respectively, within the Consolidated Statements of Cash Flows. Cash flows from other derivatives are reported in cash flows from investing activities within the Consolidated Statements of Cash Flows.
When derivatives meet specific criteria, they may be designated as accounting hedges and accounted for as fair value, cash flow, foreign currency fair value or foreign currency cash flow hedges. The hedged item may be either all or a specific portion of a recognized asset, liability or an unrecognized firm commitment attributable to a particular risk for fair value hedges. At the inception of the hedge, the Company formally documents the hedging relationship and risk management objective and strategy. The documentation identifies the hedging instrument, the hedged item, the nature of the risk being hedged and the methodology used to assess the effectiveness of the hedging instrument in offsetting the exposure to changes in the hedged item’s fair value attributable to the hedged risk. For a cash flow hedge, this documentation includes the exposure to changes in the variability in cash flows attributable to the hedged risk. The Company does not exclude any component of the change in fair value of the hedging instrument from the effectiveness assessment. At each reporting date, the Company confirms that the hedging instrument continues to be highly effective in offsetting the hedged risk.
Fair value hedges The change in fair value of hedging instruments used in fair value hedges of investment assets or a portion thereof is reported in net investment income, together with the change in
fair value of the hedged items. The change in fair value of hedging instruments used in fair value hedges of contractholder funds liabilities or a portion thereof is reported in interest credited to contractholder funds, together with the change in fair value of the hedged items. Accrued periodic settlements on swaps are reported together with the changes in fair value of the related swaps in net investment income or interest credited to contractholder funds. The amortized cost, net for fixed income securities or the carrying value of a designated hedged liability is adjusted for the change in fair value of the hedged risk.
Cash flow hedges For hedging instruments used in cash flow hedges, the changes in fair value of the derivatives are reported in AOCI. Amounts are reclassified to net investment income, realized capital gains and losses or interest expense as the hedged or forecasted transaction affects income. Accrued periodic settlements on derivatives used in cash flow hedges are reported in net investment income. The amount reported in AOCI for a hedged transaction is the cumulative gain or loss on the derivative instrument from inception of the hedge less gains or losses previously reclassified from AOCI into income. If the Company expects at any time that the loss reported in AOCI would lead to a net loss on the combination of the hedging instrument and the hedged transaction which may not be recoverable, a loss is recognized immediately in realized capital gains and losses. If an impairment loss is recognized on an asset or an additional obligation is incurred on a liability involved in a hedge transaction, any offsetting gain in AOCI is reclassified and reported together with the impairment loss or recognition of the obligation.
Termination of hedge accounting If, subsequent to entering into a hedge transaction, the derivative becomes ineffective (including if the hedged item is sold or otherwise extinguished, the occurrence of a hedged forecasted transaction is no longer probable or the hedged asset has a credit loss), the Company may terminate the derivative position. The Company may also terminate derivative instruments or redesignate them as non-hedge as a result of other events or circumstances. If the derivative instrument is not terminated when a fair value hedge is no longer effective, the future gains and losses recognized on the derivative are reported in realized capital gains and losses. When a fair value hedge is no longer effective, is redesignated as non-hedge or when the derivative has been terminated, the fair value gain or loss on the hedged asset, liability or portion thereof previously recognized in income while the hedge was in place and used to adjust the amortized cost, net of hedged fixed income securities or mortgage loans or carrying value of a hedged liability, is amortized over the remaining life of the hedged asset, liability or portion thereof, and reflected in net investment income or interest credited to contractholder funds beginning in the period that hedge accounting is no longer applied.
When a derivative instrument used in a cash flow hedge of an existing asset or liability is no longer effective or is terminated, the gain or loss recognized on the derivative is reclassified from AOCI to income as
Notes to Consolidated Financial Statements 2020 Form 10-K
the hedged risk impacts income. If the derivative instrument is not terminated when a cash flow hedge is no longer effective, future gains and losses recognized on the derivative are reported in realized capital gains and losses. When a derivative instrument used in a cash flow hedge of a forecasted transaction is terminated because it is probable the forecasted transaction will not occur, the gain or loss recognized on the derivative is immediately reclassified from AOCI to realized capital gains and losses in the period that hedge accounting is no longer applied.
Non-hedge derivative financial instruments For derivatives for which hedge accounting is not applied, the income statement effects, including fair value gains and losses and accrued periodic settlements, are reported either in realized capital gains and losses or in a single line item together with the results of the associated asset or liability for which risks are being managed.
Securities loaned
The Company’s business activities include securities lending transactions, which are used primarily to generate net investment income. The proceeds received in conjunction with securities lending transactions can be reinvested in short-term investments or fixed income securities. These transactions are short-term in nature, usually 30 days or less.
The Company receives cash collateral for securities loaned in an amount generally equal to 102% and 105% of the fair value of domestic and foreign securities, respectively, and records the related obligations to return the collateral in other liabilities and accrued expenses. The carrying value of these obligations approximates fair value because of their relatively short-term nature. The Company monitors the market value of securities loaned on a daily basis and obtains additional collateral as necessary under the terms of the agreements to mitigate counterparty credit risk. The Company maintains the right and ability to repossess the securities loaned on short notice.
Recognition of premium revenues and contract charges, and related benefits and interest credited
Property and casualty insurance premiums include premiums from personal lines policies, protection plans, other contracts (primarily finance and insurance products) and roadside assistance.
Personal lines insurance premiums are deferred and earned on a pro-rata basis over the terms of the policies, typically periods of six or twelve months.
Revenues related to protection plans, other contracts (primarily finance and insurance products) and roadside assistance are deferred and earned over the term of the contract in a manner that recognizes revenue as obligations under the contracts are performed. Revenues from these products are classified as premiums as the products are backed by insurance. Protection plans and finance and insurance premiums are recognized using a cost-based incurrence method over the term of the contracts, which is generally over one to five years. Roadside
assistance premiums are recognized evenly over the term of the contract as performance obligations are fulfilled.
The portion of premiums written applicable to the unexpired terms of the policies is recorded as unearned premiums.
| | | | | | | | | | | | | | |
Unearned premiums |
| | As of December 31, |
| ($ in millions) | | 2020 | | 2019 |
| Allstate Protection | | $ | 12,772 | | | $ | 12,567 | |
Protection Services | | 3,167 | | | 2,765 | |
| Total | | $ | 15,939 | | | $ | 15,332 | |
For the year ended December 31, 2020, the Company recognized $1.11 billion of Property and casualty insurance premiums for Protection Services that were included in the unearned premium balance as of December 31, 2019.
For the year ended December 31, 2019, the Company recognized $996 million of Property and casualty insurance premiums for Protection Services that were included in the unearned premium balance as of December 31, 2018.
The Company expects to recognize approximately $1.30 billion, $861 million and $1.00 billion of the December 31, 2020 the unearned premium balance in 2021, 2022 and thereafter, respectively.
Premium installment receivables represent premiums written and not yet collected, net of the credit loss allowance for uncollectible premiums. These receivables are primarily outstanding for one year or less. The Company utilizes historical internal data including aging analyses to estimate allowances under current conditions and for the forecast period. The Company regularly evaluates and updates the data and adjusts its allowance as appropriate.
The increase in the provision for credit losses primarily related to customer enrollment in the Allstate Special Payment plan implemented in response to the Coronavirus, starting in March 2020.
| | | | | | | | |
| Rollforward of credit loss allowance for premium installment receivables |
| ($ in millions) | | For the year ended December 31, 2020 |
| Beginning balance | | $ | (91) | |
| Increase in the provision for credit losses | | (223) | |
| Write-off of uncollectible premium installment receivable amounts | | 161 | |
| Ending balance | | $ | (153) | |
Traditional life insurance products consist principally of products with fixed and guaranteed premiums and benefits, primarily term and whole life insurance products. Voluntary accident and health insurance products are expected to remain in force for an extended period and therefore are primarily classified as long-duration contracts. Premiums from these products are recognized as revenue when due from policyholders, net of any credit loss allowance for uncollectible premiums. Benefits are reflected in
The Allstate Corporation 131
2020 Form 10-K Notes to Consolidated Financial Statements
contract benefits and recognized over the life of the policy in relation to premiums.
Immediate annuities with life contingencies, including certain structured settlement annuities, provide benefits over a period that extends beyond the period during which premiums are collected. Premiums from these products are recognized as revenue when received at the inception of the contract. Benefits are recognized in relation to premiums with the establishment of a reserve. The change in reserve over time is recorded in contract benefits and primarily relates to accumulation at the discount rate and annuitant mortality. Profits from these policies come primarily from investment income, which is recognized over the life of the contract.
Interest-sensitive life contracts, such as universal life and single premium life, are insurance contracts whose terms are not fixed and guaranteed. The terms that may be changed include premiums paid by the contractholder, interest credited to the contractholder account balance and contract charges assessed against the contractholder account balance. Premiums from these contracts are reported as contractholder fund deposits. Contract charges consist of fees assessed against the contractholder account balance for the cost of insurance (mortality risk), contract administration and surrender of the contract prior to contractually specified dates. These contract charges are recognized as revenue when assessed against the contractholder account balance. Contract benefits include life-contingent benefit payments in excess of the contractholder account balance.
Contracts that do not subject the Company to significant risk arising from mortality or morbidity are referred to as investment contracts. Fixed annuities, including market value adjusted annuities, equity-indexed annuities and immediate annuities without life contingencies, are considered investment contracts. Consideration received for such contracts is reported as contractholder fund deposits. Contract charges for investment contracts consist of fees assessed against the contractholder account balance for maintenance, administration and surrender of the contract prior to contractually specified dates, and are recognized when assessed against the contractholder account balance.
Interest credited to contractholder funds represents interest accrued or paid on interest-sensitive life and investment contracts. Crediting rates for certain fixed annuities and interest-sensitive life contracts are adjusted periodically by the Company to reflect current market conditions subject to contractually guaranteed minimum rates. Crediting rates for indexed life and annuities are generally based on a specified interest rate index or an equity index, such as the Standard & Poor’s 500 Index (“S&P 500”). Interest credited also includes amortization of DSI expenses. DSI is amortized into interest credited using the same method used to amortize DAC.
Contract charges for variable life and variable annuity products consist of fees assessed against the contractholder account balances for contract maintenance, administration, mortality, expense and
surrender of the contract prior to contractually specified dates. Contract benefits incurred for variable annuity products include guaranteed minimum death, income, withdrawal and accumulation benefits. Substantially all of the Company’s variable annuity business is ceded through reinsurance agreements and the contract charges and contract benefits related thereto are reported net of reinsurance ceded.
Other revenue
Other revenue represents fees collected from policyholders relating to premium installment payments, commissions on sales of non-proprietary products, sales of identity protection services, fee-based services and other revenue transactions. Other revenue is recognized when performance obligations are fulfilled.
Deferred policy acquisition and sales inducement costs
Costs that are related directly to the successful acquisition of new or renewal insurance policies and investment contracts are deferred and recorded as DAC. These costs are principally agent and broker remuneration, premium taxes and certain underwriting expenses. DSI costs, which are deferred and recorded as other assets, relate to sales inducements offered on sales to new customers, principally on fixed annuity and interest-sensitive life contracts. These sales inducements are primarily in the form of additional credits to the customer’s account balance or enhancements to interest credited for a specified period which are in excess of the rates currently being credited to similar contracts without sales inducements. DSI is amortized into income using the same methodology and assumptions as DAC and is included in interest credited to contractholder funds. All other acquisition costs are expensed as incurred and included in operating costs and expenses.
For property and casualty insurance, DAC is amortized into income as premiums are earned, typically over periods of six or twelve months for personal lines policies or generally one to five years for protection plans and other contracts (primarily related to finance and insurance products), and is included in amortization of deferred policy acquisition costs. DAC associated with property and casualty insurance is periodically reviewed for recoverability and adjusted if necessary. Future investment income is considered in determining the recoverability of DAC.
For traditional life and voluntary accident and health insurance, DAC is amortized over the premium paying period of the related policies in proportion to the estimated revenues on such business. Assumptions used in the amortization of DAC and reserve calculations are established at the time the policy is issued and are generally not revised during the life of the policy. Any deviations from projected business in force resulting from actual policy terminations differing from expected levels and any estimated premium deficiencies may result in a change to the rate of amortization in the period such events occur. Generally, the amortization periods for these policies approximates the estimated lives of the
Notes to Consolidated Financial Statements 2020 Form 10-K
policies. The Company periodically reviews the recoverability of DAC using actual experience and current assumptions. Traditional life insurance products, immediate annuities with life contingencies, and voluntary accident and health insurance products are reviewed individually. If actual experience and current assumptions are adverse compared to the original assumptions and a premium deficiency is determined to exist, any remaining unamortized DAC balance would be expensed to the extent not recoverable and the establishment of a premium deficiency reserve may be required for any remaining deficiency.
For interest-sensitive life insurance, DAC and DSI are amortized in proportion to the incidence of the total present value of gross profits, which includes both actual historical gross profits (“AGP”) and estimated future gross profits (“EGP”) expected to be earned over the estimated lives of the contracts. The amortization is net of interest on the prior period DAC balance using rates established at the inception of the contracts. Actual amortization periods generally range from 15-30 years; however, incorporating estimates of the rate of customer surrenders, partial withdrawals and deaths generally results in the majority of the DAC being amortized during the surrender charge period, which is typically 10-20 years for interest-sensitive life. The rate of DAC and DSI amortization is reestimated and adjusted by a cumulative charge or credit to income when there is a difference between the incidence of actual versus expected gross profits in a reporting period or when there is a change in total EGP. When DAC or DSI amortization or a component of gross profits for a quarterly period is potentially negative (which would result in an increase of the DAC or DSI balance) as a result of negative AGP, the specific facts and circumstances surrounding the potential negative amortization are considered to determine whether it is appropriate for recognition in the consolidated financial statements. Negative amortization is only recorded when the increased DAC or DSI balance is determined to be recoverable based on facts and circumstances. Recapitalization of DAC and DSI is limited to the originally deferred costs plus interest.
AGP and EGP primarily consist of the following components: contract charges for the cost of insurance less mortality costs and other benefits; investment income and realized capital gains and losses less interest credited; and surrender and other contract charges less maintenance expenses. The principal assumptions for determining the amount of EGP are mortality, persistency, expenses, investment returns, including capital gains and losses on assets supporting contract liabilities, interest crediting rates to contractholders, and the effects of any hedges. For products whose supporting investments are exposed to capital losses in excess of the Company’s expectations which may cause periodic AGP to become temporarily negative, EGP and AGP utilized in DAC and DSI amortization may be modified to exclude the excess capital losses.
The Company performs quarterly reviews of DAC and DSI recoverability for interest-sensitive life and fixed annuity contracts using current assumptions. If a change in the amount of EGP is significant, it could result in the unamortized DAC or DSI not being recoverable, resulting in a charge which is included as a component of amortization of deferred policy acquisition costs or interest credited to contractholder funds, respectively.
The DAC and DSI balances presented include adjustments to reflect the amount by which the amortization of DAC and DSI would increase or decrease if the unrealized capital gains or losses in the respective product investment portfolios were actually realized. The adjustments are recorded net of tax in AOCI. DAC, DSI and deferred income taxes determined on unrealized capital gains and losses and reported in AOCI recognize the impact on shareholders’ equity consistently with the amounts that would be recognized in the income statement on realized capital gains and losses.
Customers of the Company may exchange one insurance policy or investment contract for another offered by the Company, or make modifications to an existing investment, life or property and casualty contract issued by the Company. These transactions are identified as internal replacements for accounting purposes. Internal replacement transactions determined to result in replacement contracts that are substantially unchanged from the replaced contracts are accounted for as continuations of the replaced contracts. Unamortized DAC and DSI related to the replaced contracts continue to be deferred and amortized in connection with the replacement contracts. For interest-sensitive life and investment contracts, the EGP of the replacement contracts are treated as a revision to the EGP of the replaced contracts in the determination of amortization of DAC and DSI. For traditional life and property and casualty insurance policies, any changes to unamortized DAC that result from replacement contracts are treated as prospective revisions. Any costs associated with the issuance of replacement contracts are characterized as maintenance costs and expensed as incurred. Internal replacement transactions determined to result in a substantial change to the replaced contracts are accounted for as an extinguishment of the replaced contracts, and any unamortized DAC and DSI related to the replaced contracts are eliminated with a corresponding charge to amortization of deferred policy acquisition costs or interest credited to contractholder funds, respectively.
The costs assigned to the right to receive future cash flows from certain business purchased from other insurers are also classified as DAC in the Consolidated Statements of Financial Position. The costs capitalized represent the present value of future profits expected to be earned over the lives of the contracts acquired. These costs are amortized as profits emerge over the lives of the acquired business and are periodically evaluated for recoverability. The present value of future profits was $25 million and $39 million as of December 31, 2020 and 2019, respectively.
The Allstate Corporation 133
2020 Form 10-K Notes to Consolidated Financial Statements
Amortization expense of the present value of future profits was $14 million, $6 million and $2 million in 2020, 2019 and 2018, respectively.
Reinsurance and Indemnification
Reinsurance In the normal course of business, the Company seeks to limit aggregate and single exposure to losses on large risks by purchasing reinsurance. The Company has also used reinsurance to affect the disposition of certain blocks of business. Reinsurance does not extinguish the Company’s primary liability under the policies written. Therefore, in addition to establishing allowances as appropriate after evaluating reinsurers’ activities related to claims settlement practices and commutations, the Company evaluates reinsurer counterparty credit risk and records reinsurance recoverables net of credit loss allowances. The Company assesses counterparty credit risk for individual reinsurers separately when more relevant or on a pooled basis when shared risk characteristics exist. The evaluation considers the credit quality of the reinsurer and the period over which the recoverable balances are expected to be collected. The Company considers factors including past events, current conditions and reasonable and supportable forecasts in the development of the estimate of credit loss allowances.
Allowances for property and casualty and life reinsurance recoverables are established primarily through risk-based evaluations.
The property and casualty recoverable evaluation considers the credit rating of the reinsurer, the period over which the reinsurance recoverable balances are expected to be recovered and other relevant factors including historical experience of reinsurer failures. Reinsurers in liquidation or in default status are evaluated individually using the Company’s historical liquidation recovery assumptions and any other relevant information available including the most recent public information related to the financial condition or liquidation status of the reinsurer.
For life reinsurance recoverables, the Company uses a probability of default and loss given default model developed independently of the Company to estimate current expected credit losses. The life reinsurance recoverable evaluation utilizes factors including historical industry factors based on the probability of liquidation, and incorporates current loss given default factors reflective of the industry.
The Company monitors the credit ratings of reinsurer counterparties and evaluates the circumstances surrounding credit rating changes as inputs into its credit loss assessments. Uncollectible reinsurance recoverable balances are written off against the allowances when there is no reasonable expectation of recovery.
The changes in the allowances are reported in property and casualty insurance claims and claims expense and life contract benefits.
Indemnification The Company also participates in various indemnification mechanisms, including industry pools and facilities, which are reimbursement
mechanisms that assess participating insurers for expected insured claims, reimburse participating insurers for qualifying paid claims and permit participating insurers to recoup amounts assessed directly from insureds. Indemnification recoverables are backed by the financial resources of the property and casualty insurance company market participants.
The amounts reported as indemnification recoverables include amounts paid and due from indemnitors as well as estimates of amounts expected to be recovered from indemnitors on insurance liabilities that have been incurred but not yet paid. The design and function of these indemnification programs does not result in the retention of insurance or reinsurance risk by the indemnitor. Based on the Company’s evaluation of these programs on an individual basis, the establishment of credit loss allowances is not warranted at this time. The Company has not experienced any historical credit losses related to its indemnification programs. The Company continues to monitor these programs to determine whether any changes from historical experience have emerged or are expected to emerge or whether there have been any changes in the design or administration of the programs that would require establishment of credit loss allowances.
Goodwill
Goodwill represents the excess of amounts paid for acquiring businesses over the fair value of the net assets acquired, less any impairment of goodwill recognized. The Company’s goodwill reporting units are equivalent to its reportable segments, Allstate Protection, Protection Services, Allstate Life and Allstate Benefits to which goodwill has been assigned.
| | | | | | | | | | | | | | |
Goodwill by reporting unit |
| | As of December 31, |
| ($ in millions) | | 2020 | | 2019 |
| Allstate Protection | | $ | 810 | | | $ | 810 | |
| | | | |
Protection Services | | 1,463 | | | 1,464 | |
| Allstate Life | | 175 | | | 175 | |
| Allstate Benefits | | 96 | | | 96 | |
| | | | |
| | | | |
| Total | | $ | 2,544 | | | $ | 2,545 | |
Goodwill is recognized when acquired and allocated to reporting units based on which unit is expected to benefit from the synergies of the business combination. Goodwill is not amortized but is tested for impairment at least annually. The Company performs its annual goodwill impairment testing during the fourth quarter of each year based upon data as of the close of the third quarter. Goodwill impairment is measured and recognized as the amount by which a reporting unit’s carrying value, including goodwill, exceeds its fair value, not to exceed the carrying amount of goodwill allocated to the reporting unit. The Company also reviews goodwill for impairment whenever events or changes in circumstances, such as deteriorating or adverse market conditions, indicate that it is more likely than not that the carrying amount of the reporting unit including goodwill may exceed the fair value of the reporting unit. The goodwill impairment analysis is performed at the reporting unit level.
Notes to Consolidated Financial Statements 2020 Form 10-K
As of December 31, 2020 and 2019, the fair value of the Company’s goodwill reporting units exceeded their carrying values.
On January 26, 2021 the Company announced an agreement to sell ALIC and certain affiliates involving business in both the Allstate Life and Allstate Annuities segments. As a result of the pending sale of ALIC and certain affiliates, the Company’s goodwill will be reduced by $175 million.
Intangible assets
Intangible assets (reported in other assets) consist of capitalized costs primarily related to acquired customer relationships, trade names and licenses, technology and other assets. The estimated useful lives of customer relationships, technology and other intangible assets are generally 10 years, 5 years and 7 years, respectively. Intangible assets are carried at cost less accumulated amortization. Amortization expense is calculated using an accelerated amortization method. Amortization expense on intangible assets was $118 million, $126 million and $105 million in 2020, 2019 and 2018, respectively.
| | | | | | | | | | |
Amortization expense of intangible assets for the next five years and thereafter |
| ($ in millions) | | | | |
| 2021 | | | | $ | 91 | |
| 2022 | | | | 74 | |
| 2023 | | | | 60 | |
| 2024 | | | | 45 | |
| 2025 | | | | 33 | |
| Thereafter | | | | 31 | |
| Total amortization | | | | $ | 334 | |
Accumulated amortization on intangible assets was $751 million and $633 million as of December 31, 2020 and 2019, respectively. Trade names and licenses are considered to have an indefinite useful life and are reviewed for impairment at least annually or more frequent if circumstances arise that indicate an impairment may have occurred. An impairment is recognized if the carrying amount of the asset exceeds its estimated fair value.
| | | | | | | | | | | | | | |
Intangible assets by type |
| | As of December 31, |
| ($ in millions) | | 2020 | | 2019 |
| Customers relationships | | $ | 322 | | | $ | 419 | |
| Trade names and licenses | | 37 | | | 38 | |
| | | | |
| Technology and other | | 94 | | | 24 | |
| Total | | $ | 453 | | | $ | 481 | |
During second quarter 2019, the Company made the decision to phase-out the use of the SquareTrade trade name in the United States and sell consumer protection plans under the Allstate Protection Plans name. The SquareTrade trade name will continue to be used outside of the United States. The change required an impairment evaluation of the indefinite-lived intangible asset recognized in the Protection Services segment for SquareTrade’s trade name recorded when SquareTrade was acquired in 2017.
During fourth quarter 2019, the Company made the decision to integrate Esurance into the Allstate brand as part of Transformative Growth. This required an impairment evaluation of the indefinite-lived intangible asset recognized in the Allstate Protection segment for the Esurance trade name recorded when Esurance was acquired in 2011.
As a result of these actions, the Company recognized total impairment charges of $106 million pre-tax during 2019.
Property and equipment
Property and equipment is carried at cost less accumulated depreciation. Included in property and equipment are capitalized costs related to computer software licenses and software developed for internal use. These costs generally consist of certain external payroll and payroll related costs. Property and equipment depreciation is calculated using the straight-line method over the estimated useful lives of the assets, generally 3 to 10 years for equipment and 40 years for real property. Depreciation expense is reported in operating costs and expenses. Accumulated depreciation on property and equipment was $2.81 billion and $2.60 billion as of December 31, 2020 and 2019, respectively. Depreciation expense on property and equipment was $353 million, $326 million and $299 million in 2020, 2019 and 2018, respectively. The Company reviews its property and equipment for impairment at least annually and whenever events or changes in circumstances indicate that the carrying amount may not be recoverable.
Income taxes
Income taxes are accounted for using the asset and liability method under which deferred tax assets and liabilities are recognized for temporary differences between the financial reporting and tax bases of assets and liabilities at the enacted tax rates. The principal assets and liabilities giving rise to such differences are DAC, unearned premiums, investments (including unrealized capital gains and losses) and insurance reserves. A deferred tax asset valuation allowance is established when it is more likely than not such assets will not be realized. The Company recognizes interest expense related to income tax matters in income tax expense and penalties in other expense.
Reserve for property and casualty insurance claims and claims expense
The reserve for property and casualty insurance claims and claims expense is the estimate of amounts necessary to settle all reported and unreported incurred claims for the ultimate cost of insured property and casualty losses, based upon the facts of each case and the Company’s experience with similar cases. Estimated amounts of salvage and subrogation are deducted from the reserve for claims and claims expense. The establishment of appropriate reserves, including reserves for catastrophe losses, is an inherently uncertain and complex process. Reserve estimates are primarily derived using an actuarial estimation process in which historical loss patterns are applied to actual paid losses and reported losses (paid
The Allstate Corporation 135
2020 Form 10-K Notes to Consolidated Financial Statements
losses plus individual case reserves established by claim adjusters) for an accident or report year to create an estimate of how losses are likely to develop over time. Development factors are calculated quarterly and periodically throughout the year for data elements such as claims reported and settled, paid losses, and paid losses combined with case reserves. The historical development patterns for these data elements are used as the assumptions to calculate reserve estimates, including the reserves for reported and unreported claims. Reserve estimates are regularly reviewed and updated, using the most current information available. Any resulting reestimates are reflected in current results of operations.
Reserve for life-contingent contract benefits
The reserve for life-contingent contract benefits payable under insurance policies, including traditional life insurance, life-contingent immediate annuities and voluntary accident and health insurance products, is computed on the basis of long-term actuarial assumptions of future investment yields, mortality, morbidity, policy terminations and expenses. These assumptions, which for traditional life insurance are applied using the net level premium method, include provisions for adverse deviation and generally vary by characteristics such as type of coverage, year of issue and policy duration. The assumptions are established at the time the policy is issued and are generally not changed during the life of the policy. The Company periodically reviews the adequacy of reserves using actual experience and current assumptions. If actual experience and current assumptions are adverse compared to the original assumptions and a premium deficiency is determined to exist, any remaining unamortized DAC balance would be expensed to the extent not recoverable and the establishment of a premium deficiency reserve may be required for any remaining deficiency. Traditional life insurance products, immediate annuities with life contingencies, and voluntary accident and health insurance are reviewed individually. The Company also reviews these policies for circumstances where projected profits would be recognized in early years followed by projected losses in later years. If this circumstance exists, the Company will accrue a liability, during the period of profits, to offset the losses at such time as the future losses are expected to commence using a method updated prospectively over time. To the extent that unrealized gains on fixed income securities would result in a premium deficiency if those gains were realized, the related increase in reserves for certain immediate annuities with life contingencies is recorded net of tax as a reduction of unrealized net capital gains included in AOCI.
Contractholder funds
Contractholder funds represent interest-bearing liabilities arising from the sale of products such as interest-sensitive life insurance and fixed annuities. Contractholder funds primarily comprise cumulative deposits received and interest credited to the contractholder less cumulative contract benefits, surrenders, withdrawals and contract charges for
mortality or administrative expenses. Contractholder funds also include reserves for secondary guarantees on interest-sensitive life insurance and certain fixed annuity contracts and reserves for certain guarantees on reinsured variable annuity contracts.
Pension and other postretirement remeasurement gains and losses
Pension and other postretirement gains and losses represent the remeasurement of projected benefit obligation and plan assets, which are immediately recognized in earnings and are referred to as pension and other postretirement remeasurement gains and losses on the Consolidated Statements of Operations. The Company’s policy is to remeasure its pension and postretirement plans on a quarterly basis.
Differences between expected and actual returns and changes in assumptions affect our pension and other postretirement obligations, plan assets and expenses.
The primary factors contributing to pension and postretirement remeasurement gains and losses are:
| | |
• Changes in the discount rate used to value pension and postretirement obligations as of the measurement date |
• Differences between the expected and the actual return on plan assets |
• Changes in demographic assumptions, including mortality and participant experience |
Pension and other postretirement service cost, interest cost, expected return on plan assets and amortization of prior service credits are allocated to the Company’s reportable segments. The pension and other postretirement remeasurement gains and losses are reported in the Corporate and Other segment.
Separate accounts
Separate accounts assets are carried at fair value. The assets of the separate accounts are legally segregated and available only to settle separate accounts contract obligations. Separate accounts liabilities represent the contractholders’ claims to the related assets and are carried at an amount equal to the separate accounts assets. Investment income and realized capital gains and losses of the separate accounts accrue directly to the contractholders and therefore are not included in the Company’s Consolidated Statements of Operations. Deposits to and surrenders and withdrawals from the separate accounts are reflected in separate accounts liabilities and are not included in consolidated cash flows.
Absent any contract provision wherein the Company provides a guarantee, variable annuity and variable life insurance contractholders bear the investment risk that the separate accounts’ funds may not meet their stated investment objectives. Substantially all of the Company’s variable annuity business was reinsured beginning in 2006.
Legal contingencies
The Company reviews its lawsuits, regulatory inquiries, and other legal proceedings on an ongoing basis. The Company establishes accruals for such
Notes to Consolidated Financial Statements 2020 Form 10-K
matters at management’s best estimate when the Company assesses that it is probable that a loss has been incurred and the amount of the loss can be reasonably estimated. The Company’s assessment of whether a loss is reasonably possible or probable is based on its assessment of the ultimate outcome of the matter following all appeals. The Company does not include potential recoveries in its estimates of reasonably possible or probable losses. Legal fees are expensed as incurred.
Long-term debt
Long-term debt includes senior notes, senior debentures, subordinated debentures and junior subordinated debentures issued by the Corporation. Unamortized debt issuance costs are reported in long-term debt and are amortized over the expected period the debt will remain outstanding.
Equity incentive plans
The Company has equity incentive plans under which it grants nonqualified stock options, restricted stock units and performance stock awards (“equity awards”) to certain employees and directors of the Company. The Company measures the fair value of equity awards at the grant date and recognizes the expense over the shorter of the period in which the requisite service is rendered or retirement eligibility is attained. The expense for performance stock awards with no market condition is adjusted each period to reflect the performance factor most likely to be achieved at the end of the performance period. The
expense for performance stock awards with a market condition is based on the fair value of the awards at the grant date which incorporates the probability of achieving the market condition. In the event the market condition is not met, any previously recognized expense is not reversed. The Company uses a binomial lattice model to determine the fair value of employee stock options. The Company uses a Monte Carlo simulation model to determine the fair value of performance stock awards with market condition.
Measurement of credit losses
The Company carries an allowance for expected credit losses for all financial assets measured at amortized cost on the Consolidated Statements of Financial Position. The Company considers past events, current conditions, and reasonable and supportable forecasts in estimating an allowance for credit losses. The Company also carries a credit loss allowance for fixed income securities where applicable and, when amortized cost is reported, it is net of credit loss allowances. For additional information, refer to the Investments, Reinsurance, Indemnification or Recognition of premium revenues and contract charges, topics of this section.
The Company also estimates a credit loss allowance for commitments to fund mortgage loans, bank loans and agent loans unless they are unconditionally cancellable by the Company. The related allowance is reported in other liabilities and accrued expenses.
| | | | | | | | | | | | | | |
| Allowance for credit losses |
| ($ in millions) | | December 31, 2020 | | January 1, 2020 |
| Fixed income securities | | $ | 3 | | | $ | — | |
| Mortgage loans | | 67 | | | 45 | |
| Other investments | | | | |
| Bank loans | | 67 | | | 53 | |
| Agent loans | | 5 | | | 5 | |
| Investments | | 142 | | | 103 | |
| Premium installment receivables | | 153 | | | 91 | |
| Reinsurance recoverables | | 74 | | | 74 | |
| Other assets | | 23 | | | 18 | |
| Assets | | 392 | | | 286 | |
| | | | |
| Commitments to fund mortgage loans, bank loans and agent loans | | 1 | | | 3 | |
| Liabilities | | 1 | | | 3 | |
| Total | | $ | 393 | | | $ | 289 | |
Leases
The Company has certain operating leases for office facilities, computer and office equipment, and vehicles. The Company’s leases have remaining lease terms of 1 year to 9 years, some of which include options to extend the leases for up to 20 years, and some of which include options to terminate the leases within 60 days.
The Company determines if an arrangement is a lease at inception. Leases with an initial term less than one year are not recorded on the balance sheet and the lease costs for these leases are recorded as an expense on a straight-line basis over the lease term.
Operating leases with terms greater than one year result in a lease liability recorded in other liabilities with a corresponding right-of-use (“ROU”) asset recorded in other assets. As of December 31, 2020 and 2019, the Company had $511 million and $586 million in lease liabilities and $393 million and $483 million in ROU assets, respectively.
Operating lease liabilities are recognized at the commencement date based on the present value of future minimum lease payments over the lease term. ROU assets are recognized based on the corresponding lease liabilities adjusted for qualifying initial direct costs, prepaid or accrued lease payments and unamortized lease incentives. As most of the
The Allstate Corporation 137
2020 Form 10-K Notes to Consolidated Financial Statements
Company’s leases do not disclose the implicit interest rate, the Company uses collateralized incremental borrowing rates based on information available at lease commencement when determining the present value of future lease payments. The Company has lease agreements with lease and non-lease components, which are accounted for as a single lease. Lease terms may include options to extend or terminate the lease which are incorporated into the Company’s measurements when it is reasonably certain that the Company will exercise the option.
Operating lease costs are recognized on a straight-line basis over the lease term and include interest expense on the lease liability and amortization of the ROU asset. Variable lease costs are expensed as incurred and include maintenance costs and real estate taxes. Lease costs are reported in operating costs and expenses and totaled $166 million and $171 million, including $30 million of variable lease costs in both 2020 and 2019.
| | | | | | | | | | | | | | | | |
| Other information related to operating leases | | |
| | As of December 31, | | |
| | 2020 | | 2019 | | |
| Weighted average remaining lease term (years) | | 5 | | 6 | | |
| Weighted average discount rate | | 3.10 | % | | 3.15 | % | | |
| | | | | | | | |
| Maturity of lease liabilities |
| ($ in millions) | | Operating leases |
| 2021 | | $ | 120 | |
| 2022 | | 116 | |
| 2023 | | 95 | |
| 2024 | | 77 | |
| 2025 | | 63 | |
| Thereafter | | 84 | |
| Total lease payments | | $ | 555 | |
| Less: interest | | (44) | |
| Present value of lease liabilities | | $ | 511 | |
Off-balance sheet financial instruments
Commitments to invest, commitments to purchase private placement securities, commitments to fund loans, financial guarantees and credit guarantees have off-balance sheet risk because their contractual amounts are not recorded in the Company’s Consolidated Statements of Financial Position (see Notes 7 and 14).
Consolidation of variable interest entities (“VIEs”)
The Company consolidates VIEs when it is the primary beneficiary. A primary beneficiary is the variable interest holder in a VIE with both the power to direct the activities of the VIE that most significantly impact the economic performance of the VIE and the obligation to absorb losses, or the right to receive benefits, that could potentially be significant to the VIE.
Foreign currency translation
The local currency of the Company’s foreign subsidiaries is deemed to be the functional currency of the country in which these subsidiaries operate. The financial statements of the Company’s foreign subsidiaries are translated into U.S. dollars at the exchange rate in effect at the end of a reporting period for assets and liabilities and at average exchange rates during the period for results of operations.
The unrealized gains and losses from the translation of the net assets are recorded as unrealized foreign currency translation adjustments and included in AOCI. Changes in unrealized foreign currency translation adjustments are included in OCI. Gains and losses from foreign currency transactions are reported in operating costs and expenses and have not been material.
Earnings per common share
Basic earnings per common share is computed using the weighted average number of common shares outstanding, including vested unissued participating restricted stock units. Diluted earnings per common share is computed using the weighted average number of common and dilutive potential common shares outstanding.
For the Company, dilutive potential common shares consist of outstanding stock options and unvested non-participating restricted stock units and contingently issuable performance stock awards. The effect of dilutive potential common shares does not include options with an anti-dilutive effect on earnings per common share because their exercise prices exceed the average market price of Allstate common shares during the period or for which the unrecognized compensation cost would have an anti-dilutive effect.
Notes to Consolidated Financial Statements 2020 Form 10-K
| | | | | | | | | | | | | | | | | | | | |
Computation of basic and diluted earnings per common share |
| | For the years ended December 31, |
| ($ in millions, except per share data) | | 2020 | | 2019 | | 2018 |
Numerator: | | | | | | |
Net income | | $ | 5,576 | | | $ | 4,847 | | | $ | 2,160 | |
Less: Preferred stock dividends | | 115 | | | 169 | | | 148 | |
Net income applicable to common shareholders (1) | | $ | 5,461 | | | $ | 4,678 | | | $ | 2,012 | |
| | | | | | |
Denominator: | | | | | | |
Weighted average common shares outstanding | | 311.6 | | | 328.2 | | | 347.8 | |
Effect of dilutive potential common shares: | | | | | | |
Stock options | | 2.2 | | | 3.2 | | | 3.6 | |
Restricted stock units (non-participating) and performance stock awards | | 1.7 | | | 2.1 | | | 1.8 | |
Weighted average common and dilutive potential common shares outstanding | | 315.5 | | | 333.5 | | | 353.2 | |
| | | | | | |
Earnings per common share – Basic | | $ | 17.53 | | | $ | 14.25 | | | $ | 5.78 | |
Earnings per common share – Diluted | | $ | 17.31 | | | $ | 14.03 | | | $ | 5.70 | |
| | | | | | |
| Anti-dilutive options excluded from diluted earnings per common share | | 2.9 | | | 3.7 | | | 2.0 | |
The Allstate Corporation 139
2020 Form 10-K Notes to Consolidated Financial Statements
Adopted accounting standard
Measurement of Credit Losses on Financial Instruments Effective January 1, 2020, the Company adopted new Financial Accounting Standards Board (“FASB”) guidance related to the measurement of credit losses on financial instruments that primarily affected mortgage loans, bank loans and reinsurance recoverables.
Upon adoption of the guidance, the Company recorded a total allowance for expected credit losses of $289 million, pre-tax. After consideration of existing valuation allowances maintained prior to adopting the new guidance, the Company increased its valuation allowances for credit losses to conform to the new requirements which resulted in recognizing a cumulative effect decrease in retained income of $88 million, after-tax, at the date of adoption.
The measurement of credit losses for AFS fixed income securities measured at fair value is not affected except that credit losses recognized are limited to the amount by which fair value is below amortized cost and the credit loss adjustment is recognized through a valuation allowance which may change over time but once recorded cannot subsequently be reduced to an amount below zero. Previously these credit loss adjustments were recorded as other-than-temporary impairments and were not reversed once recorded.
Pending accounting standards
Changes to the Disclosure Requirements for Defined Benefit Plans In August 2018, the FASB issued amendments to modify certain disclosure requirements for defined benefit plans. New disclosures include the weighted-average interest crediting rates for cash balance plans and other plans with interest crediting rates and explanations for significant gains and losses related to changes in the benefit obligation during the reporting period. Disclosures to be eliminated include amounts expected to be reclassified out of AOCI and into the income statement in the coming year and the anticipated impact of a one-percentage point change in the assumed health care cost trend rate on service and interest cost and on the accumulated benefit obligation. The amendments are effective for annual reporting periods beginning after December 15, 2020. The impacts of adoption are to the Company’s disclosures only.
Accounting for Long-Duration Insurance Contracts In August 2018, the FASB issued guidance revising the accounting for certain long-duration insurance contracts. The new guidance introduces material changes to the measurement of the Company’s reserves for traditional life, life-contingent immediate annuities and certain voluntary accident and health insurance products.
Under the new guidance, measurement assumptions, including those for mortality, morbidity and policy terminations, will be required to be reviewed and updated at least annually. The effect of updating measurement assumptions other than the discount rate are required to be measured on a retrospective
basis and reported in net income. In addition, reserves under the new guidance are required to be discounted using an upper-medium grade fixed income instrument yield that is updated through OCI at each reporting date. Current GAAP requires the measurement of reserves to utilize assumptions set at policy issuance unless updated current assumptions indicate that recorded reserves are deficient.
The new guidance also requires DAC and other capitalized balances currently amortized in proportion to premiums or gross profits to be amortized on a constant level basis over the expected term for all long-duration insurance contracts. DAC will not be subject to loss recognition testing but will be reduced when actual lapse experience exceeds expected experience. The new guidance will no longer require adjustments to DAC and deferred sales inducement costs (“DSI”) related to unrealized gains and losses on investment securities supporting the related business.
All market risk benefit product features will be measured at fair value with changes in fair value recorded in net income with the exception of changes in the fair value attributable to changes in the reporting entity’s own credit risk, which are required to be recognized in OCI. Substantially all of the Company’s market risk benefits relate to variable annuities that are reinsured and therefore these impacts are not expected to be material to the Company.
The new guidance is effective for financial statements issued for reporting periods beginning after December 15, 2022 and restatement of prior periods presented is required. Early adoption is permitted and if elected, restatement of only one prior period is required. The new guidance will be applied to affected contracts and DAC on the basis of existing carrying amounts at the earliest period presented or retrospectively using actual historical experience as of contract inception. The new guidance for market risk benefits is required to be adopted retrospectively.
The Company is evaluating the anticipated impacts of applying the new guidance to both retained income and AOCI.
As disclosed in Note 3, the Company entered into an agreement to sell ALIC and certain affiliates.
The requirements of the new guidance represent a material change from existing GAAP, however, the underlying economics of the business and related cash flows are unchanged. The Company anticipates the financial statement impact of adopting the new guidance to be material with respect to Allstate Life Insurance Company of New York’s (“ALNY”) run-off annuity business, largely attributed to the impact of transitioning to a discount rate based on an upper-medium grade fixed income investment yield.
The revised accounting for DAC will be applied prospectively using the new model and any DAC effects existing in AOCI as a result of applying existing GAAP at the date of adoption will be eliminated.
Notes to Consolidated Financial Statements 2020 Form 10-K
Simplifications to the Accounting for Income Taxes In December 2019, the FASB issued amendments to simplify the accounting for income taxes. The amendments eliminate certain exceptions in the existing guidance including those related to intraperiod tax allocation and deferred tax liability recognition when a subsidiary meets the criteria to apply the equity method of accounting. The amendments require recognition of the effect of an enacted change in tax laws or rates in the interim period that includes the enactment date, provide an option to not allocate taxes to a legal entity that is not
subject to tax as well as other minor changes. The amendments are effective for interim and annual reporting periods beginning after December 15, 2020. The new guidance specifies which amendments should be applied prospectively, retrospectively or on a modified retrospective basis through a cumulative-effect adjustment to retained income as of the beginning of the year of adoption. The impact of adoption is not expected to be material to the Company’s results of operations or financial position.
The Allstate Corporation 141
2020 Form 10-K Notes to Consolidated Financial Statements
| | | | | |
| Note 3 | Acquisitions and Disposition |
National General On July 7, 2020, the Company entered into a definitive agreement to acquire National General Holdings Corp. (“National General”), an insurance holding company serving customers through independent agents for property and casualty and accident and health products, for approximately $4 billion in cash.
National General provides personal and commercial automobile, homeowners, umbrella, recreational vehicle, motorcycle, lender-placed property, supplemental health and other niche insurance products. This acquisition will increase the Company’s market share in personal property-liability and expand its independent agent distribution.
On September 30, 2020, National General's shareholders voted to approve the definitive agreement.
On November 19, 2020, the Company issued $600 million of 0.750% Senior Notes due 2025 and $600 million of 1.450% Senior Notes due 2030 to partially fund the acquisition.
The transaction closed on January 4, 2021 and National General shareholders received $32.00 per share in cash from the Company, plus a closing dividend of $2.50 per share, providing $34.50 in total value per share.
Due to the limited time since the closing date, the initial accounting for the acquisition is incomplete. As a result, the Company is unable to provide amounts recognized as of the closing date for the major classes of assets acquired and liabilities assumed. The Company will include this information in its Quarterly Report on Form 10-Q for the quarterly period ended March 31, 2021.
iCracked On February 12, 2019, the Company acquired iCracked Inc. (“iCracked”) which offers on-site, on-demand repair services for smartphones and tablets in North America, supporting Allstate Protection Plans' (formerly known as SquareTrade) operations. In conjunction with the iCracked acquisition, the Company recorded goodwill of $17 million.
Subsequent event On January 26, 2021, the Company entered into a Stock Purchase Agreement (the “Purchase Agreement”) with Antelope US Holdings Company, an affiliate of an investment fund associated with The Blackstone Group Inc. to sell ALIC and certain affiliates for approximately $2.8 billion in cash. Allstate will retain ownership of ALNY while pursuing alternatives to sell or otherwise transfer risk to a third party. A loss on disposition estimated at $3 billion, after-tax, will be recorded in the first quarter of 2021. The loss on disposition is related to the run-off annuity segment, whose returns have been low. The ultimate amount of the loss on sale will be impacted by purchase price adjustments associated with certain pre-close transactions specified in the stock purchase agreement, changes in statutory capital and surplus prior to the closing date and the closing date equity of ALIC determined under GAAP, excluding unrealized gains and losses. The transaction is expected to close in the second half of 2021, subject to regulatory approvals and other customary closing conditions.
In the first quarter of 2021, the assets and liabilities of the business will be reclassified as held-for-sale and results will be presented as discontinued operations. This change will be applied on a retrospective basis.
| | | | | |
| Note 4 | Reportable Segments |
The Company’s chief operating decision maker reviews financial performance and makes decisions about the allocation of resources for the seven reportable segments. These segments are described below and align with the Company’s key product and service offerings.
Allstate Protection principally offers private passenger auto and homeowners insurance in the United States and Canada, with earned premiums accounting for 79.4% of Allstate’s 2020 consolidated revenues. Allstate Protection primarily operates in the U.S. (all 50 states and the District of Columbia (“D.C.”)) and Canada. For 2020, the top U.S. geographic locations for premiums earned by the Allstate Protection segment were Texas, California, New York and Florida. No other jurisdiction accounted for more than 5% of premium earned for Allstate Protection. Revenues from external customers generated outside the United States were $1.57 billion, $1.37 billion and $1.20 billion in 2020, 2019 and 2018, respectively.
Discontinued Lines and Coverages includes property and casualty insurance coverage that
primarily relates to policies written during the 1960s through the mid-1980s. Our exposure to asbestos, environmental and other discontinued lines claims arises principally from direct excess commercial insurance, assumed reinsurance coverage, direct primary commercial insurance and other businesses in run-off.
Protection Services comprise Allstate Protection Plans, Allstate Dealer Services, Allstate Roadside, Arity and Allstate Identity Protection. Protection Services offer consumer product protection plans, finance and insurance products (including vehicle service contracts, guaranteed asset protection waivers, road hazard tire and wheel and paintless dent repair protection), roadside assistance, device and mobile data collection services and analytic solutions using automotive telematics information and identity protection. Protection Services primarily operate in the U.S. and Canada, with Allstate Protection Plans also offering services in Europe and Japan. Revenues from external customers generated outside the United States relate to consumer product protection plans sold primarily in
Notes to Consolidated Financial Statements 2020 Form 10-K
the European Union and were $188 million, $95 million and $61 million in 2020, 2019 and 2018, respectively.
Allstate Life consists of traditional, interest-sensitive and variable life insurance products. Allstate Life primarily operates in the U.S. (all 50 states and D.C.). For 2020, the top geographic locations for statutory direct life insurance premiums were New York, California, Texas, Florida and Illinois. No other jurisdiction accounted for more than 5% of statutory direct life insurance premiums.
Allstate Benefits offers voluntary benefits products, including life, accident, critical illness, hospital, short-term disability and other health products. Allstate Benefits primarily operates in the U.S. (all 50 states and D.C.) and Canada. For 2020, the top geographic locations for statutory direct accident and health insurance premiums were Florida, Texas, North Carolina, and California. No other jurisdiction accounted for more than 5% of statutory direct accident and health insurance premiums. Revenues from external customers generated outside the United States relate to voluntary accident and health insurance sold in Canada and were not material.
Allstate Annuities consists primarily of deferred fixed annuities and immediate annuities (including standard and sub-standard structured settlements). This segment is in run-off.
Corporate and Other comprises holding company activities and certain non-insurance operations, including expenses associated with strategic initiatives.
Allstate Protection and Discontinued Lines and Coverages segments comprise Property-Liability. The Company does not allocate investment income, realized capital gains and losses, or assets to the Allstate Protection and Discontinued Lines and Coverages segments. Management reviews assets at the Property-Liability, Protection Services, Allstate Life, Allstate Benefits, Allstate Annuities, and Corporate and Other levels for decision-making purposes.
The accounting policies of the reportable segments are the same as those described in Note 2. The effects of intersegment transactions are eliminated in the consolidated results. For segment
results, services provided by Protection Services to Allstate Protection are not eliminated as management considers those transactions in assessing the results of the respective segments.
Measuring segment profit or loss
The measure of segment profit or loss used in evaluating performance is underwriting income for the Allstate Protection and Discontinued Lines and Coverages segments and adjusted net income for the Protection Services, Allstate Life, Allstate Benefits, Allstate Annuities, and Corporate and Other segments. A reconciliation of these measures to net income applicable to common shareholders is provided below.
Underwriting income is calculated as premiums earned and other revenue, less claims and claims expenses (“losses”), Shelter-in-Place Payback expense, amortization of DAC, operating costs and expenses, amortization or impairment of purchased intangibles and restructuring and related charges as determined using GAAP.
Adjusted net income is net income applicable to common shareholders, excluding:
| | |
• Realized capital gains and losses, after-tax, except for periodic settlements and accruals on non-hedge derivative instruments, which are reported with realized capital gains and losses but included in adjusted net income |
• Pension and other postretirement remeasurement gains and losses, after-tax |
• Valuation changes on embedded derivatives that are not hedged, after-tax |
• Amortization of DAC and DSI, to the extent they resulted from the recognition of certain realized capital gains and losses or valuation changes on embedded derivatives that are not hedged, after-tax |
• Business combination expenses and the amortization or impairment of purchased intangibles, after-tax |
• Gain (loss) on disposition of operations, after-tax |
• Adjustments for other significant non-recurring, infrequent or unusual items, when (a) the nature of the charge or gain is such that it is reasonably unlikely to recur within two years, or (b) there has been no similar charge or gain within the prior two years |
The Allstate Corporation 143
2020 Form 10-K Notes to Consolidated Financial Statements
| | | | | | | | | | | | | | | | | | | | |
Reportable segments revenue information |
| | For the years ended December 31, |
| ($ in millions) | | 2020 | | 2019 | | 2018 |
| Property-Liability | | | | | | |
| Insurance premiums | | | | | | |
| Auto | | $ | 24,640 | | | $ | 24,188 | | | $ | 22,970 | |
| Homeowners | | 8,254 | | | 7,912 | | | 7,517 | |
| Other personal lines | | 1,919 | | | 1,861 | | | 1,808 | |
| Commercial lines | | 767 | | | 882 | | | 655 | |
| | | | | | |
| Allstate Protection | | 35,580 | | | 34,843 | | | 32,950 | |
| Discontinued Lines and Coverages | | — | | | — | | | — | |
| Total Property-Liability insurance premiums | | 35,580 | | | 34,843 | | | 32,950 | |
| Other revenue | | 736 | | | 741 | | | 738 | |
| Net investment income | | 1,421 | | | 1,533 | | | 1,464 | |
| Realized capital gains (losses) | | 990 | | | 1,470 | | | (639) | |
| Total Property-Liability | | 38,727 | | | 38,587 | | | 34,513 | |
| | | | | | |
Protection Services | | | | | | |
| Consumer product protection plans | | 909 | | | 633 | | | 503 | |
| Roadside assistance | | 188 | | | 238 | | | 263 | |
| Finance and insurance products | | 396 | | | 362 | | | 332 | |
Intersegment premiums and service fees (1) | | 147 | | | 154 | | | 122 | |
Other revenue (2) | | 208 | | | 188 | | | 82 | |
| Net investment income | | 44 | | | 42 | | | 27 | |
| Realized capital gains (losses) | | 30 | | | 32 | | | (11) | |
Total Protection Services | | 1,922 | | | 1,649 | | | 1,318 | |
| | | | | | |
| Allstate Life | | | | | | |
| Traditional life insurance premiums | | 633 | | | 630 | | | 600 | |
| Accident and health insurance premiums | | 2 | | | 2 | | | 2 | |
| Interest-sensitive life insurance contract charges | | 705 | | | 711 | | | 713 | |
| Other revenue | | 121 | | | 125 | | | 119 | |
| Net investment income | | 502 | | | 514 | | | 505 | |
| Realized capital gains (losses) | | (10) | | | 1 | | | (14) | |
| Total Allstate Life | | 1,953 | | | 1,983 | | | 1,925 | |
| | | | | | |
| Allstate Benefits | | | | | | |
| Traditional life insurance premiums | | 46 | | | 43 | | | 44 | |
| Accident and health insurance premiums | | 926 | | | 988 | | | 980 | |
| Interest-sensitive life insurance contract charges | | 122 | | | 114 | | | 111 | |
| Net investment income | | 78 | | | 83 | | | 77 | |
| Realized capital gains (losses) | | 8 | | | 12 | | | (9) | |
| Total Allstate Benefits | | 1,180 | | | 1,240 | | | 1,203 | |
| | | | | | |
| Allstate Annuities | | | | | | |
| Fixed annuities contract charges | | 10 | | | 13 | | | 15 | |
| Net investment income | | 761 | | | 917 | | | 1,096 | |
| Realized capital gains (losses) | | 279 | | | 346 | | | (166) | |
| Total Allstate Annuities | | 1,050 | | | 1,276 | | | 945 | |
| | | | | | |
| Corporate and Other | | | | | | |
| | | | | | |
| Net investment income | | 47 | | | 70 | | | 71 | |
| Realized capital gains (losses) | | 59 | | | 24 | | | (38) | |
| | | | | | |
| | | | | | |
| | | | | | |
| Total Corporate and Other | | 106 | | | 94 | | | 33 | |
Intersegment eliminations (1) | | (147) | | | (154) | | | (122) | |
| Consolidated revenues | | $ | 44,791 | | | $ | 44,675 | | | $ | 39,815 | |
(1)Intersegment insurance premiums and service fees are primarily related to Arity and Allstate Roadside and are eliminated in the consolidated financial statements.
(2)Other revenue is primarily related to Allstate Identity Protection, Allstate Dealer Services, and Allstate Protection Plans.
Notes to Consolidated Financial Statements 2020 Form 10-K
| | | | | | | | | | | | | | | | | | | | |
Reportable segments financial performance |
| | For the years ended December 31, |
| ($ in millions) | | 2020 | | 2019 | | 2018 |
| Property-Liability | | | | | | |
| Allstate Protection | | $ | 4,566 | | | $ | 2,912 | | | $ | 2,343 | |
| Discontinued Lines and Coverages | | (144) | | | (108) | | | (90) | |
| Total underwriting income | | 4,422 | | | 2,804 | | | 2,253 | |
| Net investment income | | 1,421 | | | 1,533 | | | 1,464 | |
| Income tax expense on operations | | (1,166) | | | (887) | | | (747) | |
| Realized capital gains (losses), after-tax | | 774 | | | 1,161 | | | (500) | |
| | | | | | |
| Tax Legislation expense | | — | | | — | | | (5) | |
| Property-Liability net income applicable to common shareholders | | 5,451 | | | 4,611 | | | 2,465 | |
| | | | | | |
Protection Services | | | | | | |
| Adjusted net income | | 153 | | | 38 | | | 8 | |
| Realized capital gains (losses), after-tax | | 23 | | | 25 | | | (9) | |
| Amortization of purchased intangibles, after-tax | | (84) | | | (97) | | | (74) | |
| Impairment of purchased intangibles, after-tax | | — | | | (43) | | | — | |
| Tax Legislation expense | | — | | | — | | | (4) | |
| Protection Services net income (loss) applicable to common shareholders | | 92 | | | (77) | | | (79) | |
| | | | | | |
| Allstate Life | | | | | | |
| Adjusted net income | | 194 | | | 261 | | | 295 | |
| Realized capital gains (losses), after-tax | | (9) | | | — | | | (11) | |
| Valuation changes on embedded derivatives that are not hedged, after-tax | | (34) | | | (9) | | | — | |
| DAC and DSI amortization related to realized capital gains and losses and valuation changes on embedded derivatives that are not hedged, after-tax | | 8 | | | (5) | | | (8) | |
| | | | | | |
| | | | | | |
| Tax Legislation expense | | — | | | — | | | (16) | |
| Allstate Life net income applicable to common shareholders | | 159 | | | 247 | | | 260 | |
| | | | | | |
| Allstate Benefits | | | | | | |
| Adjusted net income | | 96 | | | 115 | | | 124 | |
| Realized capital gains (losses), after-tax | | 7 | | | 9 | | | (7) | |
| DAC and DSI amortization related to realized capital gains and losses, after-tax | | — | | | — | | | 1 | |
| | | | | | |
| Tax Legislation benefit | | — | | | — | | | — | |
| Allstate Benefits net income applicable to common shareholders | | 103 | | | 124 | | | 118 | |
| | | | | | |
| Allstate Annuities | | | | | | |
| Adjusted net (loss) income | | (53) | | | 10 | | | 131 | |
| Realized capital gains (losses), after-tax | | 221 | | | 274 | | | (131) | |
| Valuation changes on embedded derivatives that are not hedged, after-tax | | (2) | | | (6) | | | 3 | |
| | | | | | |
Premium deficiency for immediate annuities, after-tax (1) | | (178) | | | — | | | — | |
| Gain on disposition of operations, after-tax | | 3 | | | 4 | | | 4 | |
| | | | | | |
| Tax Legislation benefit | | — | | | — | | | 69 | |
| Allstate Annuities net (loss) income applicable to common shareholders | | (9) | | | 282 | | | 76 | |
| | | | | | |
| Corporate and Other | | | | | | |
| Adjusted net loss | | (428) | | | (438) | | | (406) | |
| Realized capital gains (losses), after-tax | | 47 | | | 19 | | | (30) | |
| Pension and other postretirement remeasurement gains (losses), after-tax | | 39 | | | (90) | | | (370) | |
| | | | | | |
| Curtailment gain, after-tax | | 7 | | | — | | | — | |
| Business combination expenses, after-tax | | — | | | — | | | (7) | |
| Tax Legislation expense | | — | | | — | | | (15) | |
| Corporate and Other net loss applicable to common shareholders | | (335) | | | (509) | | | (828) | |
| | | | | | |
| Consolidated net income applicable to common shareholders | | $ | 5,461 | | | $ | 4,678 | | | $ | 2,012 | |
(1) Contract benefits increased by $225 million, pre-tax, for premium deficiency on immediate annuities with life contingencies due to updated investment and actuarial assumptions in the third quarter of 2020.
The Allstate Corporation 145
2020 Form 10-K Notes to Consolidated Financial Statements
| | | | | | | | | | | | | | | | | | | | |
| Additional significant financial performance data | | | | | | |
| | For the years ended December 31, |
| ($ in millions) | | 2020 | | 2019 | | 2018 |
| Amortization of DAC | | | | | | |
| Property-Liability | | $ | 4,642 | | | $ | 4,649 | | | $ | 4,475 | |
Protection Services | | 658 | | | 543 | | | 463 | |
| Allstate Life | | 149 | | | 173 | | | 132 | |
| Allstate Benefits | | 177 | | | 161 | | | 145 | |
| Allstate Annuities | | 4 | | | 7 | | | 7 | |
| Consolidated | | $ | 5,630 | | | $ | 5,533 | | | $ | 5,222 | |
| | | | | | |
| | | | | | |
| Income tax expense (benefit) | | | | | | |
| Property-Liability | | $ | 1,382 | | | $ | 1,196 | | | $ | 613 | |
Protection Services | | 26 | | | (18) | | | (19) | |
| Allstate Life | | 17 | | | 53 | | | 75 | |
| Allstate Benefits | | 28 | | | 35 | | | 32 | |
| Allstate Annuities | | (7) | | | 73 | | | (66) | |
| Corporate and Other | | (63) | | | (97) | | | (167) | |
| Consolidated | | $ | 1,383 | | | $ | 1,242 | | | $ | 468 | |
Interest expense is primarily incurred in the Corporate and Other segment. Capital expenditures for long-lived assets are generally made in Property-Liability as the Company does not allocate assets to the Allstate Protection and Discontinued Lines and Coverages segments. A portion of these long-lived assets are used by entities included in the Protection Services, Allstate Life, Allstate Benefits, Allstate Annuities and Corporate and Other segments and, accordingly, are charged to expenses in proportion to their use.
| | | | | | | | | | | | | | | | | | |
Reportable segment total assets, investments and deferred policy acquisition costs (1) | | | | |
| | As of December 31, | | | | |
| ($ in millions) | | 2020 | | 2019 | | | | |
| Assets | | | | | | | | |
| Property-Liability | | $ | 69,171 | | | $ | 67,243 | | | | | |
Protection Services | | 6,177 | | | 5,746 | | | | | |
| Allstate Life | | 15,051 | | | 14,771 | | | | | |
| Allstate Benefits | | 2,905 | | | 2,915 | | | | | |
| Allstate Annuities | | 27,080 | | | 26,914 | | | | | |
| Corporate and Other | | 5,603 | | | 2,361 | | | | | |
| Consolidated | | $ | 125,987 | | | $ | 119,950 | | | | | |
| | | | | | | | |
| | | | | | | | |
| Investments | | | | | | | | |
| Property-Liability | | $ | 50,134 | | | $ | 48,414 | | | | | |
Protection Services | | 1,822 | | | 1,544 | | | | | |
| Allstate Life | | 12,406 | | | 11,914 | | | | | |
| Allstate Benefits | | 2,012 | | | 1,941 | | | | | |
| Allstate Annuities | | 22,291 | | | 22,221 | | | | | |
| Corporate and Other | | 5,572 | | | 2,328 | | | | | |
| Consolidated | | $ | 94,237 | | | $ | 88,362 | | | | | |
| | | | | | | | |
| Deferred policy acquisition costs | | | | | | | | |
| Property-Liability | | $ | 1,608 | | | $ | 1,624 | | | | | |
Protection Services | | 1,696 | | | 1,448 | | | | | |
| Allstate Life | | 909 | | | 1,079 | | | | | |
| Allstate Benefits | | 470 | | | 527 | | | | | |
| Allstate Annuities | | 17 | | | 21 | | | | | |
| Consolidated | | $ | 4,700 | | | $ | 4,699 | | | | | |
(1)The balances reflect the elimination of related party investments between segments.
Notes to Consolidated Financial Statements 2020 Form 10-K
| | | | | | | | | | | | | | |
Portfolio composition |
| | As of December 31, |
| ($ in millions) | | 2020 | | 2019 |
| Fixed income securities, at fair value | | $ | 66,354 | | | $ | 59,044 | |
| Equity securities, at fair value | | 4,710 | | | 8,162 | |
| Mortgage loans, net | | 4,075 | | | 4,817 | |
| Limited partnership interests | | 7,609 | | | 8,078 | |
| Short-term investments, at fair value | | 7,800 | | | 4,256 | |
| Other, net | | 3,689 | | | 4,005 | |
| Total | | $ | 94,237 | | | $ | 88,362 | |
| | | | | | | | | | | | | | | | | | | | | | | | | | |
Amortized cost, gross unrealized gains (losses) and fair value for fixed income securities |
| | Amortized
cost, net | | Gross unrealized | | Fair value |
| ($ in millions) | | | Gains | | Losses | |
| December 31, 2020 | | | | | | | | |
| U.S. government and agencies | | $ | 3,129 | | | $ | 94 | | | $ | (1) | | | $ | 3,222 | |
| Municipal | | 8,752 | | | 837 | | | (2) | | | 9,587 | |
| Corporate | | 47,226 | | | 3,981 | | | (65) | | | 51,142 | |
| Foreign government | | 1,013 | | | 42 | | | — | | | 1,055 | |
| ABS | | 1,260 | | | 15 | | | (5) | | | 1,270 | |
| MBS | | 71 | | | 7 | | | — | | | 78 | |
| Total fixed income securities | | $ | 61,451 | | | $ | 4,976 | | | $ | (73) | | | $ | 66,354 | |
| | | | | | | | |
| December 31, 2019 | | | | | | | | |
| U.S. government and agencies | | $ | 4,971 | | | $ | 141 | | | $ | (26) | | | $ | 5,086 | |
| Municipal | | 8,080 | | | 551 | | | (11) | | | 8,620 | |
| Corporate | | 41,090 | | | 2,035 | | | (47) | | | 43,078 | |
| Foreign government | | 968 | | | 16 | | | (5) | | | 979 | |
| ABS | | 860 | | | 8 | | | (6) | | | 862 | |
| MBS | | 324 | | | 96 | | | (1) | | | 419 | |
| Total fixed income securities | | $ | 56,293 | | | $ | 2,847 | | | $ | (96) | | | $ | 59,044 | |
| | | | | | | | | | | | | | |
Scheduled maturities for fixed income securities |
| | As of December 31, 2020 |
| ($ in millions) | | Amortized
cost, net | | Fair value |
| Due in one year or less | | $ | 3,092 | | | $ | 3,136 | |
| Due after one year through five years | | 24,271 | | | 25,587 | |
| Due after five years through ten years | | 22,000 | | | 24,018 | |
| Due after ten years | | 10,757 | | | 12,265 | |
| | 60,120 | | | 65,006 | |
| ABS and MBS | | 1,331 | | | 1,348 | |
| Total | | $ | 61,451 | | | $ | 66,354 | |
Actual maturities may differ from those scheduled as a result of calls and make-whole payments by the issuers. ABS and MBS are shown separately because of potential prepayment of principal prior to contractual maturity dates.
| | | | | | | | | | | | | | | | | | | | |
Net investment income |
| | For the years ended December 31, |
| ($ in millions) | | 2020 | | 2019 | | 2018 |
| Fixed income securities | | $ | 2,136 | | | $ | 2,175 | | | $ | 2,077 | |
| Equity securities | | 98 | | | 206 | | | 170 | |
| Mortgage loans | | 220 | | | 220 | | | 217 | |
| Limited partnership interests | | 338 | | | 471 | | | 705 | |
| Short-term investments | | 23 | | | 102 | | | 73 | |
| Other | | 251 | | | 262 | | | 272 | |
| Investment income, before expense | | 3,066 | | | 3,436 | | | 3,514 | |
| Investment expense | | (213) | | | (277) | | | (274) | |
| Net investment income | | $ | 2,853 | | | $ | 3,159 | | | $ | 3,240 | |
The Allstate Corporation 147
2020 Form 10-K Notes to Consolidated Financial Statements
| | | | | | | | | | | | | | | | | | | | |
Realized capital gains (losses) by asset type |
| | For the years ended December 31, |
| ($ in millions) | | 2020 | | 2019 | | 2018 |
| Fixed income securities | | $ | 983 | | | $ | 461 | | | $ | (237) | |
| Equity securities | | 346 | | | 1,210 | | | (594) | |
| Mortgage loans | | (47) | | | — | | | 2 | |
| Limited partnership interests | | 24 | | | 200 | | | (101) | |
| Derivatives | | 53 | | | (15) | | | 46 | |
| Other | | (3) | | | 29 | | | 7 | |
| Realized capital gains (losses) | | $ | 1,356 | | | $ | 1,885 | | | $ | (877) | |
| | | | | | | | | | | | | | | | | | | | |
Realized capital gains (losses) by transaction type |
| | For the years ended December 31, |
| ($ in millions) | | 2020 | | 2019 | | 2018 |
| Sales | | $ | 1,017 | | | $ | 575 | | | $ | (215) | |
Credit losses (1) | | (80) | | | (47) | | | (14) | |
Valuation of equity investments (2) | | 366 | | | 1,372 | | | (691) | |
| Valuation and settlements of derivative instruments | | 53 | | | (15) | | | 43 | |
| Realized capital gains (losses) | | $ | 1,356 | | | $ | 1,885 | | | $ | (877) | |
(1)Due to the adoption of the measurement of credit losses on financial instruments accounting standard, prior period other-than-temporary impairment write-downs are now presented as credit losses.
(2)Includes valuation of equity securities and certain limited partnership interests where the underlying assets are predominately public equity securities.
| | | | | | | | | | | | | | | | | | | | |
| Gross realized gains (losses) on sales of fixed income securities |
| | For the years ended December 31, |
| ($ in millions) | | 2020 | | 2019 | | 2018 |
| Gross realized gains | | $ | 1,209 | | | $ | 607 | | | $ | 120 | |
| Gross realized losses | | (221) | | | (132) | | | (347) | |
The following table presents the net pre-tax appreciation (decline) recognized in net income of equity securities and limited partnership interests carried at fair value that are still held as of December 31, 2020 and 2019, respectively.
| | | | | | | | | | | | | | |
| Net appreciation (decline) recognized in net income |
| | For the years ended December 31, |
| ($ in millions) | | 2020 | | 2019 |
| Equity securities | | $ | 478 | | | $ | 1,073 | |
| Limited partnership interests carried at fair value | | 250 | | | 149 | |
Total | | $ | 728 | | | $ | 1,222 | |
| | | | | | | | | | | | | | | | | | | | |
Credit losses recognized in net income (1) |
| For the years ended December 31, |
| ($ in millions) | | 2020 | | 2019 | | 2018 |
| Assets | | | | | | |
| Fixed income securities: | | | | | | |
| | | | | | |
| Corporate | | $ | (1) | | | $ | (7) | | | $ | (2) | |
| ABS | | (2) | | | (4) | | | (3) | |
| MBS | | (2) | | | (3) | | | (5) | |
| Total fixed income securities | | (5) | | | (14) | | | (10) | |
| Mortgage loans | | (39) | | | — | | | — | |
| Limited partnership interests | | (10) | | | (6) | | | (3) | |
| Other investments | | | | | | |
| Bank loans | | (28) | | | (26) | | | — | |
| Agent loans | | — | | | (1) | | | (1) | |
| Total credit losses by asset type | | $ | (82) | | | $ | (47) | | | $ | (14) | |
| | | | | | |
| Liabilities | | | | | | |
| Commitments to fund commercial mortgage loans, bank loans and agent loans | | 2 | | | — | | | — | |
| Total | | $ | (80) | | | $ | (47) | | | $ | (14) | |
(1)Due to the adoption of the measurement of credit losses on financial instruments accounting standard, realized capital losses previously reported as other-than-temporary impairment write-downs are now presented as credit losses.
Notes to Consolidated Financial Statements 2020 Form 10-K
| | | | | | | | | | | | | | | | | | | | | | | | | | |
Unrealized net capital gains and losses included in AOCI |
| ($ in millions) | | Fair value | | Gross unrealized | | Unrealized net gains (losses) |
| December 31, 2020 | | | Gains | | Losses | |
| Fixed income securities | | $ | 66,354 | | | $ | 4,976 | | | $ | (73) | | | $ | 4,903 | |
| Short-term investments | | 7,800 | | | — | | | — | | | — | |
| Derivative instruments | | — | | | — | | | (3) | | | (3) | |
EMA limited partnerships (1) | | | | | | | | (4) | |
| Unrealized net capital gains and losses, pre-tax | | | | | | | | 4,896 | |
| Amounts recognized for: | | | | | | | | |
Insurance reserves (2) | | | | | | | | (496) | |
DAC and DSI (3) | | | | | | | | (364) | |
| Amounts recognized | | | | | | | | (860) | |
| Deferred income taxes | | | | | | | | (856) | |
| Unrealized net capital gains and losses, after-tax | | | | | | | | $ | 3,180 | |
| | | | | | | | |
| December 31, 2019 | | | | | | | | |
| Fixed income securities | | $ | 59,044 | | | $ | 2,847 | | | $ | (96) | | | $ | 2,751 | |
| Short-term investments | | 4,256 | | | — | | | — | | | — | |
| Derivative instruments | | — | | | — | | | (3) | | | (3) | |
| EMA limited partnerships | | | | | | | | (4) | |
| | | | | | | | |
| Unrealized net capital gains and losses, pre-tax | | | | | | | | 2,744 | |
| Amounts recognized for: | | | | | | | | |
| Insurance reserves | | | | | | | | (126) | |
| DAC and DSI | | | | | | | | (224) | |
| Amounts recognized | | | | | | | | (350) | |
| Deferred income taxes | | | | | | | | (507) | |
| Unrealized net capital gains and losses, after-tax | | | | | | | | $ | 1,887 | |
(1)Unrealized net capital gains and losses for limited partnership interests represent the Company’s share of EMA limited partnerships’ OCI. Fair value and gross unrealized gains and losses are not applicable.
(2)The insurance reserves adjustment represents the amount by which the reserve balance would increase if the net unrealized gains in the applicable product portfolios were realized and reinvested at lower interest rates, resulting in a premium deficiency. This adjustment primarily relates to structured settlement annuities with life contingencies (a type of immediate fixed annuity).
(3)The DAC and DSI adjustment balance represents the amount by which the amortization of DAC and DSI would increase or decrease if the unrealized gains or losses in the respective product portfolios were realized.
| | | | | | | | | | | | | | | | | | | | |
Change in unrealized net capital gains (losses) |
| | For the years ended December 31, |
| ($ in millions) | | 2020 | | 2019 | | 2018 |
| Fixed income securities | | $ | 2,152 | | | $ | 2,715 | | | $ | (1,431) | |
| | | | | | |
| Short-term investments | | — | | | — | | | — | |
| Derivative instruments | | — | | | — | | | (2) | |
| EMA limited partnerships | | — | | | (4) | | | (1) | |
| | | | | | |
| Total | | 2,152 | | | 2,711 | | | (1,434) | |
| Amounts recognized for: | | | | | | |
| Insurance reserves | | (370) | | | (126) | | | 315 | |
| DAC and DSI | | (140) | | | (191) | | | 163 | |
| Amounts recognized | | (510) | | | (317) | | | 478 | |
| Deferred income taxes | | (349) | | | (505) | | | 202 | |
| Increase (decrease) in unrealized net capital gains and losses, after-tax | | $ | 1,293 | | | $ | 1,889 | | | $ | (754) | |
The Allstate Corporation 149
2020 Form 10-K Notes to Consolidated Financial Statements
Mortgage loans The Company’s mortgage loans are commercial mortgage loans collateralized by a variety of commercial real estate property types located across the United States and totaled $4.08 billion and $4.82 billion, net of credit loss allowance, as of December 31, 2020 and 2019, respectively. Substantially all of the commercial mortgage loans are non-recourse to the borrower.
| | | | | | | | | | | | | | |
Principal geographic distribution of commercial real estate exceeding 5% of the mortgage loans portfolio |
| | As of December 31, |
| (% of mortgage loan portfolio carrying value) | | 2020 | | 2019 |
| Texas | | 20.6 | % | | 16.9 | % |
| California | | 14.6 | | | 15.1 | |
| Florida | | 6.8 | | | 6.4 | |
| Illinois | | 6.1 | | | 7.1 | |
| North Carolina | | 5.1 | | | 4.5 | |
| New Jersey | | 3.5 | | | 5.6 | |
| | | | |
| | | | | | | | | | | | | | |
Types of properties collateralizing the mortgage loan portfolio |
| | As of December 31, |
| (% of mortgage loan portfolio carrying value) | | 2020 | | 2019 |
| Apartment complex | | 37.8 | % | | 36.8 | % |
| Office buildings | | 23.2 | | | 22.6 | |
| Warehouse | | 14.6 | | | 16.8 | |
| Retail | | 13.9 | | | 13.4 | |
| Other | | 10.5 | | | 10.4 | |
| Total | | 100.0 | % | | 100.0 | % |
| | | | | | | | | | | | | | | | | | | | |
Contractual maturities of the mortgage loan portfolio |
| | As of December 31, 2020 |
| ($ in millions) | | Number of loans | | Amortized cost, net | | Percent |
| 2021 | | 28 | | | $ | 277 | | | 6.8 | % |
| 2022 | | 25 | | | 388 | | | 9.5 | |
| 2023 | | 42 | | | 556 | | | 13.7 | |
| 2024 | | 27 | | | 637 | | | 15.6 | |
| Thereafter | | 124 | | | 2,217 | | | 54.4 | |
| Total | | 246 | | | $ | 4,075 | | | 100.0 | % |
Limited partnerships Investments in limited partnership interests include interests in private equity funds, real estate funds and other funds. Principal factors influencing carrying value appreciation or decline include operating performance, comparable public company earnings multiples, capitalization rates and the economic environment. For equity method limited partnerships, the Company recognizes an impairment loss when evidence demonstrates that the loss is other than temporary. Evidence of a loss in value that is other than temporary may include the absence of an ability to recover the carrying amount of the investment or the inability of the investee to sustain a level of earnings that would justify the carrying amount of the investment. Changes in fair value limited partnerships are recorded through net investment income and therefore are not tested for impairment.
| | | | | | | | | | | | | | | | | | | | | | | | | | | | | | | | | | | | | | |
| Carrying value for limited partnership interests |
| | As of December 31, 2020 | | As of December 31, 2019 |
| ($ in millions) | | EMA | | Fair Value | | Total | | EMA | | Fair Value | | Total |
| Private equity | | $ | 4,417 | | | $ | 1,708 | | | $ | 6,125 | | | $ | 4,463 | | | $ | 1,668 | | | $ | 6,131 | |
| Real estate | | 958 | | | 116 | | | 1,074 | | | 899 | | | 142 | | | 1,041 | |
Other (1) | | 410 | | | — | | | 410 | | | 902 | | | 4 | | | 906 | |
| Total | | $ | 5,785 | | | $ | 1,824 | | | $ | 7,609 | | | $ | 6,264 | | | $ | 1,814 | | | $ | 8,078 | |
(1)Other consists of certain limited partnership interests where the underlying assets are predominately public equity and debt securities.
Notes to Consolidated Financial Statements 2020 Form 10-K
Municipal bonds The Company maintains a diversified portfolio of municipal bonds, including tax exempt and taxable securities, which totaled $9.59 billion and $8.62 billion as of December 31, 2020 and 2019, respectively.
The municipal bond portfolio includes general obligations of state and local issuers and revenue bonds (including pre-refunded bonds, which are bonds for which an irrevocable trust has been established to fund the remaining payments of principal and interest).
| | | | | | | | | | | | | | |
Principal geographic distribution of municipal bond issuers exceeding 5% of the portfolio |
| | As of December 31, |
| (% of municipal bond portfolio carrying value) | | 2020 | | 2019 |
| California | | 12.8 | % | | 8.6 | % |
| Texas | | 11.0 | | | 12.7 | |
| New York | | 5.3 | | | 3.7 | |
| Colorado | | 4.8 | | | 5.8 | |
| Washington | | 4.0 | | | 5.5 | |
| | | | |
Short-term investments Short-term investments, including money market funds, commercial paper, U.S. Treasury bills and other short-term investments, are carried at fair value. As of December 31, 2020 and 2019, the fair value of short-term investments totaled $7.80 billion and $4.26 billion, respectively.
Other investments Other investments primarily consist of bank loans, real estate, policy loans, agent loans and derivatives. Bank loans are primarily senior secured corporate loans and are carried at amortized cost, net. Policy loans are carried at unpaid principal balances. Real estate is carried at cost less accumulated depreciation. Agent loans are loans issued to exclusive Allstate agents and are carried at amortized cost, net. Derivatives are carried at fair value.
| | | | | | | | | | | | | | |
| Other investments by asset type |
| | As of December 31, |
| ($ in millions) | | 2020 | | 2019 |
| Bank loans, net | | $ | 1,018 | | | $ | 1,204 | |
| Real estate | | 974 | | | 1,005 | |
| Policy loans | | 754 | | | 894 | |
| Agent loans, net | | 631 | | | 666 | |
| Derivatives and other | | 312 | | | 236 | |
| Total | | $ | 3,689 | | | $ | 4,005 | |
Concentration of credit risk As of December 31, 2020, the Company is not exposed to any credit concentration risk of a single issuer and its affiliates greater than 10% of the Company’s shareholders’ equity, other than the U.S. government and its agencies and one government money market fund.
Securities loaned The Company’s business activities include securities lending programs with third parties, mostly large banks. As of December 31, 2020 and 2019, fixed income and equity securities with a carrying value of $1.19 billion and $1.74 billion, respectively, were on loan under these agreements. Interest income on collateral, net of fees, was $3 million, $5 million and $4 million in 2020, 2019 and 2018, respectively.
Other investment information Included in fixed income securities are below investment grade assets totaling $9.00 billion and $7.15 billion as of December 31, 2020 and 2019, respectively.
As of December 31, 2020, fixed income securities and short-term investments with a carrying value of $141 million were on deposit with regulatory authorities as required by law.
As of December 31, 2020, the carrying value of fixed income securities and other investments that were non-income producing was $80 million.
The Allstate Corporation 151
2020 Form 10-K Notes to Consolidated Financial Statements
Portfolio monitoring and credit losses
Fixed income securities The Company has a comprehensive portfolio monitoring process to identify and evaluate each fixed income security that may require a credit loss allowance.
For each fixed income security in an unrealized loss position, the Company assesses whether management with the appropriate authority has made the decision to sell or whether it is more likely than not the Company will be required to sell the security before recovery of the amortized cost basis for reasons such as liquidity, contractual or regulatory purposes. If a security meets either of these criteria, any existing credit loss allowance would be written-off against the amortized cost basis of the asset along with any remaining unrealized losses, with incremental losses recorded in earnings.
If the Company has not made the decision to sell the fixed income security and it is not more likely than not the Company will be required to sell the fixed income security before recovery of its amortized cost basis, the Company evaluates whether it expects to receive cash flows sufficient to recover the entire amortized cost basis of the security. The Company calculates the estimated recovery value based on the best estimate of future cash flows considering past events, current conditions and reasonable and supportable forecasts. The estimated future cash flows are discounted at the security’s current effective rate and is compared to the amortized cost of the security.
The determination of cash flow estimates is inherently subjective, and methodologies may vary depending on facts and circumstances specific to the security. All reasonably available information relevant to the collectability of the security is considered when developing the estimate of cash flows expected to be collected. That information generally includes, but is not limited to, the remaining payment terms of the security, prepayment speeds, the financial condition and future earnings potential of the issue or issuer, expected defaults, expected recoveries, the value of underlying collateral, origination vintage year, geographic concentration of underlying collateral, available reserves or escrows, current subordination levels, third-party guarantees and other credit enhancements. Other information, such as industry analyst reports and forecasts, credit ratings, financial condition of the bond insurer for insured fixed income securities, and other market data relevant to the realizability of contractual cash flows, may also be considered. The estimated fair value of collateral will be used to estimate recovery value if the Company determines that the security is dependent on the liquidation of collateral for ultimate settlement.
If the Company does not expect to receive cash flows sufficient to recover the entire amortized cost basis of the fixed income security, a credit loss allowance is recorded in earnings for the shortfall in expected cash flows; however, the amortized cost, net of the credit loss allowance, may not be lower than the fair value of the security. The portion of the unrealized loss related to factors other than credit remains classified in AOCI. If the Company determines that the fixed income security does not have sufficient cash flow or other information to estimate a recovery value for the security, the Company may conclude that the entire decline in fair value is deemed to be credit related and the loss is recorded in earnings.
When a security is sold or otherwise disposed or when the security is deemed uncollectible and written off, the Company removes amounts previously recognized in the credit loss allowance. Recoveries after write-offs are recognized when received. Accrued interest excluded from the amortized cost of fixed income securities totaled $548 million as of December 31, 2020 and is reported within the accrued investment income line of the Consolidated Statements of Financial Position. The Company monitors accrued interest and writes off amounts when they are not expected to be received.
The Company’s portfolio monitoring process includes a quarterly review of all securities to identify instances where the fair value of a security compared to its amortized cost is below internally established thresholds. The process also includes the monitoring of other credit loss indicators such as ratings, ratings downgrades and payment defaults. The securities identified, in addition to other securities for which the Company may have a concern, are evaluated for potential credit losses using all reasonably available information relevant to the collectability or recovery of the security. Inherent in the Company’s evaluation of credit losses for these securities are assumptions and estimates about the financial condition and future earnings potential of the issue or issuer. Some of the factors that may be considered in evaluating whether a decline in fair value requires a credit loss allowance are: 1) the financial condition, near-term and long-term prospects of the issue or issuer, including relevant industry specific market conditions and trends, geographic location and implications of rating agency actions and offering prices; 2) the specific reasons that a security is in an unrealized loss position, including overall market conditions which could affect liquidity; and 3) the extent to which the fair value has been less than amortized cost.
Notes to Consolidated Financial Statements 2020 Form 10-K
| | | | | | | | | | | | |
Rollforward of credit loss allowance for fixed income securities |
| | For the year ended |
| ($ in millions) | | December 31, 2020 | | | | |
| Beginning balance | | $ | — | | | | | |
| Credit losses on securities for which credit losses not previously reported | | (5) | | | | | |
| | | | | | |
| Reduction of allowance related to sales | | 2 | | | | | |
| Write-offs | | — | | | | | |
| | | | | | |
| | | | | | |
| | | | | | |
Ending balance (1) | | $ | (3) | | | | | |
(1)Allowance for fixed income securities as of December 31, 2020 comprised $1 million and $2 million of corporate bonds and ABS, respectively.
| | | | | | | | | | | | | | | | | | | | | | | | | | | | | | | | | | | | | | | | | | | | |
Gross unrealized losses and fair value by type and length of time held in a continuous unrealized loss position |
| | | | | | | | | | | | | | |
| | Less than 12 months | | 12 months or more | | |
| ($ in millions) | | Number of issues | | Fair value | | Unrealized losses | | Number of issues | | Fair value | | Unrealized losses | | Total unrealized losses |
| December 31, 2020 | | | | | | | | | | | | | | |
| Fixed income securities | | | | | | | | | | | | | | |
| U.S. government and agencies | | 23 | | | $ | 185 | | | $ | (1) | | | — | | | $ | — | | | $ | — | | | $ | (1) | |
| Municipal | | 47 | | | 148 | | | (2) | | | — | | | — | | | — | | | (2) | |
| Corporate | | 127 | | | 1,229 | | | (39) | | | 27 | | | 187 | | | (26) | | | (65) | |
| Foreign government | | 7 | | | 7 | | | — | | | — | | | — | | | — | | | — | |
| ABS | | 22 | | | 160 | | | (2) | | | 13 | | | 49 | | | (3) | | | (5) | |
| MBS | | 14 | | | — | | | — | | | 67 | | | — | | | — | | | — | |
| Total fixed income securities | | 240 | | | $ | 1,729 | | | $ | (44) | | | 107 | | | $ | 236 | | | $ | (29) | | | $ | (73) | |
| Investment grade fixed income securities | | 163 | | | $ | 1,193 | | | $ | (13) | | | 84 | | | $ | 117 | | | $ | (17) | | | $ | (30) | |
| Below investment grade fixed income securities | | 77 | | | 536 | | | (31) | | | 23 | | | 119 | | | (12) | | | (43) | |
| Total fixed income securities | | 240 | | | $ | 1,729 | | | $ | (44) | | | 107 | | | $ | 236 | | | $ | (29) | | | $ | (73) | |
| | | | | | | | | | | | | | |
| December 31, 2019 | | | | | | | | | | | | | | |
| Fixed income securities | | | | | | | | | | | | | | |
| U.S. government and agencies | | 31 | | | $ | 1,713 | | | $ | (26) | | | 10 | | | $ | 26 | | | $ | — | | | $ | (26) | |
| Municipal | | 307 | | | 576 | | | (9) | | | 1 | | | 14 | | | (2) | | | (11) | |
| Corporate | | 186 | | | 1,392 | | | (20) | | | 65 | | | 485 | | | (27) | | | (47) | |
| Foreign government | | 55 | | | 412 | | | (4) | | | 6 | | | 102 | | | (1) | | | (5) | |
| ABS | | 36 | | | 193 | | | (2) | | | 23 | | | 160 | | | (4) | | | (6) | |
| MBS | | 27 | | | 15 | | | — | | | 123 | | | 14 | | | (1) | | | (1) | |
| Total fixed income securities | | 642 | | | $ | 4,301 | | | $ | (61) | | | 228 | | | $ | 801 | | | $ | (35) | | | $ | (96) | |
| Investment grade fixed income securities | | 581 | | | $ | 3,878 | | | $ | (41) | | | 185 | | | $ | 594 | | | $ | (20) | | | $ | (61) | |
| Below investment grade fixed income securities | | 61 | | | 423 | | | (20) | | | 43 | | | 207 | | | (15) | | | (35) | |
| Total fixed income securities | | 642 | | | $ | 4,301 | | | $ | (61) | | | 228 | | | $ | 801 | | | $ | (35) | | | $ | (96) | |
The Allstate Corporation 153
2020 Form 10-K Notes to Consolidated Financial Statements
| | | | | | | | | | | | | | | | | | | | |
Gross unrealized losses by unrealized loss position and credit quality as of December 31, 2020 |
| ($ in millions) | | Investment grade | | Below investment grade | | Total |
Fixed income securities with unrealized loss position less than 20% of amortized cost, net (1) (2) | | $ | (15) | | | $ | (24) | | | $ | (39) | |
Fixed income securities with unrealized loss position greater than or equal to 20% of amortized cost, net (3) (4) | | (15) | | | (19) | | | (34) | |
| Total unrealized losses | | $ | (30) | | | $ | (43) | | | $ | (73) | |
(1)Below investment grade fixed income securities include $17 million that have been in an unrealized loss position for less than twelve months.
(2)Related to securities with an unrealized loss position less than 20% of amortized cost, net, the degree of which suggests that these securities do not pose a high risk of having credit losses.
(3)No below investment grade fixed income securities have been in an unrealized loss position for a period of twelve or more consecutive months.
(4)Evaluated based on factors such as discounted cash flows and the financial condition and near-term and long-term prospects of the issue or issuer and were determined to have adequate resources to fulfill contractual obligations
Investment grade is defined as a security having a rating of Aaa, Aa, A or Baa from Moody’s, a rating of AAA, AA, A or BBB from S&P Global Ratings (“S&P”), a comparable rating from another nationally recognized rating agency, or a comparable internal rating if an externally provided rating is not available. Market prices for certain securities may have credit spreads which imply higher or lower credit quality than the current third-party rating. Unrealized losses on investment grade securities are principally related to an increase in market yields which may include increased risk-free interest rates or wider credit spreads since the time of initial purchase. The unrealized losses are expected to reverse as the securities approach maturity.
ABS and MBS in an unrealized loss position were evaluated based on actual and projected collateral losses relative to the securities’ positions in the respective securitization trusts, security specific expectations of cash flows, and credit ratings. This evaluation also takes into consideration credit enhancement, measured in terms of (i) subordination from other classes of securities in the trust that are contractually obligated to absorb losses before the class of security the Company owns, and (ii) the expected impact of other structural features embedded in the securitization trust beneficial to the class of securities the Company owns, such as overcollateralization and excess spread. Municipal bonds in an unrealized loss position were evaluated based on the underlying credit quality of the primary obligor, obligation type and quality of the underlying assets.
As of December 31, 2020, the Company has not made the decision to sell and it is not more likely than not the Company will be required to sell fixed income securities with unrealized losses before recovery of the amortized cost basis.
Loans The Company establishes a credit loss allowance for mortgage loans, bank loans and agent loans when they are originated or purchased, and for unfunded commitments unless they are unconditionally cancellable by the Company. The Company uses a probability of default and loss given default model for mortgage loans and bank loans to estimate current expected credit losses that considers all relevant information available including past events, current conditions, and reasonable and supportable forecasts over the life of an asset. The Company also considers such factors as historical losses, expected prepayments and various economic factors. For mortgage loans the Company considers origination vintage year and property level information such as debt service coverage, property type, property location and collateral value. For bank loans the Company considers the credit rating of the borrower, credit spreads and type of loan. After the reasonable and supportable forecast period, the Company’s model reverts to historical loss trends. Given the less complex and homogenous nature of agent loans, the Company estimates current expected credit losses using historical loss experience over the estimated life of the loans, adjusted for current conditions, reasonable and supportable forecasts and expected prepayments.
Loans are evaluated on a pooled basis when they share similar risk characteristics. The Company monitors loans through a quarterly credit monitoring process to determine when they no longer share similar risk characteristics and are to be evaluated individually when estimating credit losses.
Loans are written off against their corresponding allowances when there is no reasonable expectation of recovery. If a loan recovers after a write-off, the estimate of expected credit losses includes the expected recovery.
Accrual of income is suspended for loans that are in default or when full and timely collection of principal and interest payments is not probable. Accrued income receivable is monitored for recoverability and when not expected to be collected is written off through net investment income. Cash receipts on
Notes to Consolidated Financial Statements 2020 Form 10-K
loans on non-accrual status are generally recorded as a reduction of amortized cost.
Accrued interest is excluded from the amortized cost of loans and is reported within the accrued investment income line of the Consolidated Statements of Financial Position. As of December 31, 2020, accrued interest totaled $15 million, $4 million and $2 million for mortgage loans, bank loans and agent loans, respectively.
Mortgage loans When it is determined a mortgage loan shall be evaluated individually, the Company uses various methods to estimate credit losses on individual loans such as using collateral value less estimated costs to sell where applicable, including when foreclosure is probable or when repayment is expected to be provided substantially through the operation or sale of the collateral and the borrower is experiencing financial difficulty. When collateral value is used, the mortgage loans may not have a credit loss allowance when the fair value of the collateral exceeds the loan’s
amortized cost. An alternative approach may be utilized to estimate credit losses using the present value of the loan’s expected future repayment cash flows discounted at the loan’s current effective interest rate.
Individual loan credit loss allowances are adjusted for subsequent changes in the fair value of the collateral less costs to sell, when applicable, or present value of the loan’s expected future repayment cash flows.
Debt service coverage ratio is considered a key credit quality indicator when mortgage loan credit loss allowances are estimated. Debt service coverage ratio represents the amount of estimated cash flow from the property available to the borrower to meet principal and interest payment obligations. Debt service coverage ratio estimates are updated annually or more frequently if conditions are warranted based on the Company’s credit monitoring process.
| | | | | | | | | | | | | | | | | | | | | | | | | | | | | | | | | | | | | | | | | | | | | | | | | | |
Mortgage loans amortized cost by debt service coverage ratio distribution and year of origination |
| | December 31, 2020 | | December 31, 2019 |
| ($ in millions) | | 2015 and prior | | 2016 | | 2017 | | 2018 | | 2019 | | Current | | Total | | Total |
| Below 1.0 | | $ | 15 | | | $ | — | | | $ | — | | | $ | — | | | $ | — | | | $ | — | | | $ | 15 | | | $ | 56 | |
| 1.0 - 1.25 | | 133 | | | 27 | | | 36 | | | 70 | | | 48 | | | 24 | | | 338 | | | 225 | |
| 1.26 - 1.50 | | 378 | | | 41 | | | 144 | | | 187 | | | 333 | | | 6 | | | 1,089 | | | 1,237 | |
| Above 1.50 | | 1,037 | | | 396 | | | 283 | | | 373 | | | 499 | | | 112 | | | 2,700 | | | 3,302 | |
| Amortized cost before allowance | | $ | 1,563 | | | $ | 464 | | | $ | 463 | | | $ | 630 | | | $ | 880 | | | $ | 142 | | | $ | 4,142 | | | $ | 4,820 | |
Allowance (1) | | | | | | | | | | | | | | (67) | | | (3) | |
| Amortized cost, net | | | | | | | | | | | | | | $ | 4,075 | | | $ | 4,817 | |
(1)Due to the adoption of the measurement of credit losses on financial instruments accounting standard, prior valuation allowance is now presented as an allowance for expected credit losses.
Mortgage loans with a debt service coverage ratio below 1.0 that are not considered impaired primarily relate to situations where the borrower has the financial capacity to fund the revenue shortfalls from the properties for the foreseeable term, the decrease in cash flows from the properties is considered temporary, or there are other risk mitigating factors such as additional collateral, escrow balances or
borrower guarantees. Payments on all mortgage loans were current as of December 31, 2020, 2019 and 2018. During the fourth quarter of 2020, the Company sold $234 million of mortgage loans, net of a $17 million credit loss allowance, resulting in a net realized capital loss of $4 million.
| | | | | | | | |
Rollforward of credit loss allowance for mortgage loans |
| ($ in millions) | | For the year ended December 31, 2020 |
| Beginning balance | | $ | (3) | |
| Cumulative effect of change in accounting principle | | (42) | |
Net increases related to credit losses | | (39) | |
| Reduction of allowance related to sales | | 17 | |
| Write-offs | | — | |
| Ending balance | | $ | (67) | |
Bank loans When it is determined a bank loan shall be evaluated individually, the Company uses various methods to estimate credit losses on individual loans such as the present value of the loan’s expected future repayment cash flows discounted at the loan’s current effective interest rate.
Credit ratings of the borrower are considered a key credit quality indicator when bank loan credit loss allowances are estimated. The ratings are updated quarterly and are either received from a nationally recognized rating agency or
The Allstate Corporation 155
2020 Form 10-K Notes to Consolidated Financial Statements
a comparable internal rating is derived if an externally provided rating is not available. The year of origination is determined to be the year in which the asset is acquired.
| | | | | | | | | | | | | | | | | | | | | | | | | | | | | | | | | | | | | | | | | | | | |
Bank loans amortized cost by credit rating and year of origination |
| ($ in millions) | | As of December 31, 2020 |
| | 2015 and prior | | 2016 | | 2017 | | 2018 | | 2019 | | Current | | Total |
| BBB | | $ | — | | | $ | — | | | $ | 9 | | | $ | 7 | | | $ | 14 | | | $ | 13 | | | $ | 43 | |
| BB | | 20 | | | 2 | | | 25 | | | 58 | | | 53 | | | 54 | | | 212 | |
| B | | 11 | | | 23 | | | 115 | | | 141 | | | 122 | | | 195 | | | 607 | |
| CCC and below | | 7 | | | 16 | | | 44 | | | 50 | | | 74 | | | 32 | | | 223 | |
| Amortized cost before allowance | | $ | 38 | | | $ | 41 | | | $ | 193 | | | $ | 256 | | | $ | 263 | | | $ | 294 | | | $ | 1,085 | |
| Allowance | | | | | | | | | | | | | | (67) | |
| Amortized cost, net | | | | | | | | | | | | | | $ | 1,018 | |
| | | | | | | | |
Rollforward of credit loss allowance for bank loans |
| | For the year ended December 31, 2020 |
| ($ in millions) | |
| Beginning balance | | $ | — | |
| Cumulative effect of change in accounting principle | | (53) | |
Net increases related to credit losses | | (28) | |
| Reduction of allowance related to sales | | 9 | |
| Write-offs | | 5 | |
| Ending balance | | $ | (67) | |
Agent loans The Company monitors agent loans to determine when they should be removed from the pool and assessed for credit losses individually by using internal credit risk grades that classify the loans into risk categories. The categorization is based on relevant information about the ability of borrowers to service their debt, such as historical payment experience, current business trends, cash flow coverage and collateral quality. Internal credit risk grades are updated annually or more frequently if conditions are warranted based on the Company’s credit monitoring process.
As of December 31, 2020, 85% of agent loans balance represents the top three highest credit quality categories. The allowance for agent loans totaled $5 million as of December 31, 2020 and did not change from January 1, 2020.
| | | | | |
| Note 6 | Fair Value of Assets and Liabilities |
Fair value is defined as the price that would be received to sell an asset or paid to transfer a liability in an orderly transaction between market participants at the measurement date. The hierarchy for inputs used in determining fair value maximizes the use of observable inputs and minimizes the use of unobservable inputs by requiring that observable inputs be used when available. Assets and liabilities recorded on the Consolidated Statements of Financial Position at fair value are categorized in the fair value hierarchy based on the observability of inputs to the valuation techniques as follows:
Level 1: Assets and liabilities whose values are based on unadjusted quoted prices for identical assets or liabilities in an active market that the Company can access.
Level 2: Assets and liabilities whose values are based on the following:
(a)Quoted prices for similar assets or liabilities in active markets;
(b)Quoted prices for identical or similar assets or liabilities in markets that are not active; or
(c)Valuation models whose inputs are observable, directly or indirectly, for substantially the full term of the asset or liability.
Level 3: Assets and liabilities whose values are based on prices or valuation techniques that require inputs that are both unobservable and significant to the overall fair value measurement. Unobservable inputs reflect the Company’s estimates of the assumptions that market participants would use in valuing the assets and liabilities.
The availability of observable inputs varies by instrument. In situations where fair value is based on internally developed pricing models or inputs that are unobservable in the market, the determination of fair value requires more judgment. The degree of judgment exercised by the Company in determining fair value is typically greatest for instruments categorized in Level 3. In many instances, valuation inputs used to measure fair value fall into different levels of the fair value hierarchy. The category level in the fair value hierarchy is determined based on the lowest level input that is significant to the fair value measurement in its entirety. The Company uses prices and inputs that are current as of the measurement date, including during periods of market disruption. In
Notes to Consolidated Financial Statements 2020 Form 10-K
periods of market disruption, the ability to observe prices and inputs may be reduced for many instruments.
The Company is responsible for the determination of fair value and the supporting assumptions and methodologies. The Company gains assurance that assets and liabilities are appropriately valued through the execution of various processes and controls designed to ensure the overall reasonableness and consistent application of valuation methodologies, including inputs and assumptions, and compliance with accounting standards. For fair values received from third parties or internally estimated, the Company’s processes and controls are designed to ensure that the valuation methodologies are appropriate and consistently applied, the inputs and assumptions are reasonable and consistent with the objective of determining fair value, and the fair values are accurately recorded. For example, on a continuing basis, the Company assesses the reasonableness of individual fair values that have stale security prices or that exceed certain thresholds as compared to previous fair values received from valuation service providers or brokers or derived from internal models. The Company performs procedures to understand and assess the methodologies, processes and controls of valuation service providers. In addition, the Company may validate the reasonableness of fair values by comparing information obtained from valuation service providers or brokers to other third-party valuation sources for selected securities. The Company performs ongoing price validation procedures such as back-testing of actual sales, which corroborate the various inputs used in internal models to market observable data. When fair value determinations are expected to be more variable, the Company validates them through reviews by members of management who have relevant expertise and who are independent of those charged with executing investment transactions.
The Company has two types of situations where investments are classified as Level 3 in the fair value hierarchy:
(1)Specific inputs significant to the fair value estimation models are not market observable. This primarily occurs in the Company’s use of broker quotes to value certain securities where the inputs have not been corroborated to be market observable, and the use of valuation models that use significant non-market observable inputs.
(2)Quotes continue to be received from independent third-party valuation service providers and all significant inputs are market observable; however, there has been a significant decrease in the volume and level of activity for the asset when compared to normal market activity such that the degree of market observability has declined to a point where categorization as a Level 3 measurement is considered appropriate. The indicators considered in determining whether a significant decrease in the volume and level of activity for a specific asset has occurred include
the level of new issuances in the primary market, trading volume in the secondary market, the level of credit spreads over historical levels, applicable bid-ask spreads, and price consensus among market participants and other pricing sources.
Certain assets are not carried at fair value on a recurring basis, including mortgage loans, bank loans, agent loans and policy loans and are only included in the fair value hierarchy disclosure when the individual investment is reported at fair value.
In determining fair value, the Company principally uses the market approach which generally utilizes market transaction data for the same or similar instruments. To a lesser extent, the Company uses the income approach which involves determining fair values from discounted cash flow methodologies. For the majority of Level 2 and Level 3 valuations, a combination of the market and income approaches is used.
Summary of significant inputs and valuation techniques for Level 2 and Level 3 assets and liabilities measured at fair value on a recurring basis
Level 2 measurements
•Fixed income securities:
U.S. government and agencies, municipal, corporate - public and foreign government: The primary inputs to the valuation include quoted prices for identical or similar assets in markets that are not active, contractual cash flows, benchmark yields and credit spreads.
Corporate - privately placed: Privately placed are valued using a discounted cash flow model that is widely accepted in the financial services industry and uses market observable inputs and inputs derived principally from, or corroborated by, observable market data. The primary inputs to the discounted cash flow model include an interest rate yield curve, as well as published credit spreads for similar assets in markets that are not active that incorporate the credit quality and industry sector of the issuer.
Corporate - privately placed also includes redeemable preferred stock that are valued using quoted prices for identical or similar assets in markets that are not active, contractual cash flows, benchmark yields, underlying stock prices and credit spreads.
ABS and MBS: The primary inputs to the valuation include quoted prices for identical or similar assets in markets that are not active, contractual cash flows, benchmark yields, collateral performance, and credit spreads. Certain ABS are valued based on non-binding broker quotes whose inputs have been corroborated to be market observable. Residential MBS include prepayment speeds as a primary input for valuation.
•Equity securities: The primary inputs to the valuation include quoted prices or quoted net
The Allstate Corporation 157
2020 Form 10-K Notes to Consolidated Financial Statements
asset values for identical or similar assets in markets that are not active.
•Short-term: The primary inputs to the valuation include quoted prices for identical or similar assets in markets that are not active, contractual cash flows, benchmark yields and credit spreads.
•Other investments: Free-standing exchange listed derivatives that are not actively traded are valued based on quoted prices for identical instruments in markets that are not active.
Over-the-counter (“OTC”) derivatives, including interest rate swaps, foreign currency swaps, total return swaps, foreign exchange forward contracts, certain options and certain credit default swaps, are valued using models that rely on inputs such as interest rate yield curves, implied volatilities, index price levels, currency rates, and credit spreads that are observable for substantially the full term of the contract. The valuation techniques underlying the models are widely accepted in the financial services industry and do not involve significant judgment.
Level 3 measurements
•Fixed income securities:
Municipal: Comprise municipal bonds that are not rated by third-party credit rating agencies. The primary inputs to the valuation of these municipal bonds include quoted prices for identical or similar assets in markets that exhibit less liquidity relative to those markets supporting Level 2 fair value measurements, contractual cash flows, benchmark yields and credit spreads. Also included are municipal bonds valued based on non-binding broker quotes where the inputs have not been corroborated to be market observable and municipal bonds in default valued based on the present value of expected cash flows.
Corporate - public and privately placed, ABS and MBS: Primarily valued based on non-binding broker quotes where the inputs have not been corroborated to be market observable. Other inputs for corporate fixed income securities include an interest rate yield curve, as well as published credit spreads for similar assets that incorporate the credit quality and industry sector of the issuer.
•Equity securities: The primary inputs to the valuation include quoted prices or quoted net asset values for identical or similar assets in markets that exhibit less liquidity relative to those markets supporting Level 2 fair value measurements.
•Short-term: For certain short-term investments, amortized cost is used as the best estimate of fair value.
•Other investments: Certain OTC derivatives, such as interest rate caps, certain credit default swaps and certain options (including swaptions), are valued using models that are widely accepted in the financial services industry. These are categorized as Level 3 as a result of the significance of non-market observable inputs such as volatility. Other primary inputs include interest rate yield curves and credit spreads.
•Contractholder funds: Derivatives embedded in certain life and annuity contracts are valued internally using models widely accepted in the financial services industry that determine a single best estimate of fair value for the embedded derivatives within a block of contractholder liabilities. The models primarily use stochastically determined cash flows based on the contractual elements of embedded derivatives, projected option cost and applicable market data, such as interest rate yield curves and equity index volatility assumptions. These are categorized as Level 3 as a result of the significance of non-market observable inputs.
Investments excluded from the fair value hierarchy
Limited partnerships carried at fair value, which do not have readily determinable fair values, use NAV provided by the investees and are excluded from the fair value hierarchy. These investments are generally not redeemable by the investees and generally cannot be sold without approval of the general partner. The Company receives distributions of income and proceeds from the liquidation of the underlying assets of the investees, which usually takes place in years 4-9 of the typical contractual life of 10-12 years. As of December 31, 2020, the Company has commitments to invest $395 million in these limited partnership interests.
Notes to Consolidated Financial Statements 2020 Form 10-K
| | | | | | | | | | | | | | | | | | | | | | | | | | | | | | | | |
| Assets and liabilities measured at fair value |
| | As of December 31, 2020 |
| ($ in millions) | | Quoted prices in active markets for identical assets (Level 1) | | Significant other observable inputs (Level 2) | | Significant unobservable inputs (Level 3) | | Counterparty and cash collateral netting | | Total |
| Assets | | | | | | | | | | |
| Fixed income securities: | | | | | | | | | | |
| U.S. government and agencies | | $ | 2,863 | | | $ | 359 | | | $ | — | | | | | $ | 3,222 | |
| Municipal | | — | | | 9,520 | | | 67 | | | | | 9,587 | |
| Corporate - public | | — | | | 36,346 | | | 98 | | | | | 36,444 | |
| Corporate - privately placed | | — | | | 14,568 | | | 130 | | | | | 14,698 | |
| Foreign government | | — | | | 1,055 | | | — | | | | | 1,055 | |
| ABS | | — | | | 1,213 | | | 57 | | | | | 1,270 | |
| MBS | | — | | | 51 | | | 27 | | | | | 78 | |
| | | | | | | | | | |
| | | | | | | | | | |
| | | | | | | | | | |
| Total fixed income securities | | 2,863 | | | 63,112 | | | 379 | | | | | 66,354 | |
| Equity securities | | 3,882 | | | 410 | | | 418 | | | | | 4,710 | |
| Short-term investments | | 7,477 | | | 288 | | | 35 | | | | | 7,800 | |
| Other investments: Free-standing derivatives | | — | | | 219 | | | — | | | $ | (15) | | | 204 | |
| Separate account assets | | 3,344 | | | — | | | — | | | | | 3,344 | |
| Other assets | | 1 | | | — | | | — | | | | | 1 | |
| | | | | | | | | | |
| | | | | | | | | | |
| Total recurring basis assets | | 17,567 | | | 64,029 | | | 832 | | | (15) | | | 82,413 | |
| Total assets at fair value | | $ | 17,567 | | | $ | 64,029 | | | $ | 832 | | | $ | (15) | | | $ | 82,413 | |
| % of total assets at fair value | | 21.3 | % | | 77.7 | % | | 1.0 | % | | — | % | | 100.0 | % |
| | | | | | | | | | |
| Investments reported at NAV | | | | | | | | | | 1,824 | |
| Total | | | | | | | | | | $ | 84,237 | |
| | | | | | | | | | |
| Liabilities | | | | | | | | | | |
| Contractholder funds: Derivatives embedded in life and annuity contracts | | $ | — | | | $ | — | | | $ | (516) | | | | | $ | (516) | |
| Other liabilities: Free-standing derivatives | | — | | | (153) | | | — | | | $ | 27 | | | (126) | |
| Total recurring basis liabilities | | $ | — | | | $ | (153) | | | $ | (516) | | | $ | 27 | | | $ | (642) | |
| % of total liabilities at fair value | | — | % | | 23.8 | % | | 80.4 | % | | (4.2) | % | | 100.0 | % |
The Allstate Corporation 159
2020 Form 10-K Notes to Consolidated Financial Statements
| | | | | | | | | | | | | | | | | | | | | | | | | | | | | | | | |
| Assets and liabilities measured at fair value |
| | As of December 31, 2019 |
| ($ in millions) | | Quoted prices in active markets for identical assets (Level 1) | | Significant other observable inputs (Level 2) | | Significant unobservable inputs (Level 3) | | Counterparty and cash collateral netting | | Total |
| Assets | | | | | | | | | | |
| Fixed income securities: | | | | | | | | | | |
| U.S. government and agencies | | $ | 4,689 | | | $ | 397 | | | $ | — | | | | | $ | 5,086 | |
| Municipal | | — | | | 8,558 | | | 62 | | | | | 8,620 | |
| Corporate - public | | — | | | 30,819 | | | 61 | | | | | 30,880 | |
| Corporate - privately placed | | — | | | 12,084 | | | 114 | | | | | 12,198 | |
| Foreign government | | — | | | 979 | | | — | | | | | 979 | |
| ABS | | — | | | 797 | | | 65 | | | | | 862 | |
| MBS | | — | | | 379 | | | 40 | | | | | 419 | |
| | | | | | | | | | |
| | | | | | | | | | |
| | | | | | | | | | |
| Total fixed income securities | | 4,689 | | | 54,013 | | | 342 | | | | | 59,044 | |
| Equity securities | | 7,407 | | | 384 | | | 371 | | | | | 8,162 | |
| Short-term investments | | 1,940 | | | 2,291 | | | 25 | | | | | 4,256 | |
| Other investments: Free-standing derivatives | | — | | | 180 | | | — | | | $ | (40) | | | 140 | |
| Separate account assets | | 3,044 | | | — | | | — | | | | | 3,044 | |
| Other assets | | 1 | | | — | | | — | | | | | 1 | |
| | | | | | | | | | |
| Total recurring basis assets | | 17,081 | | | 56,868 | | | 738 | | | (40) | | | 74,647 | |
| | | | | | | | | | |
| Total assets at fair value | | $ | 17,081 | | | $ | 56,868 | | | $ | 738 | | | $ | (40) | | | $ | 74,647 | |
| % of total assets at fair value | | 22.9 | % | | 76.2 | % | | 1.0 | % | | (0.1) | % | | 100.0 | % |
| | | | | | | | | | |
| Investments reported at NAV | | | | | | | | | | 1,814 | |
| Total | | | | | | | | | | $ | 76,461 | |
| Liabilities | | | | | | | | | | |
| Contractholder funds: Derivatives embedded in life and annuity contracts | | $ | — | | | $ | — | | | $ | (462) | | | | | $ | (462) | |
| Other liabilities: Free-standing derivatives | | — | | | (84) | | | — | | | $ | 12 | | | (72) | |
| | | | | | | | | | |
| | | | | | | | | | |
| | | | | | | | | | |
| Total recurring basis liabilities | | $ | — | | | $ | (84) | | | $ | (462) | | | $ | 12 | | | $ | (534) | |
| % of total liabilities at fair value | | — | % | | 15.7 | % | | 86.5 | % | | (2.2) | % | | 100.0 | % |
| | | | | | | | | | | | | | | | | | | | | | | | | | | | | | | | |
Quantitative information about the significant unobservable inputs used in Level 3 fair value measurements |
| ($ in millions) | | Fair value | | Valuation technique | | Unobservable input | | Range | | Weighted average |
| December 31, 2020 | | | | | | | | | | |
| Derivatives embedded in life and annuity contracts – Equity-indexed and forward starting options | | $ | (483) | | | Stochastic cash flow model | | Projected option cost | | 1.0% - 4.2% | | 2.80% |
| | | | | | | | | | |
| December 31, 2019 | | | | | | | | | | |
| Derivatives embedded in life and annuity contracts – Equity-indexed and forward starting options | | $ | (430) | | | Stochastic cash flow model | | Projected option cost | | 1.0% - 4.2% | | 2.67% |
The embedded derivatives are equity-indexed and forward starting options in certain life and annuity products that provide customers with interest crediting rates based on the performance of the S&P 500. If the projected option cost increased (decreased), it would result in a higher (lower) liability fair value.
As of December 31, 2020 and 2019, Level 3 fair value measurements of fixed income securities total $379 million and $342 million, respectively, and include $93 million and $50 million, respectively, of securities valued based on non-binding broker quotes where the inputs have not been corroborated to be market
observable and $35 million and $36 million, respectively, of municipal fixed income securities that are not rated by third-party credit rating agencies. As the Company does not develop the Level 3 fair value unobservable inputs for these fixed income securities, they are not included in the table above. However, an increase (decrease) in credit spreads for fixed income securities valued based on non-binding broker quotes would result in a lower (higher) fair value, and an increase (decrease) in the credit rating of municipal bonds that are not rated by third-party credit rating agencies would result in a higher (lower) fair value.
Notes to Consolidated Financial Statements 2020 Form 10-K
| | | | | | | | | | | | | | | | | | | | | | | | | | | | | | | | | | | | | | | | | | | | | | | | | | | | | | | | | | | | | | |
Rollforward of Level 3 assets and liabilities held at fair value during the year ended December 31, 2020 |
| | Balance as of December 31, 2019 | | Total gains (losses) included in: | | Transfers | | | | | | | | | | Balance as of December 31, 2020 |
| ($ in millions) | | | Net income | | OCI | | Into Level 3 | | Out of Level 3 | | Purchases | | Sales | | Issues | | Settlements | |
| Assets | | | | | | | | | | | | | | | | | | | | |
| Fixed income securities: | | | | | | | | | | | | | | | | | | | | |
| Municipal | | $ | 62 | | | $ | 1 | | | $ | 2 | | | $ | 20 | | | $ | (11) | | | $ | — | | | $ | (4) | | | $ | — | | | $ | (3) | | | $ | 67 | |
| Corporate - public | | 61 | | | (1) | | | 1 | | | 2 | | | — | | | 55 | | | (19) | | | — | | | (1) | | | 98 | |
| Corporate - privately placed | | 114 | | | 2 | | | (12) | | | 52 | | | (31) | | | 25 | | | (17) | | | — | | | (3) | | | 130 | |
| ABS | | 65 | | | — | | | (1) | | | 54 | | | (49) | | | 48 | | | (32) | | | — | | | (28) | | | 57 | |
| MBS | | 40 | | | 1 | | | (2) | | | — | | | — | | | 11 | | | (7) | | | — | | | (16) | | | 27 | |
| Total fixed income securities | | 342 | | | 3 | | | (12) | | | 128 | | | (91) | | | 139 | | | (79) | | | — | | | (51) | | | 379 | |
| Equity securities | | 371 | | | (3) | | | — | | | — | | | — | | | 66 | | | (16) | | | — | | | — | | | 418 | |
| Short-term investments | | 25 | | | — | | | — | | | — | | | (25) | | | 35 | | | — | | | — | | | — | | | 35 | |
| | | | | | | | | | | | | | | | | | | | |
| | | | | | | | | | | | | | | | | | | | |
| Total recurring Level 3 assets | | 738 | | | — | | | (12) | | | 128 | | | (116) | | | 240 | | | (95) | | | — | | | (51) | | | 832 | |
| Liabilities | | | | | | | | | | | | | | | | | | | | |
| Contractholder funds: Derivatives embedded in life and annuity contracts | | (462) | | | (43) | | | — | | | — | | | — | | | — | | | — | | | (34) | | | 23 | | | (516) | |
| Total recurring Level 3 liabilities | | $ | (462) | | | $ | (43) | | | $ | — | | | $ | — | | | $ | — | | | $ | — | | | $ | — | | | $ | (34) | | | $ | 23 | | | $ | (516) | |
| | | | | | | | | | | | | | | | | | | | | | | | | | | | | | | | |
Total Level 3 gains (losses) included in net income for the year ended December 31, 2020 |
| ($ in millions) | | Net investment income | | Realized capital gains (losses) | | Life contract benefits | | Interest credited to contractholder funds | | Total |
| Components of net income | | $ | (23) | | | $ | 23 | | | $ | (1) | | | $ | (42) | | | $ | (43) | |
| | | | | | | | | | | | | | | | | | | | | | | | | | | | | | | | | | | | | | | | | | | | | | | | | | | | | | | | | | | | | | |
Rollforward of Level 3 assets and liabilities held at fair value during the year ended December 31, 2019 |
| | Balance as of December 31, 2018 | | Total gains (losses) included in: | | Transfers | | | | | | | | | | Balance as of December 31, 2019 |
| ($ in millions) | | | Net income | | OCI | | Into
Level 3 | | Out of Level 3 | | Purchases | | Sales | | Issues | | Settlements | |
| Assets | | | | | | | | | | | | | | | | | | | | |
| Fixed income securities: | | | | | | | | | | | | | | | | | | | | |
| | | | | | | | | | | | | | | | | | | | |
| Municipal | | $ | 70 | | | $ | 1 | | | $ | 4 | | | $ | — | | | $ | (5) | | | $ | — | | | $ | (5) | | | $ | — | | | $ | (3) | | | $ | 62 | |
| Corporate - public | | 70 | | | — | | | 3 | | | 30 | | | (113) | | | 86 | | | (11) | | | — | | | (4) | | | 61 | |
| Corporate - privately placed | | 90 | | | (1) | | | 2 | | | 43 | | | (2) | | | 4 | | | (13) | | | — | | | (9) | | | 114 | |
| ABS | | 69 | | | 1 | | | (1) | | | 76 | | | (210) | | | 159 | | | (22) | | | — | | | (7) | | | 65 | |
| MBS | | 26 | | | — | | | (2) | | | 9 | | | — | | | 9 | | | — | | | — | | | (2) | | | 40 | |
| | | | | | | | | | | | | | | | | | | | |
| | | | | | | | | | | | | | | | | | | | |
| | | | | | | | | | | | | | | | | | | | |
| Total fixed income securities | | 325 | | | 1 | | | 6 | | | 158 | | | (330) | | | 258 | | | (51) | | | — | | | (25) | | | 342 | |
| Equity securities | | 341 | | | 30 | | | — | | | — | | | — | | | 82 | | | (82) | | | — | | | — | | | 371 | |
| Short-term investments | | 30 | | | — | | | — | | | — | | | — | | | 35 | | | (40) | | | — | | | — | | | 25 | |
| Free-standing derivatives, net | | 1 | | | (1) | | | — | | | — | | | — | | | — | | | — | | | — | | | — | | | — | |
| | | | | | | | | | | | | | | | | | | | |
| Total recurring Level 3 assets | | 697 | | | 30 | | | 6 | | | 158 | | | (330) | | | 375 | | | (173) | | | — | | | (25) | | | 738 | |
| Liabilities | | | | | | | | | | | | | | | | | | | | |
| Contractholder funds: Derivatives embedded in life and annuity contracts | | (224) | | | (61) | | | — | | | (175) | | | — | | | — | | | — | | | (16) | | | 14 | | | (462) | |
| Total recurring Level 3 liabilities | | $ | (224) | | | $ | (61) | | | $ | — | | | $ | (175) | | | $ | — | | | $ | — | | | $ | — | | | $ | (16) | | | $ | 14 | | | $ | (462) | |
| | | | | | | | | | | | | | | | | | | | | | | | | | | | | | | | |
Total Level 3 gains (losses) included in net income for the year ended December 31, 2019 |
| ($ in millions) | | Net investment income | | Realized capital gains (losses) | | Life contract benefits | | Interest credited to contractholder funds | | Total |
| Components of net income | | $ | (2) | | | $ | 32 | | | $ | 7 | | | $ | (68) | | | $ | (31) | |
The Allstate Corporation 161
2020 Form 10-K Notes to Consolidated Financial Statements
| | | | | | | | | | | | | | | | | | | | | | | | | | | | | | | | | | | | | | | | | | | | | | | | | | | | | | | | | | | | | | |
Rollforward of Level 3 assets and liabilities held at fair value during the year ended December 31, 2018 |
| | Balance as of December 31, 2017 | | Total gains (losses) included in: | | Transfers | | | | | | | | | | Balance as of December 31, 2018 |
| ($ in millions) | | | Net income | | OCI | | Into
Level 3 | | Out of Level 3 | | Purchases | | Sales | | Issues | | Settlements | |
| Assets | | | | | | | | | | | | | | | | | | | | |
| Fixed income securities: | | | | | | | | | | | | | | | | | | | | |
| Municipal | | $ | 101 | | | $ | 1 | | | $ | (2) | | | $ | — | | | $ | (26) | | | $ | 10 | | | $ | (8) | | | $ | — | | | $ | (6) | | | $ | 70 | |
| Corporate - public | | 108 | | | — | | | (3) | | | 17 | | | (21) | | | 10 | | | (38) | | | — | | | (3) | | | 70 | |
| Corporate - privately placed | | 224 | | | (1) | | | (3) | | | 20 | | | (119) | | | 22 | | | (5) | | | — | | | (48) | | | 90 | |
| ABS | | 147 | | | — | | | 2 | | | 42 | | | (159) | | | 160 | | | (97) | | | — | | | (26) | | | 69 | |
| MBS | | 26 | | | — | | | — | | | — | | | — | | | 1 | | | — | | | — | | | (1) | | | 26 | |
| Total fixed income securities | | 606 | | | — | | | (6) | | | 79 | | | (325) | | | 203 | | | (148) | | | — | | | (84) | | | 325 | |
| Equity securities | | 210 | | | 37 | | | — | | | — | | | — | | | 109 | | | (15) | | | — | | | — | | | 341 | |
| Short-term investments | | 20 | | | — | | | — | | | — | | | — | | | 55 | | | (45) | | | — | | | — | | | 30 | |
| Free-standing derivatives, net | | 1 | | | — | | | — | | | — | | | — | | | — | | | — | | | — | | | — | | | 1 | |
| | | | | | | | | | | | | | | | | | | | |
| Total recurring Level 3 assets | | 837 | | | 37 | | | (6) | | | 79 | | | (325) | | | 367 | | | (208) | | | — | | | (84) | | | 697 | |
| Liabilities | | | | | | | | | | | | | | | | | | | | |
| Contractholder funds: Derivatives embedded in life and annuity contracts | | (286) | | | 58 | | | — | | | — | | | — | | | — | | | — | | | (2) | | | 6 | | | (224) | |
| Total recurring Level 3 liabilities | | $ | (286) | | | $ | 58 | | | $ | — | | | $ | — | | | $ | — | | | $ | — | | | $ | — | | | $ | (2) | | | $ | 6 | | | $ | (224) | |
| | | | | | | | | | | | | | | | | | | | | | | | | | | | | | | | |
Total Level 3 gains (losses) included in net income for the year ended December 31, 2018 |
| ($ in millions) | | Net investment income | | Realized capital gains (losses) | | Life contract benefits | | Interest credited to contractholder funds | | Total |
| Components of net income | | $ | — | | | $ | 37 | | | $ | (5) | | | $ | 63 | | | $ | 95 | |
Transfers into Level 3 during 2020, 2019 and 2018 included situations where a quote was not provided by the Company’s independent third-party valuation service provider and as a result the price was stale or had been replaced with a broker quote where the inputs had not been corroborated to be market observable resulting in the security being classified as Level 3. Transfers into Level 3 during 2019 also included derivatives embedded in equity-indexed universal life contracts due to refinements in the valuation modeling resulting in an increase in significance of non-market observable inputs.
Transfers out of Level 3 during 2020, 2019 and 2018 included situations where a broker quote was used in the prior period and a quote became available from the Company’s independent third-party valuation service provider in the current period. A quote utilizing the new pricing source was not available as of the prior period, and any gains or losses related to the change in valuation source for individual securities were not significant.
Notes to Consolidated Financial Statements 2020 Form 10-K
| | | | | | | | | | | | | | | | | | | | |
Valuation changes included in net income and OCI for Level 3 assets and liabilities held as of December 31, |
| ($ in millions) | | 2020 | | 2019 | | 2018 |
| Assets | | | | | | |
| Fixed income securities: | | | | | | |
| Municipal | | $ | 1 | | | $ | 1 | | | $ | — | |
| Corporate - public | | (2) | | | — | | | — | |
| Corporate - privately placed | | 2 | | | — | | | — | |
| | | | | | |
| | | | | | |
| | | | | | |
| Total fixed income securities | | 1 | | | 1 | | | — | |
| Equity securities | | (3) | | | 6 | | | 36 | |
| Free-standing derivatives, net | | — | | | (1) | | | — | |
| | | | | | |
| | | | | | |
| Total recurring Level 3 assets | | $ | (2) | | | $ | 6 | | | $ | 36 | |
| Liabilities | | | | | | |
| Contractholder funds: Derivatives embedded in life and annuity contracts | | $ | (43) | | | $ | (61) | | | $ | 58 | |
| | | | | | |
| Total recurring Level 3 liabilities | | (43) | | | (61) | | | 58 | |
| Total included in net income | | $ | (45) | | | $ | (55) | | | $ | 94 | |
| | | | | | |
| Components of net income | | | | | | |
| Net investment income | | $ | (24) | | | $ | (2) | | | $ | — | |
| Realized capital gains (losses) | | 22 | | | 8 | | | 36 | |
| Life contract benefits | | (1) | | | 7 | | | (5) | |
| Interest credited to contractholder funds | | (42) | | | (68) | | | 63 | |
| Total included in net income | | $ | (45) | | | $ | (55) | | | $ | 94 | |
| | | | | | |
| Assets | | | | | | |
| Municipal | | $ | 2 | | | | | |
| Corporate - public | | 1 | | | | | |
| Corporate - privately placed | | (11) | | | | | |
| ABS | | (1) | | | | | |
Changes in unrealized net capital gains and losses reported in OCI (1) | | $ | (9) | | | | | |
(1)Effective January 1, 2020, the Company adopted the fair value accounting standard that prospectively requires the disclosure of valuation changes reported in OCI.
| | | | | | | | | | | | | | | | | | | | | | | | | | | | | | | | |
Financial instruments not carried at fair value |
| ($ in millions) | | | | December 31, 2020 | | December 31, 2019 |
| Financial assets | | Fair value level | | Amortized cost, net | | Fair value | | Amortized cost, net | | Fair value |
| | | | | | | | | | |
| Mortgage loans | | Level 3 | | $ | 4,075 | | | $ | 4,348 | | | $ | 4,817 | | | $ | 5,012 | |
| Bank loans | | Level 3 | | 1,018 | | | 1,053 | | | 1,204 | | | 1,185 | |
| Agent loans | | Level 3 | | 631 | | | 634 | | | 666 | | | 664 | |
| | | | | | | | | | |
| | | | | | | | | | |
| Financial liabilities | | Fair value level | | Carrying value (1) | | Fair value | | Carrying value (1) | | Fair value |
| Contractholder funds on investment contracts | | Level 3 | | $ | 7,795 | | | $ | 9,089 | | | $ | 8,438 | | | $ | 9,158 | |
| Long-term debt | | Level 2 | | 7,825 | | | 9,489 | | | 6,631 | | | 7,738 | |
| Liability for collateral | | Level 2 | | 1,249 | | | 1,249 | | | 1,829 | | | 1,829 | |
(1)Represents the amounts reported on the Consolidated Statements of Financial Position.
| | | | | |
| Note 7 | Derivative Financial Instruments and Off-balance Sheet Financial Instruments |
The Company uses derivatives for risk reduction and to increase investment portfolio returns through asset replication. Risk reduction activity is focused on managing the risks with certain assets and liabilities arising from the potential adverse impacts from changes in risk-free interest rates, changes in equity market valuations, increases in credit spreads and foreign currency fluctuations.
Asset replication refers to the “synthetic” creation of assets through the use of derivatives. The Company replicates fixed income securities using a combination of a credit default swap, index total return swap,
options, or a foreign currency forward contract and one or more highly rated fixed income securities, primarily investment grade host bonds, to synthetically replicate the economic characteristics of one or more cash market securities. The Company replicates equity securities using futures, index total return swaps, and options to increase equity exposure.
Property-Liability may use interest rate swaps, swaptions, futures and options to manage the interest rate risks of existing investments. These instruments are utilized to change the duration of the portfolio in order to offset the economic effect that interest rates
The Allstate Corporation 163
2020 Form 10-K Notes to Consolidated Financial Statements
would otherwise have on the fair value of its fixed income securities. Fixed income index total return swaps are used to offset valuation losses in the fixed income portfolio during periods of declining market values. Credit default swaps are typically used to mitigate the credit risk within the Property-Liability fixed income portfolio. Equity index total return swaps, futures and options are used by Property-Liability to offset valuation losses in the equity portfolio during periods of declining equity market values. In addition, equity futures are used to hedge the market risk related to deferred compensation liability contracts. Forward contracts are primarily used by Property-Liability to hedge foreign currency risk associated with holding foreign currency denominated investments and foreign operations.
Asset-liability management is a risk management practice that is principally employed by Allstate Life and Allstate Annuities to balance the respective interest-rate sensitivities of its assets and liabilities. Depending upon the attributes of the assets acquired and liabilities issued, derivative instruments such as interest rate swaps, caps, swaptions and futures are utilized to change the interest rate characteristics of existing assets and liabilities to ensure the relationship is maintained within specified ranges and to reduce exposure to rising or falling interest rates. Fixed income index total return swaps are used to offset valuation losses in the portfolio during periods of declining market values. Credit default swaps are typically used to mitigate the credit risk within the Allstate Life and Allstate Annuities fixed income portfolios. Futures and options are used for hedging the equity exposure contained in equity indexed life and annuity product contracts that offer equity returns to contractholders. In addition, the Company uses equity index total return swaps, options and futures to offset valuation losses in the equity portfolio during periods of declining equity market values. Foreign currency swaps and forwards are primarily used to reduce the foreign currency risk associated with holding foreign currency denominated investments.
The Company also has derivatives embedded in non-derivative host contracts that are required to be separated from the host contracts and accounted for at fair value with changes in fair value of embedded derivatives reported in net income. The Company’s primary embedded derivatives are equity options in life and annuity product contracts, which provide returns linked to equity indices to contractholders.
When derivatives meet specific criteria, they may be designated as accounting hedges and accounted
for as fair value, cash flow, foreign currency fair value or foreign currency cash flow hedges. The Company designates certain investment risk transfer reinsurance agreements as fair value hedges when the hedging instrument is highly effective in offsetting the risk of changes in the fair value of the hedged item. The fair value of the hedged liability is reported in contractholder funds in the Consolidated Statements of Financial Position. The impact from results of the fair value hedge is reported in interest credited to contractholder funds in the Consolidated Statements of Operations.
The notional amounts specified in the contracts are used to calculate the exchange of contractual payments under the agreements and are generally not representative of the potential for gain or loss on these agreements. However, the notional amounts specified in credit default swaps where the Company has sold credit protection represent the maximum amount of potential loss, assuming no recoveries.
Fair value, which is equal to the carrying value, is the estimated amount that the Company would receive or pay to terminate the derivative contracts at the reporting date. The carrying value amounts for OTC derivatives are further adjusted for the effects, if any, of enforceable master netting agreements and are presented on a net basis, by counterparty agreement, in the Consolidated Statements of Financial Position.
For those derivatives which qualify and have been designated as fair value accounting hedges, net income includes the changes in the fair value of both the derivative instrument and the hedged risk. For cash flow hedges, gains and losses are amortized from AOCI and are reported in net income in the same period the forecasted transactions being hedged impact net income.
Non-hedge accounting is generally used for “portfolio” level hedging strategies where the terms of the individual hedged items do not meet the strict homogeneity requirements to permit the application of hedge accounting. For non-hedge derivatives, net income includes changes in fair value and accrued periodic settlements, when applicable. With the exception of non-hedge derivatives used for asset replication and non-hedge embedded derivatives, all of the Company’s derivatives are evaluated for their ongoing effectiveness as either accounting hedge or non-hedge derivative financial instruments on at least a quarterly basis.
Notes to Consolidated Financial Statements 2020 Form 10-K
| | | | | | | | | | | | | | | | | | | | | | | | | | | | | | | | | | | |
| Summary of the volume and fair value positions of derivative instruments as of December 31, 2020 |
| | | Volume (1) | | | | | | |
| ($ in millions, except number of contracts) | Balance sheet location | | Notional amount | | Number of contracts | | Fair value, net | | Gross asset | | Gross liability |
| Asset derivatives | | | | | | | | | | | |
| Derivatives designated as fair value accounting hedging instruments | | | | | | | | | | |
| Other | Other assets | | $ | 3 | | | n/a | | $ | — | | | $ | — | | | $ | — | |
| | | | | | | | | | | |
| Derivatives not designated as accounting hedging instruments | | | | | | | | | | |
| Interest rate contracts | | | | | | | | | | | |
| Interest rate cap agreements | Other investments | | 13 | | | n/a | | — | | | — | | | — | |
| | | | | | | | | | | |
| Futures | Other assets | | n/a | | 602 | | | — | | | — | | | — | |
| Equity and index contracts | | | | | | | | | | | |
| Options | Other investments | | n/a | | 2,887 | | | 190 | | | 190 | | | — | |
| Futures | Other assets | | n/a | | 951 | | | 1 | | | 1 | | | — | |
| Total return index contracts | | | | | | | | | | | |
| | | | | | | | | | | |
| Total return swap agreements - equity index | Other investments | | 8 | | | n/a | | 1 | | | 1 | | | — | |
| Foreign currency contracts | | | | | | | | | | | |
| Foreign currency forwards | Other investments | | 404 | | | n/a | | 5 | | | 13 | | | (8) | |
| Embedded derivative financial instruments | | | | | | | | | | | |
| Other embedded derivative financial instruments | Other investments | | 750 | | | n/a | | — | | | — | | | — | |
| Credit default contracts | | | | | | | | | | | |
| Credit default swaps – buying protection | Other investments | | 77 | | | n/a | | (4) | | | — | | | (4) | |
| Credit default swaps – selling protection | Other investments | | 754 | | | n/a | | 13 | | | 13 | | | — | |
| | | | | | | | | | | |
| | | | | | | | | | | |
| | | | | | | | | | | |
| Subtotal | | | 2,006 | | | 4,440 | | | 206 | | | 218 | | | (12) | |
| Total asset derivatives | | | $ | 2,009 | | | 4,440 | | | $ | 206 | | | $ | 218 | | | $ | (12) | |
| | | | | | | | | | | |
| Liability derivatives | | | | | | | | | | | |
| | | | | | | | | | |
| | | | | | | | | | | |
| Derivatives not designated as accounting hedging instruments | | | | | | | | | | |
| Interest rate contracts | | | | | | | | | | | |
| | | | | | | | | | | |
| Interest rate cap agreements | Other liabilities & accrued expenses | | $ | 19 | | | n/a | | $ | — | | | $ | — | | | $ | — | |
| | | | | | | | | | | |
| Futures | Other liabilities & accrued expenses | | n/a | | 730 | | | — | | | — | | | — | |
| Equity and index contracts | | | | | | | | | | | |
| Options | Other liabilities & accrued expenses | | n/a | | 2,712 | | | (110) | | | — | | | (110) | |
| Futures | Other liabilities & accrued expenses | | n/a | | 666 | | | — | | | — | | | — | |
| Total return index contracts | | | | | | | | | | | |
| Total return swap agreements - fixed income | Other liabilities & accrued expenses | | 50 | | | n/a | | — | | | — | | | — | |
| | | | | | | | | | | |
| Foreign currency contracts | | | | | | | | | | | |
| Foreign currency forwards | Other liabilities & accrued expenses | | 367 | | | n/a | | (13) | | | 2 | | | (15) | |
| Embedded derivative financial instruments | | | | | | | | | | |
| Guaranteed accumulation benefits | Contractholder funds | | 128 | | | n/a | | (18) | | | — | | | (18) | |
| Guaranteed withdrawal benefits | Contractholder funds | | 190 | | | n/a | | (15) | | | — | | | (15) | |
| Equity-indexed and forward starting options in life and annuity product contracts | Contractholder funds | | 1,785 | | | n/a | | (483) | | | — | | | (483) | |
| | | | | | | | | | | |
| Credit default contracts | | | | | | | | | | | |
| Credit default swaps – buying protection | Other liabilities & accrued expenses | | 638 | | | n/a | | (16) | | | — | | | (16) | |
| Credit default swaps – selling protection | Other liabilities & accrued expenses | | 5 | | | n/a | | — | | | — | | | — | |
| | | | | | | | | | | |
| Total liability derivatives | | | 3,182 | | | 4,108 | | | (655) | | | $ | 2 | | | $ | (657) | |
| Total derivatives | | | $ | 5,191 | | | 8,548 | | | $ | (449) | | | | | |
(1)Volume for OTC and cleared derivative contracts is represented by their notional amounts. Volume for exchange traded derivatives is represented by the number of contracts, which is the basis on which they are traded. (n/a = not applicable)
The Allstate Corporation 165
2020 Form 10-K Notes to Consolidated Financial Statements
| | | | | | | | | | | | | | | | | | | | | | | | | | | | | | | | | | | |
| Summary of the volume and fair value positions of derivative instruments as of December 31, 2019 |
| | | Volume | | | | | | |
| ($ in millions, except number of contracts) | Balance sheet location | | Notional amount | | Number of contracts | | Fair value, net | | Gross asset | | Gross liability |
| Asset derivatives | | | | | | | | | | | |
| Derivatives designated as fair value accounting hedging instruments | | | | | | | | | | |
| Other | Other assets | | $ | 2 | | | n/a | | $ | — | | | $ | — | | | $ | — | |
| | | | | | | | | | | |
| Derivatives not designated as accounting hedging instruments | | | | | | | | | | |
| Interest rate contracts | | | | | | | | | | | |
| | | | | | | | | | | |
| | | | | | | | | | | |
| Futures | Other assets | | n/a | | 3,668 | | | — | | | — | | | — | |
| Equity and index contracts | | | | | | | | | | | |
| Options | Other investments | | n/a | | 5,539 | | | 140 | | | 140 | | | — | |
| Futures | Other assets | | n/a | | 1,533 | | | 1 | | | 1 | | | — | |
| Total return index contracts | | | | | | | | | | | |
| | | | | | | | | | | |
| Total return swap agreements - fixed income | Other investments | | 56 | | | n/a | | 1 | | | 1 | | | — | |
| | | | | | | | | | | |
| | | | | | | | | | | |
| | | | | | | | | | | |
| | | | | | | | | | | |
| | | | | | | | | | | |
| Credit default contracts | | | | | | | | | | | |
| Credit default swaps – buying protection | Other investments | | 17 | | | n/a | | — | | | — | | | — | |
| | | | | | | | | | | |
| | | | | | | | | | | |
| | | | | | | | | | | |
| Subtotal | | | 73 | | | 10,740 | | | 142 | | | 142 | | | — | |
| Total asset derivatives | | | $ | 75 | | | 10,740 | | | $ | 142 | | | $ | 142 | | | $ | — | |
| | | | | | | | | | | |
| Liability derivatives | | | | | | | | | | | |
| | | | | | | | | | |
| | | | | | | | | | | |
| Derivatives not designated as accounting hedging instruments | | | | | | | | | | |
| Interest rate contracts | | | | | | | | | | | |
| | | | | | | | | | | |
| | | | | | | | | | | |
| Interest rate cap agreements | Other liabilities & accrued expenses | | $ | 34 | | | n/a | | $ | — | | | $ | — | | | $ | — | |
| Futures | Other liabilities & accrued expenses | | n/a | | 1,089 | | | — | | | — | | | — | |
| Equity and index contracts | | | | | | | | | | | |
| Options | Other liabilities & accrued expenses | | n/a | | 5,400 | | | (68) | | | — | | | (68) | |
| Futures | Other liabilities & accrued expenses | | n/a | | 3 | | | — | | | — | | | — | |
| Total return index contracts | | | | | | | | | | | |
Total return swap agreements - fixed income | Other liabilities & accrued expenses | | 119 | | | n/a | | — | | | — | | | — | |
Total return swap agreements - equity index | Other liabilities & accrued expenses | | 187 | | | n/a | | 11 | | | 11 | | | — | |
| Foreign currency contracts | | | | | | | | | | | |
| Foreign currency forwards | Other liabilities & accrued expenses | | 745 | | | n/a | | 19 | | | 28 | | | (9) | |
| Embedded derivative financial instruments | | | | | | | | | | |
| Guaranteed accumulation benefits | Contractholder funds | | 161 | | | n/a | | (18) | | | — | | | (18) | |
| Guaranteed withdrawal benefits | Contractholder funds | | 205 | | | n/a | | (14) | | | — | | | (14) | |
| Equity-indexed and forward starting options in life and annuity product contracts | Contractholder funds | | 1,791 | | | n/a | | (430) | | | — | | | (430) | |
| | | | | | | | | | | |
| Credit default contracts | | | | | | | | | | | |
| Credit default swaps – buying protection | Other liabilities & accrued expenses | | 152 | | | n/a | | (7) | | | — | | | (7) | |
| Credit default swaps – selling protection | Other liabilities & accrued expenses | | 9 | | | n/a | | — | | | — | | | — | |
| | | | | | | | | | | |
| Total liability derivatives | | | 3,403 | | | 6,492 | | | (507) | | | $ | 39 | | | $ | (546) | |
| Total derivatives | | | $ | 3,478 | | | 17,232 | | | $ | (365) | | | | | |
| | | | | | | | | | | | | | | | | | | | | | | | | | | | | | | | | | | | | | |
Gross and net amounts for OTC derivatives (1) |
| | | | Offsets | | | | | | |
| ($ in millions) | | Gross amount | | Counter- party netting | | Cash collateral (received) pledged | | Net amount on balance sheet | | Securities collateral (received) pledged | | Net amount |
| December 31, 2020 | | | | | | | | | | | | |
| Asset derivatives | | $ | 16 | | | $ | (14) | | | $ | (1) | | | $ | 1 | | | $ | — | | | $ | 1 | |
| Liability derivatives | | (28) | | | 14 | | | 13 | | | (1) | | | — | | | (1) | |
| | | | | | | | | | | | |
| December 31, 2019 | | | | | | | | | | | | |
| Asset derivatives | | $ | 40 | | | $ | (39) | | | $ | (1) | | | $ | — | | | $ | — | | | $ | — | |
| Liability derivatives | | (16) | | | 39 | | | (27) | | | (4) | | | — | | | (4) | |
(1)All OTC derivatives are subject to enforceable master netting agreements.
Notes to Consolidated Financial Statements 2020 Form 10-K
| | | | | | | | | | | | | | | | | | | | | | | | | | | | | | | | | | | |
| Gains (losses) from valuation and settlements reported on derivatives not designated as accounting hedges |
| ($ in millions) | | | Realized capital gains (losses) | | Life contract benefits | | Interest credited to contractholder funds | | Operating costs and expenses | | | | Total gain (loss) recognized in net income on derivatives |
| 2020 | | | | | | | | | | | | | |
| Interest rate contracts | | | $ | 40 | | | $ | — | | | $ | — | | | $ | — | | | | | $ | 40 | |
| Equity and index contracts | | | 21 | | | — | | | 22 | | | 29 | | | | | 72 | |
| Embedded derivative financial instruments | | | — | | | (1) | | | (53) | | | — | | | | | (54) | |
| Foreign currency contracts | | | (20) | | | — | | | — | | | — | | | | | (20) | |
| Credit default contracts | | | 7 | | | — | | | — | | | — | | | | | 7 | |
| Total return swaps - fixed income | | | 1 | | | — | | | — | | | — | | | | | 1 | |
| Total return swaps - equity index | | | 4 | | | — | | | — | | | — | | | | | 4 | |
| | | | | | | | | | | | | |
| Total | | | $ | 53 | | | $ | (1) | | | $ | (31) | | | $ | 29 | | | | | $ | 50 | |
| | | | | | | | | | | | | |
| 2019 | | | | | | | | | | | | | |
| Interest rate contracts | | | $ | 51 | | | $ | — | | | $ | — | | | $ | — | | | | | $ | 51 | |
| Equity and index contracts | | | (116) | | | — | | | 63 | | | 40 | | | | | (13) | |
| Embedded derivative financial instruments | | | — | | | 7 | | | (70) | | | — | | | | | (63) | |
| Foreign currency contracts | | | 8 | | | — | | | — | | | — | | | | | 8 | |
| Credit default contracts | | | (8) | | | — | | | — | | | — | | | | | (8) | |
| Total return swaps - fixed income | | | 14 | | | — | | | — | | | — | | | | | 14 | |
| Total return swaps - equity index | | | 36 | | | — | | | — | | | — | | | | | 36 | |
| | | | | | | | | | | | | |
| Total | | | $ | (15) | | | $ | 7 | | | $ | (7) | | | $ | 40 | | | | | $ | 25 | |
| | | | | | | | | | | | | | |
| 2018 | | | | | | | | | | | | | |
| Interest rate contracts | | | $ | (2) | | | $ | — | | | $ | — | | | $ | — | | | | | $ | (2) | |
| Equity and index contracts | | | 21 | | | — | | | (24) | | | (21) | | | | | (24) | |
| Embedded derivative financial instruments | | | — | | | (5) | | | 67 | | | — | | | | | 62 | |
| Foreign currency contracts | | | 29 | | | — | | | — | | | (1) | | | | | 28 | |
| Credit default contracts | | | 2 | | | — | | | — | | | — | | | | | 2 | |
| Total return swaps - fixed income | | | (1) | | | — | | | — | | | — | | | | | (1) | |
| Total return swaps - equity | | | (6) | | | — | | | — | | | — | | | | | (6) | |
| | | | | | | | | | | | | |
| Total | | | $ | 43 | | | $ | (5) | | | $ | 43 | | | $ | (22) | | | | | $ | 59 | |
The Company manages its exposure to credit risk by utilizing highly rated counterparties, establishing risk control limits, executing legally enforceable master netting agreements (“MNAs”) and obtaining collateral where appropriate. The Company uses MNAs for OTC derivative transactions that permit either party to net payments due for transactions and collateral is either pledged or obtained when certain predetermined exposure limits are exceeded. As of December 31, 2020, counterparties pledged $7 million in collateral to the Company, and the Company pledged $19 million in cash and securities to counterparties which includes $17 million of collateral posted under MNAs for contracts containing credit-risk contingent provisions that are in a liability position.
The Company has not incurred any losses on derivative financial instruments due to counterparty nonperformance. Other derivatives, including futures and certain option contracts, are traded on organized exchanges which require margin deposits and guarantee the execution of trades, thereby mitigating any potential credit risk.
Counterparty credit exposure represents the Company’s potential loss if all of the counterparties concurrently fail to perform under the contractual terms of the contracts and all collateral, if any, becomes worthless.
This exposure is measured by the fair value of OTC derivative contracts with a positive fair value at the reporting date reduced by the effect, if any, of legally enforceable master netting agreements.
The Allstate Corporation 167
2020 Form 10-K Notes to Consolidated Financial Statements
| | | | | | | | | | | | | | | | | | | | | | | | | | | | | | | | | | | | | | | | | | | | | | | | | | |
OTC derivatives counterparty credit exposure by counterparty credit rating |
| ($ in millions) | | 2020 | | 2019 |
Rating (1) | | Number of counter-parties | | Notional amount (2) | | Credit exposure (2) | | Exposure, net of collateral (2) | | Number of counter-parties | | Notional amount (2) | | Credit exposure (2) | | Exposure, net of collateral (2) |
| | | | | | | | | | | | | | | | |
| A+ | | 3 | | | $ | 280 | | | $ | 7 | | | $ | — | | | 6 | | | $ | 868 | | | $ | 29 | | | $ | — | |
| | | | | | | | | | | | | | | | |
| | | | | | | | | | | | | | | | |
| | | | | | | | | | | | | | | | |
| | | | | | | | | | | | | | | | |
| Total | | 3 | | | $ | 280 | | | $ | 7 | | | $ | — | | | 6 | | | $ | 868 | | | $ | 29 | | | $ | — | |
(1)Allstate uses the lower of S&P’s or Moody’s long-term debt issuer ratings.
(2)Only OTC derivatives with a net positive fair value are included for each counterparty.
For certain exchange traded and cleared derivatives, margin deposits are required as well as daily cash settlements of margin accounts. As of December 31, 2020, the Company pledged $60 million and received $12 million in the form of margin deposits.
Market risk is the risk that the Company will incur losses due to adverse changes in market rates and prices. Market risk exists for all of the derivative financial instruments the Company currently holds, as these instruments may become less valuable due to adverse changes in market conditions. To limit this risk, the Company’s senior management has established risk control limits. In addition, changes in fair value of the derivative financial instruments that the Company uses for risk management purposes are generally offset by the change in the fair value or cash flows of the hedged risk component of the related assets, liabilities or forecasted transactions.
Certain of the Company’s derivative transactions contain credit-risk-contingent termination events and cross-default provisions. Credit-risk-contingent termination events allow the counterparties to terminate the derivative agreement or a specific trade on certain dates if AIC’s financial strength credit ratings by Moody’s or S&P fall below a certain level. Credit-risk-contingent cross-default provisions allow the counterparties to terminate the derivative agreement if the Company defaults by pre-determined threshold amounts on certain debt instruments.
The following summarizes the fair value of derivative instruments with termination, cross-default or collateral credit-risk-contingent features that are in a liability position as of December 31, as well as the fair value of assets and collateral that are netted against the liability in accordance with provisions within legally enforceable MNAs.
| | | | | | | | | | | | | | |
|
| | |
| ($ in millions) | | 2020 | | 2019 |
| Gross liability fair value of contracts containing credit-risk-contingent features | | $ | 27 | | | $ | 16 | |
| Gross asset fair value of contracts containing credit-risk-contingent features and subject to MNAs | | (9) | | | (11) | |
| Collateral posted under MNAs for contracts containing credit-risk-contingent features | | (17) | | | (3) | |
| Maximum amount of additional exposure for contracts with credit-risk-contingent features if all features were triggered concurrently | | $ | 1 | | | $ | 2 | |
Credit derivatives - selling protection
A credit default swap (“CDS”) is a derivative instrument, representing an agreement between two parties to exchange the credit risk of a specified entity (or a group of entities), or an index based on the credit risk of a group of entities (all commonly referred to as the “reference entity” or a portfolio of “reference entities”), in return for a periodic premium.
In selling protection, CDS are used to replicate fixed income securities and to complement the cash market when credit exposure to certain issuers is not available or when the derivative alternative is less expensive than the cash market alternative. CDS typically have a five-year term.
Notes to Consolidated Financial Statements 2020 Form 10-K
| | | | | | | | | | | | | | | | | | | | | | | | | | | | | | | | | | | | | | | | | | | | |
| CDS notional amounts by credit rating and fair value of protection sold |
| | Notional amount | | |
| ($ in millions) | | AAA | | AA | | A | | BBB | | BB and lower | | Total | | Fair value |
| December 31, 2020 | | | | | | | | | | | | | | |
| Single name | | | | | | | | | | | | | | |
| Corporate debt | | $ | — | | | $ | — | | | $ | — | | | $ | — | | | $ | 9 | | | $ | 9 | | | $ | — | |
| Index | | | | | | | | | | | | | | |
| Corporate debt | | 6 | | | 12 | | | 156 | | | 492 | | | 84 | | | 750 | | | 13 | |
| Total | | $ | 6 | | | $ | 12 | | | $ | 156 | | | $ | 492 | | | $ | 93 | | | $ | 759 | | | $ | 13 | |
| | | | | | | | | | | | | | |
| December 31, 2019 | | | | | | | | | | | | | | |
| Single name | | | | | | | | | | | | | | |
| Corporate debt | | $ | — | | | $ | — | | | $ | — | | | $ | — | | | $ | 9 | | | $ | 9 | | | $ | — | |
| Total | | $ | — | | | $ | — | | | $ | — | | | $ | — | | | $ | 9 | | | $ | 9 | | | $ | — | |
In selling protection with CDS, the Company sells credit protection on an identified single name, a basket of names in a first-to-default (“FTD”) structure or credit derivative index (“CDX”) that is generally investment grade, and in return receives periodic premiums through expiration or termination of the agreement. With single name CDS, this premium or credit spread generally corresponds to the difference between the yield on the reference entity’s public fixed maturity cash instruments and swap rates at the time the agreement is executed. With a FTD basket, because of the additional credit risk inherent in a basket of named reference entities, the premium generally corresponds to a high proportion of the sum of the credit spreads of the names in the basket and the correlation between the names. CDX is utilized to take a position on multiple (generally 125) reference entities. Credit events are typically defined as bankruptcy, failure to pay, or restructuring, depending on the nature of the reference entities. If a credit event occurs, the Company settles with the counterparty, either through physical settlement or cash settlement. In a physical settlement, a reference asset is delivered by the buyer
of protection to the Company, in exchange for cash payment at par, whereas in a cash settlement, the Company pays the difference between par and the prescribed value of the reference asset. When a credit event occurs in a single name or FTD basket (for FTD, the first credit event occurring for any one name in the basket), the contract terminates at the time of settlement. For CDX, the reference entity’s name incurring the credit event is removed from the index while the contract continues until expiration. The maximum payout on a CDS is the contract notional amount. A physical settlement may afford the Company with recovery rights as the new owner of the asset.
The Company monitors risk associated with credit derivatives through individual name credit limits at both a credit derivative and a combined cash instrument/credit derivative level. The ratings of individual names for which protection has been sold are also monitored.
Off-balance sheet financial instruments
| | | | | | | | | | | | | | |
| Contractual amounts of off-balance sheet financial instruments |
| | As of December 31, |
| ($ in millions) | | 2020 | | 2019 |
| Commitments to invest in limited partnership interests | | $ | 2,933 | | | $ | 2,837 | |
| Private placement commitments | | 36 | | | 68 | |
| Other loan commitments | | 92 | | | 189 | |
| | | | |
In the preceding table, the contractual amounts represent the amount at risk if the contract is fully drawn upon, the counterparty defaults and the value of any underlying security becomes worthless. Unless noted otherwise, the Company does not require collateral or other security to support off-balance sheet financial instruments with credit risk.
Commitments to invest in limited partnership interests represent agreements to acquire new or additional participation in certain limited partnership investments. The Company enters into these agreements in the normal course of business. Because the investments in limited partnerships are not actively traded, it is not practical to estimate the fair value of these commitments.
Private placement commitments represent commitments to purchase private placement debt and private equity securities at a future date. The Company enters into these agreements in the normal course of business. The fair value of the debt commitments generally cannot be estimated on the date the commitment is made as the terms and conditions of the underlying private placement securities are not yet final. Because the private equity securities are not actively traded, it is not practical to estimate fair value of the commitments.
The Allstate Corporation 169
2020 Form 10-K Notes to Consolidated Financial Statements
Other loan commitments are agreements to lend to a borrower provided there is no violation of any condition established in the contract. The Company enters into these agreements to commit to future loan fundings at predetermined interest rates. Unless
unconditionally cancellable, the Company recognizes a credit loss allowance on such commitments. Commitments have either fixed or varying expiration dates or other termination clauses. The fair value of these commitments is insignificant.
| | | | | |
| Note 8 | Reserve for Property and Casualty Insurance Claims and Claims Expense |
The Company establishes reserves for claims and claims expense on reported and unreported claims of insured losses. The Company’s reserving process takes into account known facts and interpretations of circumstances and factors including the Company’s experience with similar cases, actual claims paid, historical trends involving claim payment patterns and pending levels of unpaid claims, loss management programs, product mix and contractual terms, changes in law and regulation, judicial decisions, and economic conditions.
When the Company experiences changes in the mix or type of claims or changing claim settlement patterns, it may need to apply actuarial judgment in the determination and selection of development factors to be more reflective of the new trends. For example, the Coronavirus has had a significant impact on driving patterns and auto frequency that may lead to historical development trends being less predictive of future loss development, potentially creating additional reserve variability. Generally, the initial reserves for a new accident year are established based on actual claim frequency and severity assumptions for different business segments, lines and coverages based on historical relationships to relevant inflation indicators. Reserves for prior accident years are statistically determined using several different actuarial estimation methods. Changes in auto claim frequency may result from changes in mix of business, the rate of distracted driving, miles driven or other macroeconomic factors. Changes in auto current year claim severity are generally influenced by inflation in the medical and auto repair sectors of the economy and the effectiveness and efficiency of claim practices. The Company mitigates these effects through various loss management programs. When such changes in claim data occur, actuarial judgment is used to determine appropriate development factors to establish reserves.
As part of the reserving process, the Company may also supplement its claims processes by utilizing third-party adjusters, appraisers, engineers, inspectors, and other professionals and information sources to assess and settle catastrophe and non-catastrophe related claims. The effects of inflation are implicitly considered in the reserving process.
Because reserves are estimates of unpaid portions of losses that have occurred, including incurred but not reported (“IBNR”) losses, the establishment of appropriate reserves, including reserves for catastrophes, Discontinued Lines and Coverages and reinsurance and indemnification recoverables, is an inherently uncertain and complex process. The ultimate cost of losses may vary materially from recorded amounts, which are based on management’s best estimates.
The highest degree of uncertainty is associated with reserves for losses incurred in the initial reporting period as it contains the greatest proportion of losses that have not been reported or settled. The Company also has uncertainty in the Discontinued Lines and Coverages reserves that are based on events long since passed and are complicated by lack of historical data, legal interpretations, unresolved legal issues and legislative intent based on establishment of facts.
The Company regularly updates its reserve estimates as new information becomes available and as events unfold that may affect the resolution of unsettled claims. Changes in prior year reserve estimates, which may be material, are reported in property and casualty insurance claims and claims expense in the Consolidated Statements of Operations in the period such changes are determined.
Notes to Consolidated Financial Statements 2020 Form 10-K
| | | | | | | | | | | | | | | | | | | | |
Rollforward of reserve for property and casualty insurance claims and claims expense |
| ($ in millions) | | 2020 | | 2019 | | 2018 |
| Balance as of January 1 | | $ | 27,712 | | | $ | 27,423 | | | $ | 26,325 | |
Less recoverables (1) | | (6,912) | | | (7,155) | | | (6,471) | |
| Net balance as of January 1 | | 20,800 | | | 20,268 | | | 19,854 | |
| Incurred claims and claims expense related to: | | | | | | |
| Current year | | 22,437 | | | 24,106 | | | 23,033 | |
| Prior years | | (436) | | | (130) | | | (255) | |
| Total incurred | | 22,001 | | | 23,976 | | | 22,778 | |
| Claims and claims expense paid related to: | | | | | | |
| Current year | | (14,245) | | | (15,160) | | | (14,877) | |
| Prior years | | (7,979) | | | (8,284) | | | (7,487) | |
| Total paid | | (22,224) | | | (23,444) | | | (22,364) | |
| Net balance as of December 31 | | 20,577 | | | 20,800 | | | 20,268 | |
| Plus recoverables | | 7,033 | | | 6,912 | | | 7,155 | |
| Balance as of December 31 | | $ | 27,610 | | | $ | 27,712 | | | $ | 27,423 | |
(1) Recoverables comprises reinsurance and indemnification recoverables. See Note 10 for further details.
| | | | | | | | | | | | | | |
| Reconciliation of total claims and claims expense incurred and paid by coverage |
| | December 31, 2020 |
| ($ in millions) | | Incurred | | Paid |
| Allstate Protection | | | | |
| Auto insurance - liability coverage | | $ | 7,629 | | | $ | (7,939) | |
| Auto insurance - physical damage coverage | | 4,817 | | | (4,716) | |
| Homeowners insurance | | 4,889 | | | (4,731) | |
| Total auto and homeowners insurance | | 17,335 | | | (17,386) | |
| Other personal lines | | 1,015 | | | (1,007) | |
| Commercial lines | | 585 | | | (463) | |
Protection Services | | 319 | | | (326) | |
| Discontinued Lines and Coverages | | 132 | | | (88) | |
| Unallocated loss adjustment expenses (“ULAE”) | | 2,681 | | | (2,590) | |
| Claims incurred and paid from before 2016 | | (32) | | | (423) | |
| Other | | (34) | | | 59 | |
| Total | | $ | 22,001 | | | $ | (22,224) | |
Incurred claims and claims expense represents the sum of paid losses, claim adjustment expenses and reserve changes in the calendar year. This expense includes losses from catastrophes of $2.81 billion, $2.56 billion and $2.86 billion in 2020, 2019 and 2018, respectively, net of recoverables. Catastrophes are an inherent risk of the property and casualty insurance business that have contributed to, and will continue to contribute to, material year-to-year fluctuations in the Company’s results of operations and financial position.
The Company calculates and records a single best reserve estimate for losses from catastrophes, in conformance with generally accepted actuarial standards. As a result, management believes that no other estimate is better than the recorded amount. Due to the uncertainties involved, including the factors described above, the ultimate cost of losses may vary materially from recorded amounts, which are based on management’s best estimates. Accordingly, management believes that it is not practical to develop a meaningful range for any such changes in losses incurred.
The Allstate Corporation 171
2020 Form 10-K Financial Statements
| | | | | | | | | | | | | | | | | | | | | | | | | | | | | | | | | | | | | | | | | | | | | | | | | | | | | | | | |
Prior year reserve reestimates included in claims and claims expense (1) |
| | Twelve months ended December 31, |
| ($ in millions) | | Non-catastrophe losses | | Catastrophe losses | | Total |
| | 2020 | | 2019 | | 2018 | | 2020 | | 2019 | | 2018 | | 2020 | | 2019 | | 2018 |
| Auto | | $ | (63) | | | $ | (306) | | | $ | (416) | | | $ | (44) | | | $ | (17) | | | $ | (39) | | | $ | (107) | | | $ | (323) | | | $ | (455) | |
| Homeowners | | (17) | | | (1) | | | (51) | | | (422) | | | 66 | | | 65 | | | (439) | | | 65 | | | 14 | |
| Other personal lines | | (27) | | | 8 | | | (6) | | | (39) | | | — | | | (1) | | | (66) | | | 8 | | | (7) | |
| Commercial lines | | 34 | | | 18 | | | 108 | | | 2 | | | (1) | | | — | | | 36 | | | 17 | | | 108 | |
Discontinued Lines and Coverages (2) | | 141 | | | 105 | | | 87 | | | — | | | — | | | — | | | 141 | | | 105 | | | 87 | |
Protection Services | | (1) | | | (2) | | | (2) | | | — | | | — | | | — | | | (1) | | | (2) | | | (2) | |
| Total prior year reserve reestimates | | $ | 67 | | | $ | (178) | | | $ | (280) | | | $ | (503) | | | $ | 48 | | | $ | 25 | | | $ | (436) | | | $ | (130) | | | $ | (255) | |
(1)Favorable reserve reestimates are shown in parentheses.
(2)The Company’s 2020 annual reserve review, using established industry and actuarial best practices, resulted in unfavorable reestimates of $132 million.
In the third quarter of 2020, the Company recognized favorable prior year catastrophe reserve reestimates of approximately $495 million, net of expenses and adjustments to reinsurance, related to two subrogation settlements, which is reflected as a reduction of claims and claims expense in the Consolidated Statements of Operations.
PG&E settlement On June 20, 2020, the United States Bankruptcy Court for the Northern District of California confirmed PG&E Corporation’s and Pacific Gas and Electric Company’s (together, "PG&E") Chapter 11 Plan of Reorganization. The Plan of Reorganization included an agreement to resolve insurance subrogation claims arising from the 2017 Northern California wildfires and the 2018 Camp Fire for $11 billion. Allstate was party to the agreement.
On July 1, 2020, PG&E emerged from Chapter 11 and funded the subrogation trust from which distributions will be made to the insurers. Insurers have five years from the effective date of the Plan of Reorganization to submit proof of paid losses to the trust prior to the final distribution.
Allstate recognized a favorable impact of approximately $450 million. To date, the Company has received distributions from the trust representing approximately 80% of the expected recovery.
Southern California Edison settlement On September 14, 2020, Southern California Edison reached a $1.16 billion settlement agreement with insurance companies, resolving all insurance subrogation claims arising from the December 2017 Thomas and Koenigstein Wildfires and January 2018 Montecito Mudslides litigation. Allstate was party to the agreement and recognized a favorable impact of approximately $45 million. The Company has received substantially all distributions from the trust for its expected recovery.
Subsequent event On January 22, 2021, Southern California Edison reached a $2.20 billion settlement agreement with insurance companies, resolving subrogation claims arising from the Woolsey wildfire. Allstate is party to the agreement and expects to recognize a favorable impact of approximately $110 million in the first quarter of 2021.
Notes to Consolidated Financial Statements 2020 Form 10-K
The following presents information about incurred and paid claims development as of December 31, 2020, net of recoverables, as well as the cumulative number of reported claims and the total of IBNR reserves plus expected development on reported claims included in the net incurred claims amounts. See Note 2 for the accounting policy and methodology for determining reserves for claims and claims expense, including both reported and IBNR claims. The cumulative number of reported claims is identified by coverage and excludes reported claims for industry pools and facilities where information is not available. The information about incurred and paid claims development for the 2016 to 2020 years, and the average annual percentage payout of incurred claims by age as of December 31, 2020, is presented as required supplementary information.
Auto insurance – liability coverage
| | | | | | | | | | | | | | | | | | | | | | | | | | | | | | | | | | | | | | | | | | | | | | | | | | |
| ($ in millions, except number of reported claims) | | Incurred claims and allocated claim adjustment expenses, net of recoverables | | | | IBNR reserves plus expected development on reported claims | | Cumulative number of reported claims |
| | For the years ended December 31, | | Prior year reserve reestimates | | As of December 31, 2020 |
| | (unaudited) | | (unaudited) | | (unaudited) | | (unaudited) | | | | |
| Accident year | | 2016 | | 2017 | | 2018 | | 2019 | | 2020 | | |
| 2016 | | $ | 9,038 | | | $ | 8,841 | | | $ | 8,740 | | | $ | 8,690 | | | $ | 8,709 | | | $ | 19 | | | $ | 554 | | | 2,400,904 | |
| 2017 | | — | | | 8,465 | | | 8,396 | | | 8,312 | | | 8,330 | | | 18 | | | 1,017 | | | 2,217,132 | |
| 2018 | | — | | | — | | | 8,734 | | | 8,715 | | | 8,731 | | | 16 | | | 1,846 | | | 2,180,275 | |
| 2019 | | — | | | — | | | — | | | 9,341 | | | 9,295 | | | (46) | | | 3,064 | | | 2,205,813 | |
| 2020 | | — | | | — | | | — | | | — | | | 7,622 | | | | | 4,919 | | | 1,500,921 | |
| | | | | | | | Total | | $ | 42,687 | | | $ | 7 | | | | | |
| Reconciliation to total prior year reserve reestimates recognized by line | | | | | | |
Prior year reserve reestimates for pre-2016 accident years | | (20) | | | | | |
| Prior year reserve reestimates for ULAE | | 23 | | | | | |
| Other | | (3) | | | | | |
| Total prior year reserve reestimates | | $ | 7 | | | | | |
| | | | | | | | | | | | | | | | |
| | Cumulative paid claims and allocated claims adjustment expenses, net of recoverables | | | | | | |
| | For the years ended December 31, | | | | | | |
| | (unaudited) | | (unaudited) | | (unaudited) | | (unaudited) | | | | | | | | |
| Accident year | | 2016 | | 2017 | | 2018 | | 2019 | | 2020 | | | | | | |
| 2016 | | $ | 3,487 | | | $ | 5,772 | | | $ | 6,853 | | | $ | 7,700 | | | $ | 8,155 | | | | | | | |
| 2017 | | — | | | 3,151 | | | 5,333 | | | 6,532 | | | 7,313 | | | | | | | |
| 2018 | | — | | | — | | | 3,231 | | | 5,618 | | | 6,885 | | | | | | | |
| 2019 | | — | | | — | | | — | | | 3,498 | | | 6,231 | | | | | | | |
| 2020 | | — | | | — | | | — | | | — | | | 2,703 | | | | | | | |
| | | | | | | | Total | | $ | 31,287 | | | | | | | |
All outstanding liabilities before 2016, net of recoverables | | 1,389 | | | | | | | |
| Liabilities for claims and claim adjustment expenses, net of recoverables | | $ | 12,789 | | | | | | | |
| | | | | | | | | | | | | | | | | | | | | | | | | | | | | | | | |
Average annual percentage payout of incurred claims by age, net of recoverables, as of December 31, 2020 |
| | 1 year | | 2 years | | 3 years | | 4 years | | 5 years |
Auto insurance – liability coverage | | 39.4 | % | | 27.5 | % | | 13.1 | % | | 8.4 | % | | 4.9 | % |
The Allstate Corporation 173
2020 Form 10-K Financial Statements
Auto insurance – physical damage coverage
| | | | | | | | | | | | | | | | | | | | | | | | | | | | | | | | | | | | | | | | | | | | | | | | | | |
| ($ in millions, except number of reported claims) | | Incurred claims and allocated claim adjustment expenses, net of recoverables | | | | IBNR reserves plus expected development on reported claims | | Cumulative number of reported claims |
| | For the years ended December 31, | | Prior year reserve reestimates | | As of December 31, 2020 |
| | (unaudited) | | (unaudited) | | (unaudited) | | (unaudited) | | | | |
| Accident year | | 2016 | | 2017 | | 2018 | | 2019 | | 2020 | | |
| 2016 | | $ | 5,128 | | | $ | 5,054 | | | $ | 5,027 | | | $ | 5,023 | | | $ | 5,022 | | | $ | (1) | | | $ | 5 | | | 4,432,048 | |
| 2017 | | — | | | 5,121 | | | 5,039 | | | 5,028 | | | 5,027 | | | (1) | | | 1 | | | 4,237,772 | |
| 2018 | | — | | | — | | | 5,219 | | | 5,157 | | | 5,108 | | | (49) | | | 9 | | | 4,310,750 | |
| 2019 | | — | | | — | | | — | | | 5,662 | | | 5,606 | | | (56) | | | 26 | | | 4,469,473 | |
| 2020 | | — | | | — | | | — | | | — | | | 4,924 | | | | | 324 | | | 3,493,530 | |
| | | | | | | | Total | | $ | 25,687 | | | $ | (107) | | | | | |
| Reconciliation to total prior year reserve reestimates recognized by line | | | | | | |
Prior year reserve reestimates for pre-2016 accident years | | (1) | | | | | |
| Prior year reserve reestimates for ULAE | | (5) | | | | | |
| Other | | (1) | | | | | |
| Total prior year reserve reestimates | | $ | (114) | | | | | |
| | | | | | | | | | | | | | | | |
| | Cumulative paid claims and allocated claims adjustment expenses, net of recoverables | | | | | | |
| | For the years ended December 31, | | | | | | |
| | (unaudited) | | (unaudited) | | (unaudited) | | (unaudited) | | | | | | | | |
| Accident year | | 2016 | | 2017 | | 2018 | | 2019 | | 2020 | | | | | | |
| 2016 | | $ | 4,890 | | | $ | 5,033 | | | $ | 5,022 | | | $ | 5,018 | | | $ | 5,017 | | | | | | | |
| 2017 | | — | | | 4,847 | | | 5,039 | | | 5,030 | | | 5,026 | | | | | | | |
| 2018 | | — | | | — | | | 4,971 | | | 5,140 | | | 5,099 | | | | | | | |
| 2019 | | — | | | — | | | — | | | 5,418 | | | 5,580 | | | | | | | |
| 2020 | | — | | | — | | | — | | | — | | | 4,600 | | | | | | | |
| | | | | | | | Total | | $ | 25,322 | | | | | | | |
All outstanding liabilities before 2016, net of recoverables | | 8 | | | | | | | |
| Liabilities for claims and claim adjustment expenses, net of recoverables | | $ | 373 | | | | | | | |
| | | | | | | | | | | | | | | | | | | | | | | | | | | | | | | | |
Average annual percentage payout of incurred claims by age, net of recoverables, as of December 31, 2020 |
| | 1 year | | 2 years | | 3 years | | 4 years | | 5 years |
Auto insurance – physical damage coverage | | 96.9 | % | | 3.0 | % | | (0.3) | % | | (0.1) | % | | — | % |
Notes to Consolidated Financial Statements 2020 Form 10-K
Homeowners insurance
| | | | | | | | | | | | | | | | | | | | | | | | | | | | | | | | | | | | | | | | | | | | | | | | | | |
| ($ in millions, except number of reported claims) | | Incurred claims and allocated claim adjustment expenses, net of recoverables | | | | IBNR reserves plus expected development on reported claims | | Cumulative number of reported claims |
| | For the years ended December 31, | | Prior year reserve reestimates | | As of December 31, 2020 |
| | (unaudited) | | (unaudited) | | (unaudited) | | (unaudited) | | | | |
| Accident year | | 2016 | | 2017 | | 2018 | | 2019 | | 2020 | | |
| 2016 | | $ | 3,961 | | | $ | 3,995 | | | $ | 3,958 | | | $ | 3,953 | | | $ | 3,948 | | | $ | (5) | | | $ | 43 | | | 814,026 | |
| 2017 | | — | | | 4,477 | | | 4,619 | | | 4,614 | | | 4,390 | | | (224) | | | 61 | | | 908,714 | |
| 2018 | | — | | | — | | | 4,749 | | | 4,854 | | | 4,551 | | | (303) | | | 182 | | | 811,046 | |
| 2019 | | — | | | — | | | — | | | 4,549 | | | 4,601 | | | 52 | | | 301 | | | 784,257 | |
| 2020 | | — | | | — | | | — | | | — | | | 5,369 | | | | | 1,398 | | | 838,829 | |
| | | | | | | | Total | | $ | 22,859 | | | $ | (480) | | | | | |
| Reconciliation to total prior year reserve reestimates recognized by line | | | | | | |
Prior year reserve reestimates for pre-2016 accident years | | (11) | | | | | |
| Prior year reserve reestimates for ULAE | | 52 | | | | | |
| Other | | — | | | | | |
| Total prior year reserve reestimates | | $ | (439) | | | | | |
| | | | | | | | | | | | | | | | |
| | Cumulative paid claims and allocated claims adjustment expenses, net of recoverables | | | | | | |
| | For the years ended December 31, | | | | | | |
| | (unaudited) | | (unaudited) | | (unaudited) | | (unaudited) | | | | | | | | |
| Accident year | | 2016 | | 2017 | | 2018 | | 2019 | | 2020 | | | | | | |
| 2016 | | $ | 2,949 | | | $ | 3,680 | | | $ | 3,811 | | | $ | 3,876 | | | $ | 3,905 | | | | | | | |
| 2017 | | — | | | 3,228 | | | 4,249 | | | 4,437 | | | 4,329 | | | | | | | |
| 2018 | | — | | | — | | | 3,491 | | | 4,514 | | | 4,369 | | | | | | | |
| 2019 | | — | | | — | | | — | | | 3,316 | | | 4,300 | | | | | | | |
| 2020 | | — | | | — | | | — | | | — | | | 3,971 | | | | | | | |
| | | | | | | | Total | | $ | 20,874 | | | | | | | |
All outstanding liabilities before 2016, net of recoverables | | 119 | | | | | | | |
| Liabilities for claims and claim adjustment expenses, net of recoverables | | $ | 2,104 | | | | | | | |
| | | | | | | | | | | | | | | | | | | | | | | | | | | | | | | | |
Average annual percentage payout of incurred claims by age, net of recoverables, as of December 31, 2020 |
| | 1 year | | 2 years | | 3 years | | 4 years | | 5 years |
| Homeowners insurance | | 75.2 | % | | 19.4 | % | | 2.5 | % | | 0.9 | % | | 0.7 | % |
The Allstate Corporation 175
2020 Form 10-K Financial Statements
| | | | | | | | |
Reconciliation of the net incurred and paid claims development tables above to the reserve for property and casualty insurance claims and claims expense |
| ($ in millions) | | As of December 31, 2020 |
| Net outstanding liabilities | | |
| Allstate Protection | | |
| Auto insurance - liability coverage | | $ | 12,789 | |
| Auto insurance - physical damage coverage | | 373 | |
| Homeowners insurance | | 2,104 | |
| Other personal lines | | 1,335 | |
| Commercial lines | | 1,132 | |
Protection Services | | 30 | |
Discontinued Lines and Coverages (1) | | 1,330 | |
| ULAE | | 1,484 | |
| Net reserve for property and casualty insurance claims and claims expense | | 20,577 | |
| | |
| Recoverables | | |
| Allstate Protection | | |
| Auto insurance - liability coverage | | 5,979 | |
| Auto insurance - physical damage coverage | | 4 | |
| Homeowners insurance | | 171 | |
| Other personal lines | | 153 | |
| Commercial lines | | 196 | |
Protection Services | | 10 | |
| Discontinued Lines and Coverages | | 479 | |
| ULAE | | 41 | |
| Total recoverables | | 7,033 | |
| Gross reserve for property and casualty insurance claims and claims expense | | $ | 27,610 | |
(1)Discontinued Lines and Coverages includes business in run-off with most of the claims related to accident years more than 30 years ago. IBNR reserves represent $695 million of the total reserves as of December 31, 2020.
Management believes that the reserve for property and casualty insurance claims and claims expense, net of recoverables, is appropriately established in the aggregate and adequate to cover the ultimate net cost of reported and unreported claims arising from losses which had occurred by the date of the Consolidated Statements of Financial Position based on available facts, technology, laws and regulations.
| | | | | | | | | | | | | | |
| Reserves for asbestos, environmental and other discontinued lines claims before and after the effects of reinsurance |
| ($ in millions) | | December 31, 2020 | | December 31, 2019 |
Asbestos claims (1) | | | | |
| Gross reserves | | $ | 1,204 | | | $ | 1,172 | |
| Reinsurance | | (377) | | | (362) | |
| Net reserves | | 827 | | | 810 | |
Environmental claims (1) | | | | |
| Gross reserves | | 249 | | | 219 | |
| Reinsurance | | (43) | | | (40) | |
| Net reserves | | 206 | | | 179 | |
| Other discontinued lines | | | | |
| Gross reserves | | 435 | | | 427 | |
| Reinsurance | | (60) | | | (51) | |
| Net reserves | | 375 | | | 376 | |
| Total | | | | |
Gross reserves | | 1,888 | | | 1,818 | |
Reinsurance | | (480) | | | (453) | |
| Net reserves | | $ | 1,408 | | | $ | 1,365 | |
(1) For further discussion of asbestos and environmental reserves, see Note 14.
Notes to Consolidated Financial Statements 2020 Form 10-K
| | | | | |
| Note 9 | Reserve for Life-Contingent Contract Benefits and Contractholder Funds |
| | | | | | | | | | | | | | |
Reserve for life-contingent contract benefits |
| | As of December 31, |
| ($ in millions) | | 2020 | | 2019 |
| Immediate fixed annuities: | | | | |
| Structured settlement annuities | | $ | 7,407 | | | $ | 6,840 | |
| Other immediate fixed annuities | | 1,511 | | | 1,612 | |
| Traditional life insurance | | 2,942 | | | 2,897 | |
| Accident and health insurance | | 841 | | | 873 | |
| Other | | 67 | | | 78 | |
| Total reserve for life-contingent contract benefits | | $ | 12,768 | | | $ | 12,300 | |
| | | | | | | | | | | | | | | | | | | | |
Key assumptions generally used in calculating the reserve for life-contingent contract benefits |
| Product | | Mortality | | Interest rate | | Estimation method |
| Structured settlement annuities | | Actual company experience with projected calendar year improvements | | 4.7% | | Present value of contractually specified future benefits and expenses |
| Other immediate fixed annuities | | Actual company experience with projected calendar year improvements | | 4.7% | | Present value of expected future benefits and expenses |
Traditional life insurance | | Actual company experience plus loading | | Interest rate assumptions range from 2.5% to 11.3% | | Net level premium reserve method using the Company’s withdrawal experience rates; includes reserves for unpaid claims |
| Accident and health insurance | | Actual company experience plus loading | | Interest rate assumptions range from 3.0% to 7.0% | | Unearned premium; additional contract reserves for mortality risk and unpaid claims |
Other: Variable annuity guaranteed minimum death benefits (1) | | Annuity 2012 mortality table with internal modifications | | Interest rate assumptions range from 1.4% to 5.8% | | Projected benefit ratio applied to cumulative assessments |
(1)In 2006, the Company disposed of substantially all of its variable annuity business through reinsurance agreements with The Prudential Insurance Company of America, a subsidiary of Prudential Financial, Inc. (collectively “Prudential”).
In the third quarter of 2020, the premium deficiency evaluation of the Company’s immediate annuities with life contingencies resulted in a premium deficiency reserve of $225 million, pre-tax. The long-term investment yield assumption was lowered, which resulted in the prior sufficiency changing to a deficiency. The deficiency was recognized as an increase in the reserve for life contingent contract benefits. The original assumptions used to establish reserves were updated to reflect current assumptions, and the primary changes included mortality expectations, where annuitants are living longer than originally anticipated, and long-term investment yields. In 2019, the Company’s reviews concluded that no premium deficiency adjustments were necessary.
The Company records an adjustment to the reserve for life-contingent contract benefits that represents the amount by which the reserve balance would increase if the net unrealized gains in the applicable product investment portfolios were realized and reinvested at current lower interest rates, resulting in a premium deficiency. The offset to this liability is recorded as a reduction of the unrealized net capital gains included in AOCI. This liability was $496 million and $126 million as of December 31, 2020 and 2019, respectively.
| | | | | | | | | | | | | | |
Contractholder funds |
| | As of December 31, |
| ($ in millions) | | 2020 | | 2019 |
| Interest-sensitive life insurance | | $ | 8,493 | | | $ | 8,384 | |
| Investment contracts: | | | | |
| Fixed annuities | | 8,196 | | | 8,845 | |
| | | | |
| Other investment contracts | | 524 | | | 463 | |
| Total contractholder funds | | $ | 17,213 | | | $ | 17,692 | |
The Allstate Corporation 177
2020 Form 10-K Notes to Consolidated Financial Statements
| | | | | | | | | | | | | | |
Key contract provisions of contractholder funds |
| Product | | Interest rate | | Withdrawal/surrender charges |
| Interest-sensitive life insurance | | Interest rates credited range from 0.0% to 9.0% for equity-indexed life (whose returns are indexed to the S&P 500) and 1.0% to 6.0% for all other products | | Either a percentage of account balance or dollar amount grading off generally over 20 years |
| Fixed annuities | | Interest rates credited range from 0.5% to 7.5% for immediate annuities; (8.0)% to 9.0% for equity-indexed annuities (whose returns are indexed to the S&P 500); and 0.1% to 5.0% for all other products | | Either a declining or a level percentage charge generally over ten years or less. Additionally, approximately 11.0% of fixed annuities are subject to market value adjustment for discretionary withdrawals |
| | | | |
Other investment contracts: Guaranteed minimum income, accumulation and withdrawal benefits on variable (1) and fixed annuities and secondary guarantees on interest-sensitive life insurance and fixed annuities | | Interest rates used in establishing reserves range from 1.7% to 10.3% | | Withdrawal and surrender charges are based on the terms of the related interest-sensitive life insurance or fixed annuity contract |
(1)In 2006, the Company disposed of substantially all of its variable annuity business through reinsurance agreements with Prudential.
| | | | | | | | | | | | | | | | | | | | |
Contractholder funds activity |
| | For the years ended December 31, |
| ($ in millions) | | 2020 | | 2019 | | 2018 |
| Balance, beginning of year | | $ | 17,692 | | | $ | 18,371 | | | $ | 19,434 | |
| | | | | | |
| | | | | | |
| Deposits | | 1,062 | | | 1,091 | | | 1,109 | |
| Interest credited | | 633 | | | 636 | | | 650 | |
| Benefits | | (775) | | | (791) | | | (844) | |
| Surrenders and partial withdrawals | | (728) | | | (884) | | | (1,135) | |
| | | | | | |
| Contract charges | | (836) | | | (825) | | | (824) | |
| Net transfers from separate accounts | | 5 | | | 10 | | | 6 | |
| Other adjustments | | 160 | | | 84 | | | (25) | |
| | | | | | |
| | | | | | |
| Balance, end of year | | $ | 17,213 | | | $ | 17,692 | | | $ | 18,371 | |
The Company offered various guarantees to variable annuity contractholders. In 2006, the Company disposed of substantially all of its variable annuity business through reinsurance agreements with Prudential. Liabilities for variable contract guarantees related to death benefits are included in the reserve for life-contingent contract benefits and the liabilities related to the income, withdrawal and accumulation benefits are included in contractholder funds. All liabilities for variable contract guarantees are reported on a gross basis on the balance sheet with a corresponding reinsurance recoverable asset for those contracts subject to reinsurance.
Absent any contract provision wherein the Company guarantees either a minimum return or account value upon death, a specified contract anniversary date, partial withdrawal or annuitization, variable annuity and variable life insurance contractholders bear the investment risk that the separate accounts’ funds may not meet their stated investment objectives. The account balances of variable annuity contracts’ separate accounts with guarantees included $2.96 billion and $2.68 billion of equity, fixed income and balanced mutual funds and $238 million and $253 million of money market mutual funds as of December 31, 2020 and 2019, respectively.
Notes to Consolidated Financial Statements 2020 Form 10-K
The table below presents information regarding the Company’s variable annuity contracts with guarantees. The Company’s variable annuity contracts may offer more than one type of guarantee in each contract; therefore, the sum of amounts listed exceeds the total account balances of variable annuity contracts’ separate accounts with guarantees.
| | | | | | | | | | | | | | |
| ($ in millions) | | As of December 31, |
| | 2020 | | 2019 |
| In the event of death | | | | |
| Separate account value | | $ | 3,197 | | | $ | 2,928 | |
Net amount at risk (1) | | $ | 308 | | | $ | 373 | |
| Average attained age of contractholders | | 72 years | | 71 years |
| At annuitization (includes income benefit guarantees) | | | | |
| Separate account value | | $ | 925 | | | $ | 848 | |
Net amount at risk (2) | | $ | 140 | | | $ | 173 | |
| Weighted average waiting period until annuitization options available | | None | | None |
| For cumulative periodic withdrawals | | | | |
| Separate account value | | $ | 178 | | | $ | 190 | |
Net amount at risk (3) | | $ | 12 | | | $ | 13 | |
| Accumulation at specified dates | | | | |
| Separate account value | | $ | 93 | | | $ | 123 | |
Net amount at risk (4) | | $ | 11 | | | $ | 15 | |
| Weighted average waiting period until guarantee date | | 3 years | | 4 years |
(1)Defined as the estimated current guaranteed minimum death benefit in excess of the current account balance as of the balance sheet date.
(2)Defined as the estimated present value of the guaranteed minimum annuity payments in excess of the current account balance.
(3)Defined as the estimated current guaranteed minimum withdrawal balance (initial deposit) in excess of the current account balance as of the balance sheet date.
(4)Defined as the estimated present value of the guaranteed minimum accumulation balance in excess of the current account balance.
The liability for death and income benefit guarantees is equal to a benefit ratio multiplied by the cumulative contract charges earned, plus accrued interest less contract excess guarantee benefit payments. The benefit ratio is calculated as the estimated present value of all expected contract excess guarantee benefits divided by the present value of all expected contract charges. The establishment of reserves for these guarantees requires the projection of future fund values, mortality, persistency and customer benefit utilization rates. These assumptions are periodically reviewed and updated. For guarantees related to death benefits, benefits represent the projected excess guaranteed minimum death benefit payments. For guarantees related to income benefits, benefits represent the present value of the minimum guaranteed annuitization benefits in excess of the projected account balance at the time of annuitization.
Projected benefits and contract charges used in determining the liability for certain guarantees are developed using models and stochastic scenarios that are also used in the development of estimated expected gross profits. Underlying assumptions for the liability related to income benefits include assumed future annuitization elections based on factors such as the extent of benefit to the potential annuitant, eligibility conditions and the annuitant’s attained age. The liability for guarantees is re-evaluated periodically, and adjustments are made to the liability balance through a charge or credit to life and annuity contract benefits.
Guarantees related to the majority of withdrawal and accumulation benefits are considered to be derivative financial instruments; therefore, the liability for these benefits is established based on its fair value.
The Allstate Corporation 179
2020 Form 10-K Notes to Consolidated Financial Statements
| | | | | | | | | | | | | | | | | | | | | | | | | | |
Summary of liabilities for guarantees |
| ($ in millions) | | Liability for guarantees related to death benefits and interest-sensitive life products | | Liability for guarantees related to income benefits | | Liability for guarantees related to accumulation and withdrawal benefits | | Total |
Balance, December 31, 2019 | | $ | 293 | | | $ | 24 | | | $ | 102 | | | $ | 419 | |
| Less reinsurance recoverables | | 81 | | | 20 | | | 32 | | | 133 | |
Net balance as of December 31, 2019 | | 212 | | | 4 | | | 70 | | | 286 | |
| Incurred guarantee benefits | | 50 | | | — | | | 18 | | | 68 | |
| Paid guarantee benefits | | (2) | | | — | | | — | | | (2) | |
| Net change | | 48 | | | — | | | 18 | | | 66 | |
Net balance as of December 31, 2020 | | 260 | | | 4 | | | 88 | | | 352 | |
| Plus reinsurance recoverables | | 69 | | | 23 | | | 33 | | | 125 | |
Balance, December 31, 2020 | | $ | 329 | | | $ | 27 | | | $ | 121 | | | $ | 477 | |
| | | | | | | | |
Balance, December 31, 2018 | | $ | 308 | | | $ | 39 | | | $ | 97 | | | $ | 444 | |
| Less reinsurance recoverables | | 111 | | | 35 | | | 39 | | | 185 | |
Net balance as of December 31, 2018 | | 197 | | | 4 | | | 58 | | | 259 | |
| Incurred guarantee benefits | | 18 | | | — | | | 12 | | | 30 | |
| Paid guarantee benefits | | (3) | | | — | | | — | | | (3) | |
| Net change | | 15 | | | — | | | 12 | | | 27 | |
Net balance as of December 31, 2019 | | 212 | | | 4 | | | 70 | | | 286 | |
| Plus reinsurance recoverables | | 81 | | | 20 | | | 32 | | | 133 | |
Balance, December 31, 2019 | | $ | 293 | | | $ | 24 | | | $ | 102 | | | $ | 419 | |
| | | | | | | | | | | | | | | | | | | | |
Reserves included in total liability balance for guarantees, as of December 31, by type of benefit |
| ($ in millions) | | 2020 | | 2019 | | 2018 |
| Variable annuity | | | | | | |
| Death benefits | | $ | 67 | | | $ | 78 | | | $ | 109 | |
| Income benefits | | 24 | | | 21 | | | 36 | |
| Accumulation benefits | | 18 | | | 18 | | | 25 | |
| Withdrawal benefits | | 15 | | | 14 | | | 14 | |
| Other guarantees | | 353 | | | 288 | | | 260 | |
| Total | | $ | 477 | | | $ | 419 | | | $ | 444 | |
Notes to Consolidated Financial Statements 2020 Form 10-K
| | | | | |
| Note 10 | Reinsurance and Indemnification |
| | | | | | | | | | | | | | | | | | | | |
| Effects of reinsurance and indemnification on property and casualty premiums written and earned and life premiums and contract charges |
| | For the years ended December 31, |
| ($ in millions) | | 2020 | | 2019 | | 2018 |
| Property and casualty insurance premiums written | | | | | | |
| Direct | | $ | 38,695 | | | $ | 37,976 | | | $ | 35,895 | |
| Assumed | | 105 | | | 95 | | | 99 | |
| Ceded | | (1,142) | | | (1,117) | | | (1,008) | |
| Property and casualty insurance premiums written, net of recoverables | | $ | 37,658 | | | $ | 36,954 | | | $ | 34,986 | |
| | | | | | |
| Property and casualty insurance premiums earned | | | | | | |
| Direct | | $ | 38,115 | | | $ | 37,104 | | | $ | 34,977 | |
| Assumed | | 99 | | | 94 | | | 87 | |
| Ceded | | (1,141) | | | (1,122) | | | (1,016) | |
| Property and casualty insurance premiums earned, net of recoverables | | $ | 37,073 | | | $ | 36,076 | | | $ | 34,048 | |
| | | | | | |
| Life premiums and contract charges | | | | | | |
| Direct | | $ | 2,001 | | | $ | 2,074 | | | $ | 2,001 | |
| Assumed | | 685 | | | 712 | | | 754 | |
| Ceded | | (242) | | | (285) | | | (290) | |
| Life premiums and contract charges, net of recoverables | | $ | 2,444 | | | $ | 2,501 | | | $ | 2,465 | |
Reinsurance and indemnification recoverables
| | | | | | | | | | | | | | |
| Reinsurance and indemnification recoverables, net |
| | As of December 31, |
| ($ in millions) | | 2020 | | 2019 |
| Property and casualty | | | | |
| Paid and due from reinsurers and indemnitors | | $ | 101 | | | $ | 112 | |
| Unpaid losses estimated (including IBNR) | | 7,033 | | | 6,912 | |
| Total property and casualty | | $ | 7,134 | | | $ | 7,024 | |
| | | | |
Allstate Annuities (1) | | $ | 1,293 | | | $ | 1,305 | |
Allstate Life (1) | | 712 | | | 794 | |
Allstate Benefits (1) | | 81 | | | 88 | |
| Total | | $ | 9,220 | | | $ | 9,211 | |
(1)As of December 31, 2020 and 2019, approximately 94% and 93%, respectively, of the reinsurance recoverables are due from companies rated A- or better by S&P.
| | | | | | | | | | | | |
| Rollforward of credit loss allowance for reinsurance recoverables |
| | For the year ended |
| ($ in millions) | | December 31, 2020 | | | | |
Property and casualty (1) (2) | | | | | | |
| Beginning balance | | $ | (60) | | | | | |
| Decrease in the provision for credit losses | | 1 | | | | | |
| Write-offs | | — | | | | | |
| Ending balance | | $ | (59) | | | | | |
| | | | | | |
| Allstate Annuities, Allstate Life and Allstate Benefits | | | | | | |
| Beginning balance | | $ | (3) | | | | | |
| Cumulative effect of change in accounting principle | | (11) | | | | | |
| Increase in the provision for credit losses | | (1) | | | | | |
| Write-offs | | — | | | | | |
| Ending Balance | | $ | (15) | | | | | |
(1)Primarily related to discontinued lines and coverages reinsurance ceded.
(2)Indemnification recoverables are considered collectible based on the industry pool and facility enabling legislation.
The Allstate Corporation 181
2020 Form 10-K Notes to Consolidated Financial Statements
Property and casualty
Property and casualty programs are grouped by the following characteristics:
1.Indemnification programs - industry pools, facilities or associations that are governed by state insurance statutes or regulations or the federal government.
2.Catastrophe reinsurance programs - reinsurance protection for catastrophe exposure nationwide and by specific states, as applicable.
3.Other reinsurance programs - reinsurance protection for asbestos, environmental and other liability exposures as well as commercial lines, including shared economy.
Property and casualty reinsurance is in place for the Allstate Protection, Discontinued Lines and Coverages and Protection Services segments. The Company purchases reinsurance after evaluating the financial condition of the reinsurer as well as the terms and price of coverage.
Indemnification programs
The Company participates in state-based industry pools or facilities mandating participation by insurers offering certain coverage in their state, including the Michigan Catastrophic Claims Association (“MCCA”), the New Jersey Property-Liability Insurance Guaranty Association (“PLIGA”), the North Carolina Reinsurance Facility (“NCRF”) and the Florida Hurricane Catastrophe Fund (“FHCF”). When the Company pays qualifying claims under the coverage indemnified by a state’s pool or facility, the Company is reimbursed for the qualifying claim losses or expenses. Each state pool or facility may assess participating companies to collect sufficient amounts to meet its total indemnification requirements. The enabling legislation for each state’s pool or facility compels the pool or facility only to indemnify participating companies for qualifying claim losses or expenses; the state pool or facility does not underwrite the coverage or take on the ultimate risk of the indemnified business. As a pass through, these pools or facilities manage the receipt of assessments paid by participating companies and payment of indemnified amounts for covered claims presented by participating companies. The Company has not had any credit losses related to these indemnification programs.
State-based industry pools or facilities
Michigan Catastrophic Claims Association The MCCA is a statutory indemnification mechanism for member insurers’ qualifying personal injury protection claims paid for the unlimited lifetime medical benefits above the applicable retention level for qualifying injuries from automobile, motorcycle and commercial vehicle accidents. Indemnification recoverables on paid and unpaid claims, including IBNR, as of December 31, 2020 and 2019 include $5.65 billion and $5.50 billion, respectively, from the MCCA for its indemnification obligation.
The MCCA is funded by annually assessing participating member companies actively writing motor vehicle coverage in Michigan on a per vehicle basis that is currently $100 per vehicle insured. The MCCA’s calculation of the annual assessment is based upon the total of members’ actuarially determined present value of expected payments on lifetime claims by all persons expected to be catastrophically injured in that year and ultimately qualify for MCCA reimbursement, its operating expenses, and adjustments for the amount of excesses or deficiencies in prior assessments. The MCCA has also included its calculation of the impacts of the auto insurance reforms which have begun to phase in since their passage in June 2019, including the personal injury protection medical fee schedule that becomes effective July 2, 2021. The assessment is incurred by the Company as policies are written and recovered as a component of premiums from the Company’s customers.
The MCCA indemnifies qualifying claims of all current and former member companies (whether or not actively writing motor vehicle coverage in Michigan) for qualifying claims and claims expenses incurred while the member companies were actively writing the mandatory personal injury protection coverage in Michigan. Member companies actively writing automobile coverage in Michigan include the MCCA annual assessments in determining the level of premiums to charge insureds in the state.
As required for member companies by the MCCA, the Company reports covered paid and unpaid claims to the MCCA when estimates of loss for a reported claim are expected to exceed the retention level, the claims involve certain types of severe injuries, or there are litigation demands received suggesting the claim value exceeds certain thresholds. The retention level is adjusted upward every other MCCA fiscal year by the lesser of 6% or the increase in the Consumer Price Index. The retention level will be $600 thousand per claim for the fiscal two-years ending June 30, 2022 compared to $580 thousand per claim for the fiscal two-years ending June 30, 2020.
The MCCA is obligated to fund the ultimate liability of member companies’ qualifying claims and claim expenses. The MCCA does not underwrite the insurance coverage or hold any underwriting risk.
The MCCA indemnifies members as qualifying claims are paid and billed by members to the MCCA. Unlimited lifetime covered losses result in significant levels of ultimate incurred claim reserves being recorded by member companies along with offsetting indemnification recoverables. Disputes with claimants over coverage on certain reported claims can result in additional losses, which may be recoverable from the MCCA, excluding litigation expenses. There is currently no method by which insurers are able to obtain the benefit of managed care programs to reduce claims costs through the MCCA.
The MCCA annual assessments fund current operations and member company reimbursements. The MCCA prepares statutory-basis financial
Notes to Consolidated Financial Statements 2020 Form 10-K
statements in conformity with accounting practices prescribed or permitted by the State of Michigan Department of Insurance and Financial Services (“MI DOI”). The MI DOI has granted the MCCA a statutory permitted practice that expires in June 30, 2022 to discount its liabilities for loss and loss adjustment expense. As of June 30, 2020, the date of its most recent annual financial report, the MCCA had cash and invested assets of $23.41 billion and an accumulated surplus of $2.44 billion. The permitted practice reduced the accumulated deficit by $34.73 billion.
New Jersey Property-Liability Insurance Guaranty Association PLIGA serves as the statutory administrator of the Unsatisfied Claim and Judgment Fund (“UCJF”), Workers’ Compensation Security Fund and the New Jersey Surplus Lines Insurance Guaranty Fund.
In addition to its insolvency protection responsibilities, PLIGA reimburses insurers for unlimited excess medical benefits (“EMBs”) paid in connection with personal injury protection claims in excess of $75,000 for policies issued or renewed prior to January 1, 1991, and limited EMB claims in excess of $75,000 and capped at $250,000 for policies issued or renewed on or after January 1, 1991, to December 31, 2003.
A significant portion of the incurred claim reserves and the recoverables can be attributed to a small number of catastrophic claims. Assessments paid to PLIGA for the EMB program totaled $7 million in 2020. The amounts of paid and unpaid recoverables as of December 31, 2020 and 2019 were $389 million and $446 million, respectively.
PLIGA annually assesses all admitted property and casualty insurers writing covered lines in New Jersey for PLIGA indemnification and expenses. PLIGA assessments may be recouped as a surcharge on premiums collected. PLIGA does not ultimately retain underwriting risk as it assesses member companies for their expected qualifying losses to provide funding for payment of its indemnification obligation to member companies for their actual losses. As a pass through, PLIGA facilitates these transactions of receipt of assessments paid by member companies and payment to member companies for covered claims presented by them for indemnification. As of December 31, 2019, the date of its most recent annual financial report, PLIGA had a fund balance of $248 million.
As statutory administrator of the UCJF, PLIGA provides compensation to qualified claimants for personal injury protection, bodily injury, or death caused by private passenger automobiles operated by uninsured or “hit and run” drivers. The UCJF also provides private passenger pedestrian personal injury protection benefits when no other coverage is available.
PLIGA annually collects a UCJF assessment from all admitted property and casualty insurers writing motor vehicle liability insurance in New Jersey for UCJF indemnification and expenses. UCJF assessments can be expensed as losses recoverable in rates as
appropriate. As of December 31, 2019, the date of its most recent annual financial report, the UCJF fund had a balance of $50 million.
North Carolina Reinsurance Facility The NCRF provides automobile liability insurance to drivers that insurers are not otherwise willing to insure. All insurers licensed to write automobile insurance in North Carolina are members of the NCRF. Premiums, losses and expenses are assigned to the NCRF. North Carolina law allows the NCRF to recoup operating losses for certain insureds through a surcharge to policyholders. As of September 30, 2020, the NCRF reported a deficit of $125 million in members’ equity. The NCRF implemented a loss recoupment surcharge on all private passenger and commercial fleet policies effective October 1, 2020, through September 30, 2021. Member companies are assessed the recoupment surcharge. The loss recoupment surcharge will be adjusted on October 1, 2021 and discontinued once losses are recovered. The NCRF results are shared by the member companies in proportion to their respective North Carolina automobile liability writings. For the fiscal year ending September 30, 2020, net loss was $15 million, including $1.10 billion of earned premiums, $170 million of certain private passenger auto risk recoupment and $69.7 million of member loss recoupments. As of December 31, 2020, the NCRF recoverables on paid claims is $8.6 million and recoverables on unpaid claims is $58.4 million. Paid recoverable balances, if covered, are typically settled within sixty days of monthly filing.
Florida Hurricane Catastrophe Fund Allstate subsidiaries Castle Key Insurance Company (“CKIC”) and Castle Key Indemnity Company (“CKI”, and together with CKIC, “Castle Key”) participate in the mandatory coverage provided by the FHCF and therefore have access to reimbursement for certain qualifying Florida hurricane losses from the FHCF. Castle Key has exposure to assessments and pays annual premiums to the FHCF for this reimbursement protection. The FHCF has the authority to issue bonds to pay its obligations to participating insurers in excess of its capital balances. Payment of these bonds is funded by emergency assessments on all property and casualty premiums in the state, except workers’ compensation, medical malpractice, accident and health insurance and policies written under the National Flood Insurance Program (“NFIP”). The FHCF emergency assessments are limited to 6% of premiums per year beginning the first year in which reimbursements require bonding, and up to a total of 10% of premiums per year for assessments in the second and subsequent years, if required to fund additional bonding. The FHCF issued $2.00 billion in pre-event bonds in 2013 to build its capacity to reimburse member companies’ claims. The FHCF plans to fund these pre-event bonds through current FHCF cash flows. Pursuant to an Order issued by the Florida Office of Insurance Regulation, the emergency assessment is zero for all policies issued or renewed on or after January 1, 2015.
Annual premiums earned and paid under the FHCF agreement were $9 million, $9 million and $10 million in
The Allstate Corporation 183
2020 Form 10-K Notes to Consolidated Financial Statements
2020, 2019 and 2018, respectively. Qualifying losses were $15 million, $33 million and $143 million in 2020, 2019 and 2018, respectively. The Company has access to reimbursement provided by the FHCF for 90% of qualifying personal property losses that exceed its current retention of $58 million for the two largest hurricanes and $19 million for other hurricanes, up to a maximum total of $146 million, effective from June 1, 2020 to May 31, 2021. The amounts recoverable from the FHCF totaled $32 million and $52 million as of December 31, 2020 and 2019, respectively.
Federal Government - National Flood Insurance Program NFIP is a program administered by the Federal Emergency Management Agency (“FEMA”) whereby the Company sells and services NFIP flood insurance policies as an agent of FEMA and receives fees for its services. The Company is fully indemnified for claims and claim expenses and does not retain any ultimate risk for the indemnified business. The federal government is obligated to pay all claims and certain allocated loss adjustment expenses in accordance with the arrangement.
Congressional authorization for the NFIP is periodically evaluated and may be subjected to freezes, including when the federal government experiences a shutdown. FEMA has a NFIP reinsurance program to manage the future exposure of the NFIP through the transfer of risk to private reinsurance companies and capital market investors. Congress is evaluating the funding of the program as well as considering reforms to the program that would be incorporated in legislation to reauthorize the NFIP.
The amounts recoverable as of December 31, 2020 and 2019 were $30 million and $25 million, respectively. Premiums earned under the NFIP include $261 million, $258 million and $258 million in 2020, 2019 and 2018, respectively. Qualifying losses incurred include $87 million, $150 million and $118 million in 2020, 2019 and 2018, respectively.
Catastrophe reinsurance
The Company’s reinsurance program is designed to provide reinsurance protection for catastrophes resulting from multiple perils including hurricanes, windstorms, hail, tornadoes, earthquakes, wildfires, and fires following earthquakes.
•The majority of the Company’s program comprises multi-year contracts, primarily placed in the traditional reinsurance market, such that generally one-third of the program is renewed every year.
•Coverage is generally purchased on a broad geographic, product line and multiple peril loss basis.
•The Company purchases reinsurance from traditional reinsurance companies as well as the insurance linked securities market.
•Florida personal lines property is covered by a separate agreement, as the risk of loss is different and the Company’s subsidiaries operating in this state are separately capitalized.
•A portion of New Jersey personal lines property and automobile remains covered by a separate standalone agreement.
The Company’s current catastrophe reinsurance program supports the Company’s risk tolerance framework that targets less than a 1% likelihood of annual aggregate catastrophe losses from hurricanes and earthquakes, excluding other catastrophe losses and, net of reinsurance, exceeding $2 billion.
The program includes coverage for losses to personal lines property, personal lines automobile, commercial lines property or commercial lines automobile arising out of multiple perils, in addition to hurricanes and earthquakes. These reinsurance agreements are part of the catastrophe management strategy, which is intended to provide shareholders an acceptable return on the risks assumed in the property business, and to reduce variability of earnings, while providing protection to customers. The Company has the following catastrophe reinsurance agreements in effect as of December 31, 2020.
The June 1, 2020 Nationwide Excess Catastrophe Reinsurance Program (the “Nationwide Program”) provides coverage up to $4.98 billion of loss less a $500 million retention, and is subject to the percentage of reinsurance placed in each of its agreements. Personal lines property business in the state of Florida is excluded from this program. New Jersey personal lines property and automobile are covered under portions of this program, in addition to a separate standalone agreement. Separate reinsurance agreements address the distinct needs of separately capitalized legal entities. The Nationwide Program includes reinsurance agreements with both the traditional and insurance linked securities (“ILS”) markets as described below:
•The traditional market placement provides limits totaling $3.00 billion for losses arising out of multiple perils and is comprised of $2.25 billion of limits with 1 annual reinstatement of limits; two contracts combining $462 million of limits with one reinstatement of limits over a seven-year term; and two single-year term contracts combining $284 million of limits with no reinstatements.
•ILS placements provide $1.53 billion of reinsurance limits for qualifying losses in all states except Florida caused by “Named Peril Basis” events with no reinstatement of the limits. ILS placements are comprised of $150 million and $375 million placements providing occurrence only coverage; and $100 million, $400 million and $500 million placements providing occurrence and aggregate protection. Allstate declared catastrophes to personal lines property and automobile business can be aggregated to erode the aggregate retention and qualify for coverage under the aggregate limit. Recoveries are limited to our ultimate net loss from the reinsured event.
The New Jersey standalone agreement comprises two contracts that reinsure personal lines property and automobile catastrophe losses caused by multiple perils in New Jersey and provides 63% of $400 million
Notes to Consolidated Financial Statements 2020 Form 10-K
of limits in excess of provisional retentions of $150 million. Each contract includes one annual reinstatement of limits. The New Jersey contracts inure to portions of the Nationwide Program.
The Kentucky earthquake agreement comprises a three-year term contract that reinsures personal lines property losses caused by earthquakes and fire following earthquakes in Kentucky and provides $28 million of limits, 95% placed, in excess of a $2 million retention.
The 2020 Florida program provides coverage up to $633 million of loss less a $20 million retention. The Florida program includes reinsurance agreements placed with the traditional market, the Florida Hurricane Catastrophe Fund (“FHCF”), and the Insurance Linked Securities (“ILS”) market as follows:
• The traditional market placement comprises $295 million of reinsurance limits for losses to personal lines property in Florida arising out of multiple perils. The Excess contract, which forms a part of the traditional market placement, with $264 million of limits, subject to a $20 million retention, provides coverage for perils not covered by the FHCF contracts, which only cover hurricanes.
• The FHCF contracts provide approximately $118 million of limits for qualifying losses to personal lines property in Florida caused by storms the National Hurricane Center declares to be hurricanes.
• The ILS placement provides $200 million of reinsurance limits for qualifying losses to personal lines property in Florida caused by a named storm event, a severe weather event, an earthquake event, a fire event, a volcanic eruption event, or a meteorite impact event.
The Company has not experienced credit losses on its catastrophe reinsurance programs. The total cost of the property catastrophe reinsurance program was $425 million, $386 million and $343 million in 2020, 2019 and 2018, respectively.
Other reinsurance programs
The Company’s other reinsurance programs relate to asbestos, environmental, and other liability exposures and commercial lines, including shared economy. These programs include reinsurance recoverables of $166 million and $158 million from Lloyd’s of London as of December 31, 2020 and 2019, respectively. Excluding Lloyd’s of London, the largest reinsurance recoverable balance the Company had outstanding was $165 million and $115 million from Aleka Insurance Inc. as of December 31, 2020 and 2019, respectively.
Lloyd’s of London, through the creation of Equitas Limited (“Equitas”), implemented a restructuring to solidify its capital base and to segregate claims for years prior to 1993. In 2007, Berkshire Hathaway’s subsidiary, National Indemnity Company, assumed responsibility for the Equitas’ claim liabilities through a loss portfolio transfer reinsurance agreement and continues to runoff the Equitas’ claims.
Life and annuity reinsurance recoverables
The Company reinsures certain life insurance and annuity risks to other insurers primarily under yearly renewable term, coinsurance, modified coinsurance and coinsurance with funds withheld agreements. These agreements result in a passing of the agreed-upon percentage of risk to the reinsurer in exchange for negotiated reinsurance premium payments. Modified coinsurance and coinsurance with funds withheld are similar to coinsurance, except that the cash and investments that support the liability for contract benefits are not transferred to the assuming company and settlements are made on a net basis between the companies.
For certain term life insurance policies issued prior to October 2009, the Company ceded up to 90% of the mortality risk depending on the year of policy issuance under coinsurance agreements to a pool of fourteen unaffiliated reinsurers. Effective October 2009, mortality risk on term business is ceded under yearly renewable term agreements under which the Company cedes mortality in excess of its retention, which is consistent with how the Company generally reinsures its permanent life insurance business.
| | | | | | | | |
Retention limits by period of policy issuance |
Period | | Retention limits |
| April 2015 through current | | Single life: $2 million per life Joint life: no longer offered |
| April 2011 through March 2015 | | Single life: $5 million per life, $3 million age 70 and over, and $10 million for contracts that meet specific criteria Joint life: $8 million per life, and $10 million for contracts that meet specific criteria |
| July 2007 through March 2011 | | $5 million per life, $3 million age 70 and over, and $10 million for contracts that meet specific criteria |
| September 1998 through June 2007 | | $2 million per life, in 2006 the limit was increased to $5 million for instances when specific criteria were met |
| August 1998 and prior | | Up to $1 million per life |
The Allstate Corporation 185
2020 Form 10-K Notes to Consolidated Financial Statements
In addition, the Company has used reinsurance to effect the disposition of certain blocks of business. The Company had reinsurance recoverables of $1.28 billion and $1.29 billion as of December 31, 2020 and 2019, respectively, due from Prudential related to the disposal of substantially all of its variable annuity business that was effected through reinsurance agreements.
| | | | | | | | | | | | | | | | | | | | |
Amounts ceded to Prudential |
| | December 31, |
| ($ in millions) | | 2020 | | 2019 | | 2018 |
| Premiums and contract charges | | $ | 64 | | | $ | 65 | | | $ | 72 | |
| Contract benefits | | 46 | | | (4) | | | 87 | |
| Interest credited to contractholder funds | | 20 | | | 19 | | | 20 | |
| Operating costs and expenses | | 12 | | | 12 | | | 14 | |
| | | | | | |
As of December 31, 2020 and 2019, the Company had reinsurance recoverables of $99 million and $112 million, respectively, due from subsidiaries of Citigroup (Triton Insurance and American Health and Life Insurance) and Scottish Re (U.S.), Inc. in connection with the disposition of substantially all of the direct response distribution business in 2003.
As of December 31, 2020 and 2019, the Company had $66 million and $73 million of reinsurance recoverables related to Scottish Re (U.S.), Inc. On December 14, 2018, the Delaware Insurance Commissioner placed Scottish Re (U.S.), Inc. under regulatory supervision. On March 6, 2019, the Chancery Court of the State of Delaware entered a Rehabilitation and Injunction Order (the “Rehabilitation Order”) in response to a petition filed by the Insurance Commissioner (the “Petition”).
The Company joined in a joint motion filed on behalf of several affected parties asking the court to allow a specified amount of offsetting claim payments and losses against premiums remitted to Scottish Re (U.S.), Inc. The Company also filed a separate motion related to the reimbursement of claim payments where Scottish Re (U.S.), Inc. is also acting as administrator. The Court has not yet ruled on either of these motions. In the interim, the Company and several other affected parties have been permitted to exercise certain setoff rights while the parties address any potential disputes. On June 30, 2020, pursuant to the Petition, Scottish Re (U.S.), Inc. submitted a proposed Plan of Rehabilitation (“Plan”) for consideration by the Court. On November 2, 2020, the Court issued a Third Amended Order to Show Cause scheduling a hearing on the Petition and Plan for May 25, 2021. The Company continues to monitor Scottish Re (U.S.), Inc. for future developments and will reevaluate its allowance for expected credit losses as new information becomes available.
The Company is the assuming reinsurer for Lincoln Benefit Life Company’s (“LBL’s”) life insurance business sold through the Allstate agency channel and LBL’s payout annuity business in force prior to the sale of LBL on April 1, 2014. Under the terms of the reinsurance agreement, the Company is required to have a trust with assets greater than or equal to the statutory reserves ceded by LBL to the Company, measured on a monthly basis. As of December 31, 2020, the trust held $6.29 billion of investments, which are reported in the Consolidated Statement of Financial Position.
As of December 31, 2020, the gross life insurance in force was $425.44 billion of which $67.32 billion was ceded to the unaffiliated reinsurers.
| | | | | |
| Note 11 | Deferred Policy Acquisition and Sales Inducement Costs |
| | | | | | | | | | | | | | | | | | | | |
Deferred policy acquisition costs activity |
| | For the years ended December 31, |
| ($ in millions) | | 2020 | | 2019 | | 2018 |
| Balance, beginning of year | | $ | 4,699 | | | $ | 4,784 | | | $ | 4,191 | |
| | | | | | |
| Acquisition costs deferred | | 5,758 | | | 5,622 | | | 5,663 | |
| Amortization charged to income | | (5,630) | | | (5,533) | | | (5,222) | |
| Effect of unrealized gains and losses | | (127) | | | (174) | | | 152 | |
| Balance, end of year | | $ | 4,700 | | | $ | 4,699 | | | $ | 4,784 | |
| | | | | | |
|
| | |
| | | | | | |
| | | | | | |
| | | | | | |
| | | | | | |
| | | | | | |
| | | | | | |
| | | | | | |
Notes to Consolidated Financial Statements 2020 Form 10-K
| | | | | | | | | | | | | | | | | | | | |
Deferred sales inducement costs activity (1) |
| | For the years ended December 31, |
| ($ in millions) | | 2020 | | 2019 | | 2018 |
| Balance, beginning of year | | $ | 27 | | | $ | 34 | | | $ | 36 | |
| | | | | | |
| | | | | | |
| | | | | | |
| Amortization charged to income | | (5) | | | (5) | | | (4) | |
| Effect of unrealized gains and losses | | 3 | | | (2) | | | 2 | |
| | | | | | |
| | | | | | |
| Balance, end of year | | $ | 25 | | | $ | 27 | | | $ | 34 | |
(1)Deferred sales inducement costs primarily relate to fixed annuities and interest-sensitive life contracts and are recorded as part of other assets on the Consolidated Statements of Financial Position.
| | | | | | | | | | | | | | |
Total debt outstanding |
| | As of December 31, |
| ($ in millions) | | 2020 | | 2019 |
Floating Rate Senior Notes, due 2021 (1) | | $ | 250 | | | $ | 250 | |
Floating Rate Senior Notes, due 2023 (1) | | 250 | | | 250 | |
3.150% Senior Notes, due 2023 (2) | | 500 | | | 500 | |
0.750% Senior Notes, due 2025 (2) | | 600 | | | — | |
| Due after one year through five years | | 1,600 | | | 1,000 | |
3.280% Senior Notes, due 2026 (2) | | 550 | | | 550 | |
1.450% Senior Notes, due 2030 (2) | | 600 | | | — | |
Due after five years through ten years | | 1,150 | | | 550 | |
6.125% Senior Notes, due 2032 (2) | | 159 | | | 159 | |
5.350% Senior Notes due 2033 (2) | | 323 | | | 323 | |
5.550% Senior Notes due 2035 (2) | | 546 | | | 546 | |
5.950% Senior Notes, due 2036 (2) | | 386 | | | 386 | |
6.900% Senior Debentures, due 2038 | | 165 | | | 165 | |
5.200% Senior Notes, due 2042 (2) | | 62 | | | 62 | |
4.500% Senior Notes, due 2043 (2) | | 500 | | | 500 | |
4.200% Senior Notes, due 2046 (2) | | 700 | | | 700 | |
3.850% Senior Notes, due 2049 (2) | | 500 | | | 500 | |
5.100% Subordinated Debentures, due 2053 | | 500 | | | 500 | |
5.750% Subordinated Debentures, due 2053 | | 800 | | | 800 | |
| | | | |
6.500% Junior Subordinated Debentures, due 2067 | | 500 | | | 500 | |
| | | | |
Due after ten years | | 5,141 | | | 5,141 | |
| | | | |
| Long-term debt total principal | | 7,891 | | | 6,691 | |
| Debt issuance costs | | (66) | | | (60) | |
| Total long-term debt | | 7,825 | | | 6,631 | |
Short-term debt (3) | | — | | | — | |
| Total debt | | $ | 7,825 | | | $ | 6,631 | |
(1)2021 and 2023 Floating Rate Senior Notes are not redeemable prior to the applicable maturity dates and bear interest at a floating rate equal to three-month LIBOR, reset quarterly on each interest reset date, plus 0.43% and 0.63% per year, respectively.
(2)Senior Notes are subject to redemption at the Company’s option in whole or in part at any time at the greater of either 100% of the principal amount plus accrued and unpaid interest to the redemption date or the discounted sum of the present values of the remaining scheduled payments of principal and interest and accrued and unpaid interest to the redemption date.
(3)The Company classifies any borrowings which have a maturity of twelve months or less at inception as short-term debt.
The Allstate Corporation 187
2020 Form 10-K Notes to Consolidated Financial Statements
| | | | | | | | |
Debt maturities for each of the next five years and thereafter |
| ($ in millions) | | |
| 2021 | | $ | 250 | |
| 2022 | | — | |
| 2023 | | 750 | |
| 2024 | | — | |
| 2025 | | 600 | |
| Thereafter | | 6,291 | |
| Total long-term debt principal | | $ | 7,891 | |
On November 19, 2020, the Company issued $600 million of 0.750% Senior Notes due 2025 and $600 million of 1.450% Senior Notes due 2030. Interest on the Senior Notes is payable semi-annually in arrears on June 15 and December 15 of each year, beginning on June 15, 2021. The Senior Notes are redeemable at any time at the applicable redemption price prior to the maturity date. The net proceeds of this issuance were used to partially fund the acquisition of National General.
The Subordinated Debentures may be redeemed (i) in whole at any time or in part from time to time on or after January 15, 2023 for the 5.100% Subordinated Debentures and August 15, 2023 for the 5.750% Subordinated Debentures at their principal amount plus accrued and unpaid interest to, but excluding, the date of redemption; provided that if the Subordinated Debentures are not redeemed in whole, at least $25 million aggregate principal amount must remain outstanding, or (ii) in whole, but not in part, prior to January 15, 2023 for the 5.100% Subordinated Debentures and August 15, 2023 for the 5.750% Subordinated Debentures, within 90 days after the occurrence of certain tax and rating agency events, at their principal amount or, if greater, a make-whole redemption price, plus accrued and unpaid interest to, but excluding, the date of redemption. The 5.750% Subordinated Debentures have this make-whole redemption price provision only when a reduction of equity credit assigned by a rating agency has occurred.
Interest on the 5.100% Subordinated Debentures is payable quarterly at the stated fixed annual rate to January 14, 2023, or any earlier redemption date, and then at an annual rate equal to the three-month LIBOR plus 3.165%. Interest on the 5.750% Subordinated Debentures is payable semi-annually at the stated fixed annual rate to August 14, 2023, or any earlier redemption date, and then quarterly at an annual rate equal to the three-month LIBOR plus 2.938%. The Company may elect to defer payment of interest on the Subordinated Debentures for one or more consecutive interest periods that do not exceed five years. During a deferral period, interest will continue to accrue on the Subordinated Debentures at the then-applicable rate and deferred interest will compound on each interest payment date. If all deferred interest on the Subordinated Debentures is paid, the Company can again defer interest payments.
As of December 31, 2020, the Company had outstanding $500 million of Series A 6.500% Fixed-to-Floating Rate Junior Subordinated Debentures (“Debentures”). The scheduled maturity date for the
Debentures is May 15, 2057 with a final maturity date of May 15, 2067. The Debentures may be redeemed (i) in whole or in part, at any time on or after May 15, 2037 at the principal amount plus accrued and unpaid interest to the date of redemption, or (ii) in certain circumstances, in whole or in part, prior to May 15, 2037 at the principal amount plus accrued and unpaid interest to the date of redemption or, if greater, a make-whole price.
Interest on the Debentures is payable semi-annually at the stated fixed annual rate to May 15, 2037, and then payable quarterly at an annual rate equal to the three-month LIBOR plus 2.120%. The Company may elect at one or more times to defer payment of interest on the Debentures for one or more consecutive interest periods that do not exceed 10 years. Interest compounds during such deferral periods at the rate in effect for each period. The interest deferral feature obligates the Company in certain circumstances to issue common stock or certain other types of securities if it cannot otherwise raise sufficient funds to make the required interest payments. The Company has reserved 75 million shares of its authorized and unissued common stock to satisfy this obligation.
The terms of the Company’s outstanding subordinated debentures prohibit the Company from declaring or paying any dividends or distributions on common or preferred stock or redeeming, purchasing, acquiring, or making liquidation payments on common stock or preferred stock if the Company has elected to defer interest payments on the subordinated debentures, subject to certain limited exceptions.
In connection with the issuance of the Debentures, the Company entered into a replacement capital covenant (“RCC”). This covenant was not intended for the benefit of the holders of the Debentures and could not be enforced by them. Rather, it was for the benefit of holders of one or more other designated series of the Company’s indebtedness (“covered debt”), currently the 5.750% Subordinated Debentures due 2053. Pursuant to the RCC, the Company has agreed that it will not repay, redeem, or purchase the Debentures on or before May 15, 2067 (or such earlier date on which the RCC terminates by its terms) unless, subject to certain limitations, the Company has received net cash proceeds in specified amounts from the sale of common stock or certain other qualifying securities. The promises and covenants contained in the RCC will not apply if (i) S&P upgrades the Company’s issuer credit rating to A or above, (ii) the Company redeems the Debentures due to a tax event, (iii) after notice of redemption has been given by the Company and a market disruption event occurs preventing the Company from raising proceeds in accordance with the RCC, or (iv) the Company repurchases or redeems up to 10% of the outstanding principal of the Debentures in any one-year period, provided that no more than 25% will be so repurchased, redeemed or purchased in any ten-year period.
Notes to Consolidated Financial Statements 2020 Form 10-K
The RCC terminates in 2067. The RCC will terminate prior to its scheduled termination date if (i) the Debentures are no longer outstanding and the Company has fulfilled its obligations under the RCC or it is no longer applicable, (ii) the holders of a majority of the then-outstanding principal amount of the then-effective series of covered debt consent to agree to the termination of the RCC, (iii) the Company does not have any series of outstanding debt that is eligible to be treated as covered debt under the RCC, (iv) the Debentures are accelerated as a result of an event of default, (v) certain rating agency or change in control events occur, (vi) S&P, or any successor thereto, no longer assigns a solicited rating on senior debt issued or guaranteed by the Company, or (vii) the termination of the RCC would have no effect on the equity credit provided by S&P with respect to the Debentures. An event of default, as defined by the supplemental indenture, includes default in the payment of interest or principal and bankruptcy proceedings.
The administrator of LIBOR has announced it will consult on its intention to cease the publication of the one week and two month U.S. dollar (“USD”) LIBOR settings immediately following the LIBOR publication on December 31, 2021, and the remaining USD LIBOR settings immediately following the LIBOR publication on June 30, 2023. The Subordinated Debentures and the 2023 Floating Rate Senior Notes allow for the use of an alternative methodology to determine the interest rate if LIBOR is no longer available.
To manage short-term liquidity, the Company maintains a commercial paper program and a credit facility as a potential source of funds. The commercial paper program has a borrowing limit of $750 million. In November 2020, the Company entered into a new agreement for a $750 million unsecured revolving credit facility with a maturity date of November 2025. This facility contains an increase provision that would allow up to an additional $500 million of borrowing. This facility has a financial covenant requiring the Company not to exceed a 37.5% debt to capitalization
ratio as defined in the agreement. Although the right to borrow under the facility is not subject to a minimum rating requirement, the costs of maintaining the facility and borrowing under it are based on the ratings of the Company’s senior unsecured, unguaranteed long-term debt. The total amount outstanding at any point in time under the combination of the commercial paper program and the credit facility cannot exceed the amount that can be borrowed under the credit facility. No amounts were outstanding under the credit facility as of December 31, 2020 or 2019. The Company had no commercial paper outstanding as of December 31, 2020 or 2019.
The Company paid $311 million, $312 million and $330 million of interest on debt in 2020, 2019 and 2018, respectively.
The Company had $430 million and $389 million of investment-related debt that is reported in other liabilities and accrued expenses as of December 31, 2020 and 2019, respectively.
During 2018, the Company filed a universal shelf registration statement with the Securities and Exchange Commission (“SEC”) that expires in 2021. The registration statement covers an unspecified amount of securities and can be used to issue debt securities, common stock, preferred stock, depositary shares, warrants, stock purchase contracts, stock purchase units and securities of trust subsidiaries.
Common stock The Company had 900 million shares of issued common stock of which 304 million shares were outstanding and 596 million shares were held in treasury as of December 31, 2020. In 2020, the Company acquired 17 million shares at an average cost of $97.54 and reissued 3 million net shares under equity incentive plans.
Preferred stock All outstanding preferred stock represents noncumulative perpetual preferred stock with a $1.00 par value per share and a liquidation preference of $25,000 per share.
| | | | | | | | | | | | | | | | | | | | | | | | | | | | | | | | | | | | | | | | | | | | | | | | | | | | | | | | | | | | | | | | | | | | | | | |
Total preferred stock outstanding | |
| | As of December 31, | | Aggregate liquidation preference ($ in millions) | | | | Dividend per depository share (1) | | Aggregate dividend payment ($ in millions) | |
| | 2020 | | 2019 | | 2020 | | 2019 | | Dividend rate | | 2020 | | 2019 | | 2018 | | 2020 | | 2019 | | 2018 | |
| Series A | | — | | | 11,500 | | | $ | — | | | $ | 287.5 | | | 5.625 | % | | $ | — | | | $ | 1.41 | | | $ | 1.41 | | | $ | 4 | | (2) | $ | 16 | | | $ | 16 | | |
| Series C | | — | | | — | | | — | | | — | | | 6.750 | % | | — | | | — | | | 1.69 | | | — | | | — | | | 26 | | (2) |
| Series D | | — | | | — | | | — | | | — | | | 6.625 | % | | — | | | 1.66 | | | 1.66 | | | — | | | 9 | | (2) | 9 | | |
| Series E | | — | | | — | | | — | | | — | | | 6.625 | % | | — | | | 1.66 | | | 1.66 | | | — | | | 49 | | (2) | 49 | | |
| Series F | | — | | | — | | | — | | | — | | | 6.250 | % | | — | | | 1.56 | | | 1.56 | | | — | | | 16 | | (2) | 16 | | |
| Series G | | 23,000 | | | 23,000 | | | 575.0 | | | 575.0 | | | 5.625 | % | | 1.41 | | | 1.41 | | | 1.41 | | | 32 | | | 32 | | | 18 | | |
| Series H | | 46,000 | | | 46,000 | | | 1,150.0 | | | 1,150.0 | | | 5.100 | % | | 1.28 | | | 1.28 | | | — | | | 59 | | | 12 | | | — | | |
| Series I | | 12,000 | | | 12,000 | | | 300.0 | | | 300.0 | | | 4.750 | % | | 1.19 | | | 1.19 | | | — | | | 13 | | | — | | | — | | |
| Total | | 81,000 | | | 92,500 | | | $ | 2,025 | | | $ | 2,313 | | | | | | | | | | | $ | 108 | | | $ | 134 | | (2) | $ | 134 | | (2) |
(1)Each depositary share represents a 1/1,000th interest in a share of preferred stock.
(2)Excludes $10 million, $37 million and $13 million in 2020, 2019 and 2018, respectively, related to original issuance costs in preferred stock dividends on the Consolidated Statements of Operations and Consolidated Statements of Shareholders’ Equity as a result of the preferred stock redemptions.
The Allstate Corporation 189
2020 Form 10-K Notes to Consolidated Financial Statements
On January 15, 2020, the Company redeemed all 11,500 shares of its Fixed Rate Noncumulative Preferred Stock, Series A, par value $1.00 per share and liquidation preference $25,000 per share and the corresponding depositary shares. The total redemption payment was $288 million, using the proceeds from the issuance of the Fixed Rate Noncumulative Perpetual Preferred Stock, Series I. In the first quarter of 2020, the Company recognized $10 million of original issuance costs in preferred stock dividends on the Consolidated Statements of Operations and Consolidated Statements of Shareholders’ Equity as a result of the preferred stock redemption.
The preferred stock ranks senior to the Company’s common stock with respect to the payment of dividends and liquidation rights. The Company will pay dividends on the preferred stock on a noncumulative basis only when, as and if declared by the Company’s board of directors (or a duly authorized committee of the board) and to the extent that the Company has legally available funds to pay dividends. If dividends are declared on the preferred stock, they will be payable quarterly in arrears at an annual fixed rate. Dividends on the preferred stock are not cumulative. Accordingly, in the event dividends are not declared on the preferred stock for payment on any dividend payment date, then those dividends will cease to be payable. If the Company has not declared a dividend before the dividend payment date for any dividend period, the Company has no obligation to pay dividends for that dividend period, whether or not dividends are declared for any future dividend period. No dividends may be paid or declared on the Company’s common stock and no shares of the Company’s common stock may be repurchased unless the full dividends for the latest completed dividend period on the preferred stock have been declared and paid or provided for.
The Company is prohibited from declaring or paying dividends on its Series G preferred stock in excess of the amount of net proceeds from an issuance of common stock taking place within 90 days before a dividend declaration date if, on that dividend declaration date, either: (1) the risk-based capital ratios of the largest U.S. property-casualty insurance subsidiaries that collectively account for 80% or more of the net written premiums of U.S. property-casualty insurance business on a weighted average basis were less than 175% of their company action level risk-based capital as of the end of the most recent year; or (2) consolidated net income for the four-quarter period ending on the preliminary quarter end test date (the quarter that is two quarters prior to the most recently
completed quarter) is zero or negative and consolidated shareholders’ equity (excluding AOCI, and subject to certain other adjustments relating to changes in U.S. GAAP) as of each of the preliminary quarter test date and the most recently completed quarter has declined by 20% or more from its level as measured at the end of the benchmark quarter (the date that is ten quarters prior to the most recently completed quarter). If the Company fails to satisfy either of these tests on any dividend declaration date, the restrictions on dividends will continue until the Company is able again to satisfy the test on a dividend declaration date. In addition, in the case of a restriction arising under (2) above, the restrictions on dividends will continue until consolidated shareholders’ equity (excluding AOCI, and subject to certain other adjustments relating to changes in U.S. GAAP) has increased, or has declined by less than 20%, in either case as compared to its level at the end of the benchmark quarter for each dividend payment date as to which dividend restrictions were imposed.
The preferred stock does not have voting rights except with respect to certain changes in the terms of the preferred stock, in the case of certain dividend nonpayments, certain other fundamental corporate events, mergers or consolidations and as otherwise provided by law. If and when dividends have not been declared and paid in full for at least six quarterly dividend periods or their equivalent (whether or not consecutive), the authorized number of directors then constituting our board of directors will be increased by two. The holders of the preferred stock, together with the holders of all other affected classes and series of voting parity stock, voting as a single class, will be entitled to elect the two additional members of the board of directors of the Company, subject to certain conditions. The board of directors shall at no time have more than two preferred stock directors.
The preferred stock is perpetual and has no maturity date. The preferred stock is redeemable at the Company’s option in whole or in part, on or after April 15, 2023 for Series G, October 15, 2024 for Series H and January 15, 2025 for Series I at a redemption price of $25,000 per share of preferred stock, plus declared and unpaid dividends. Prior to April 15, 2023 for Series G, October 15, 2024 for Series H and January 15, 2025 for Series I, the preferred stock is redeemable at the Company’s option, in whole but not in part, within 90 days of the occurrence of certain regulatory capital event at a redemption price equal to $25,000 or $25,500 per share or a certain rating agency event at a redemption price equal to $25,000 or $25,500 per share, plus declared and unpaid dividends for Series G and for Series H and I, respectively.
| | | | | |
| Note 13 | Company Restructuring |
The Company undertakes various programs to reduce expenses. These programs generally involve a reduction in staffing levels, and in certain cases, office closures. Restructuring and related charges primarily include the following costs related to these programs:
•Employee - severance and relocation benefits
•Exit - contract termination penalties
The expenses related to these activities are included in the Consolidated Statements of Operations as restructuring and related charges and totaled $259 million, $41 million and $67 million in 2020, 2019 and 2018, respectively.
Notes to Consolidated Financial Statements 2020 Form 10-K
Restructuring expenses in 2020 are primarily due to Transformative Growth to optimize and simplify the Company’s operating model and cost structure. In connection with Transformative Growth, the Company expects to incur restructuring and related charges totaling approximately $290 million, with $238 million recorded in 2020, primarily in the Allstate Protection segment, and the remainder to be recognized in future quarters. The Company expects these actions will be completed in 2021.
Employee costs of this program include severance and employee benefits primarily impacting claims, sales, service and support functions. Exit costs reflect real estate costs primarily related to accelerated amortization of right of use assets and related leasehold improvements at facilities to be vacated.
| | | | | | | | | | | | | | | | | | | | |
| Restructuring activity during the period |
| ($ in millions) | | Employee costs | | Exit costs | | Total liability |
| Restructuring liability as of December 31, 2019 | | $ | 14 | | | $ | 8 | | | $ | 22 | |
| Expense incurred | | 214 | | | 46 | | | 260 | |
| Adjustments to liability | | 3 | | | (4) | | | (1) | |
| Payments and non-cash pension settlements | | (159) | | | (50) | | | (209) | |
| Restructuring liability as of December 31, 2020 | | $ | 72 | | | $ | — | | | $ | 72 | |
As of December 31, 2020, the cumulative amount incurred to date for active programs related to employee severance, relocation benefits and exit expenses totaled $223 million for employee costs and $52 million for exit costs.
| | | | | |
| Note 14 | Commitments, Guarantees and Contingent Liabilities |
Shared markets and state facility assessments
The Company is required to participate in assigned risk plans, reinsurance facilities and joint underwriting associations in various states that provide insurance coverage to individuals or entities that otherwise are unable to purchase such coverage from private insurers.
The Company routinely reviews its exposure to assessments from these plans, facilities and government programs. Underwriting results related to these arrangements, which tend to be adverse, have been immaterial to the Company’s results of operations in the last three years. Because of the Company’s participation, it may be exposed to losses that surpass the capitalization of these facilities or assessments from these facilities.
Florida Citizens Castle Key is subject to assessments from Citizens Property Insurance Corporation in the state of Florida (“FL Citizens”), which was initially created by the state of Florida to provide insurance to property owners unable to obtain coverage in the private insurance market. FL Citizens, at the discretion and direction of its Board of Governors (“FL Citizens Board”), can levy a regular assessment on assessable insurers and assessable insureds for a deficit in any calendar year up to a maximum of the greater of: 2% of the projected deficit or 2% of the aggregate statewide direct written premium for the prior calendar year. The base of assessable insurers includes all property and casualty premiums in the state, except workers’ compensation, medical malpractice, accident and health insurance and policies written under the NFIP. An insurer may recoup a regular assessment through a surcharge to policyholders. In order to recoup this assessment, an insurer must file for a policy surcharge with the Florida Office of Insurance Regulation at least fifteen days prior to imposing the surcharge on policies. If a deficit remains after the regular assessment, FL Citizens can
also levy emergency assessments in the current and subsequent years. Companies are required to collect the emergency assessments directly from residential property policyholders and remit to FL Citizens as collected. Currently, the emergency assessment is zero for all policies issued or renewed on or after July 1, 2015.
Louisiana Citizens Louisiana Citizens Property Insurance Corporation (“LA Citizens”) can levy a regular assessment on participating companies for a deficit in any calendar year up to a maximum of the greater of 10% of the calendar year deficit or 10% of Louisiana direct property premiums industry-wide for the prior calendar year. If the plan year deficit exceeds the amount that can be recovered through Regular Assessments, LA Citizens may fund the remaining deficit by issuing revenue assessment bonds in the capital markets. LA Citizens then declares Emergency Assessments each year to provide debt service on the bonds until they are retired. Companies writing assessable lines must surcharge their policyholders Emergency Assessments in the percentage established annually by LA Citizens and must remit amounts collected to the bond trustee on a quarterly basis. Emergency assessments to pay off bonds issued in 2007 for the hurricanes of 2005 will continue until 2025.
Facilities such as FL Citizens and LA Citizens are generally designed so that the ultimate cost is borne by policyholders; however, the exposure to assessments from these facilities and the availability of recoupments or premium rate increases may not offset each other in the Company’s financial statements. Moreover, even if they do offset each other, they may not offset each other in financial statements for the same fiscal period due to the ultimate timing of the assessments and recoupments or premium rate increases, as well as the possibility of policies not being renewed in subsequent years.
The Allstate Corporation 191
2020 Form 10-K Notes to Consolidated Financial Statements
California Earthquake Authority Exposure to certain potential losses from earthquakes in California is limited by the Company’s participation in the California Earthquake Authority (“CEA”), which provides insurance for California earthquake losses. The CEA is a privately-financed, publicly-managed state agency created to provide insurance coverage for earthquake damage. Insurers selling homeowners insurance in California are required to offer earthquake insurance to their customers either through their company or by participation in the CEA. The Company’s homeowners policies continue to include coverages for losses caused by explosions, theft, glass breakage and fires following an earthquake, which are not underwritten by the CEA.
As of October 31, 2020, the CEA’s capital balance was approximately $6.00 billion. Should losses arising from an earthquake cause a deficit in the CEA, an additional $1.10 billion would be obtained from the proceeds of revenue bonds the CEA may issue, an existing $9.50 billion reinsurance layer, $1.00 billion from policy surcharge, and finally, if needed, assessments on participating insurance companies. Participating insurers are required to pay an assessment, currently estimated not to exceed $1.70 billion, if the capital of the CEA falls below $350 million. Within the limits previously described, the assessment could be intended to restore the CEA’s capital to a level of $350 million. There is no provision that allows insurers to recover assessments through a premium surcharge or other mechanism. The CEA’s projected aggregate claim paying capacity is $19.30 billion as of October 31, 2020 and if an event were to result in claims greater than its capacity, affected policyholders may be paid a prorated portion of their covered losses, paid on an installment basis, or no payments may be made if the claim paying capacity of the CEA is insufficient.
All future assessments on participating CEA insurers are based on their CEA insurance market share as of December 31 of the preceding year. As of December 31, 2019, the Company’s market share was 9.3%. The Company does not expect its market share to materially change. At this level, the Company’s maximum possible CEA assessment was $155 million during 2020. These amounts are re-evaluated by the board of directors of the CEA on an annual basis. Accordingly, assessments from the CEA for a particular quarter or annual period may be material to the results of operations and cash flows, but not the financial position of the Company. Management believes the Company’s exposure to earthquake losses in California has been significantly reduced as a result of its participation in the CEA.
Texas Windstorm Insurance Association The Company participates as a member of the Texas Windstorm Insurance Association (“TWIA”), which provides wind and hail property coverage to coastal risks unable to procure coverage in the voluntary market. Wind and hail coverage is written on a TWIA-issued policy. TWIA follows a funding structure first utilizing currently available funds set aside from current and prior years. Under the current law, to the
extent losses exceed premiums received from policyholders, TWIA utilizes a combination of reinsurance, TWIA issued securities, as well as member and policyholder assessments to fund loss payments.
During 2020, the TWIA Board announced additional assessments primarily related to Hurricane Harvey for which the Company’s share was $1 million. These costs were recorded in property and casualty insurance claims and claims expense as catastrophe losses on the Consolidated Statements of Operations. Any assessments from TWIA for a particular quarter or annual period may be material to the results of operations and cash flows, but not to the financial position of the Company.
Texas Fair Plan Association The Company participates as a member of the Texas Fair Plan Association (“FAIR Plan”), which provides residential property insurance to inland areas designated as underserved by the Commissioner of Insurance and the applicant(s) are unable to procure coverage in the voluntary market. The FAIR Plan issues insurance policies, like an insurance company, and it also functions as a pooling mechanism that allocates premiums, claims and expenses back to the insurance industry. As a result of the losses incurred related to Hurricane Harvey, in 2017 the FAIR Plan Board unanimously voted to approve its first ever member assessment of which the Company’s share was $8 million based on total direct premium written in Texas. Insurers are permitted to recover the assessment through either a premium surcharge applied to existing customers over a three-year period or increased rates, but the ability to fully recover the assessment may be impacted by market conditions or other factors.
North Carolina Joint Underwriters Association The North Carolina Joint Underwriters Association (“NCJUA”) was created to provide property insurance for properties (other than the state’s beach and coastal areas) that insurers are not otherwise willing to insure. All insurers licensed to write property insurance in North Carolina are members of the NCJUA. Premiums, losses and expenses of the NCJUA are shared by the member companies in proportion to their respective North Carolina property insurance writings. Member companies participate in plan deficits or surpluses based on their participation ratios, which are determined annually. The Company had a $6 million receivable from the NCJUA at December 31, 2020 representing our participation in the NCJUA’s surplus of $33 million for all open years.
North Carolina Insurance Underwriting Association The North Carolina Insurance Underwriting Association (“NCIUA”) provides windstorm and hail coverage as well as homeowners policies for properties located in the state’s beach and coastal areas that insurers are not otherwise willing to insure. All insurers licensed to write residential and commercial property insurance in North Carolina are members of the NCIUA. Members are assessed in proportion to their North Carolina residential and commercial property insurance writings, which is determined annually and varies by coverage, for plan deficits. As of December 31, 2020,
Notes to Consolidated Financial Statements 2020 Form 10-K
the NCIUA had a surplus of $555 million. No member company is entitled to the distribution of any portion of the Association’s surplus. The Company does not recognize any interest related to this surplus. Legislation in 2009 capped insurers’ assessments for losses incurred in any calendar year at $1.00 billion. Subsequent to an industry assessment of $1.00 billion, if the plan continues to require funding, it may authorize insurers to assess a 10% catastrophe recovery charge on each property insurance policy statewide to be remitted to the plan.
Other programs The Company is also subject to assessments by the NCRF and the FHCF, which are described in Note 10.
Guaranty funds
Under state insurance guaranty fund laws, insurers doing business in a state can be assessed, up to prescribed limits, for certain obligations of insolvent insurance companies to policyholders and claimants. Amounts assessed to each company are typically related to its proportion of business written in each state. The Company’s policy is to accrue assessments when the entity for which the insolvency relates has met its state of domicile’s statutory definition of insolvency, the amount of the loss is reasonably estimable and the related premium upon which the assessment is based is written. In most states, the definition is met with a declaration of financial insolvency by a court of competent jurisdiction. In certain states there must also be a final order of liquidation. Since most states allow a credit against premium or other state related taxes for assessments, an asset is recorded based on paid and accrued assessments for the amount the Company expects to recover on the respective state’s tax return and is realized over the period allowed by each state. As of December 31, 2020 and 2019, the liability balance included in other liabilities and accrued expenses was $12 million and $13 million, respectively. The related premium tax offsets included in other assets were $14 million and $15 million as of December 31, 2020 and 2019, respectively.
Guarantees
In the normal course of business, the Company provides standard indemnifications to contractual counterparties in connection with numerous transactions, including acquisitions and divestitures. The types of indemnifications typically provided include indemnifications for breaches of representations and warranties, taxes and certain other liabilities, such as third-party lawsuits. The indemnification clauses are often standard contractual terms and are entered into in the normal course of business based on an assessment that the risk of loss would be remote. The terms of the indemnifications vary in duration and nature. In many cases, the maximum obligation is not explicitly stated and the contingencies triggering the obligation to indemnify have not occurred and are not expected to occur. Consequently, the maximum amount of the obligation under such indemnifications is not determinable.
Historically, the Company has not made any material payments pursuant to these obligations.
The aggregate liability balance related to all guarantees was not material as of December 31, 2020.
Regulation and compliance
The Company is subject to extensive laws, regulations, administrative directives, and regulatory actions. From time to time, regulatory authorities or legislative bodies seek to influence and restrict premium rates, require premium refunds to policyholders, require reinstatement of terminated policies, prescribe rules or guidelines on how affiliates compete in the marketplace, restrict the ability of insurers to cancel or non-renew policies, require insurers to continue to write new policies or limit their ability to write new policies, limit insurers’ ability to change coverage terms or to impose underwriting standards, impose additional regulations regarding agency and broker compensation, regulate the nature of and amount of investments, impose fines and penalties for unintended errors or mistakes, impose additional regulations regarding cybersecurity and privacy, and otherwise expand overall regulation of insurance products and the insurance industry. In addition, the Company is subject to laws and regulations administered and enforced by federal agencies, international agencies, and other organizations, including but not limited to the SEC, the Financial Industry Regulatory Authority, the U.S. Equal Employment Opportunity Commission, and the U.S. Department of Justice. The Company has established procedures and policies to facilitate compliance with laws and regulations, to foster prudent business operations, and to support financial reporting. The Company routinely reviews its practices to validate compliance with laws and regulations and with internal procedures and policies. As a result of these reviews, from time to time the Company may decide to modify some of its procedures and policies. Such modifications, and the reviews that led to them, may be accompanied by payments being made and costs being incurred. The ultimate changes and eventual effects of these actions on the Company’s business, if any, are uncertain.
Legal and regulatory proceedings and inquiries
The Company and certain subsidiaries are involved in a number of lawsuits, regulatory inquiries, and other legal proceedings arising out of various aspects of its business.
Background These matters raise difficult and complicated factual and legal issues and are subject to many uncertainties and complexities, including the underlying facts of each matter; novel legal issues; variations between jurisdictions in which matters are being litigated, heard, or investigated; changes in assigned judges; differences or developments in applicable laws and judicial interpretations; judges reconsidering prior rulings; the length of time before many of these matters might be resolved by settlement, through litigation, or otherwise; adjustments with respect to anticipated trial schedules
The Allstate Corporation 193
2020 Form 10-K Notes to Consolidated Financial Statements
and other proceedings; developments in similar actions against other companies; the fact that some of the lawsuits are putative class actions in which a class has not been certified and in which the purported class may not be clearly defined; the fact that some of the lawsuits involve multi-state class actions in which the applicable law(s) for the claims at issue is in dispute and therefore unclear; and the challenging legal environment faced by corporations and insurance companies.
The outcome of these matters may be affected by decisions, verdicts, and settlements, and the timing of such decisions, verdicts, and settlements, in other individual and class action lawsuits that involve the Company, other insurers, or other entities and by other legal, governmental, and regulatory actions that involve the Company, other insurers, or other entities. The outcome may also be affected by future state or federal legislation, the timing or substance of which cannot be predicted.
In the lawsuits, plaintiffs seek a variety of remedies which may include equitable relief in the form of injunctive and other remedies and monetary relief in the form of contractual and extra-contractual damages. In some cases, the monetary damages sought may include punitive or treble damages. Often specific information about the relief sought, such as the amount of damages, is not available because plaintiffs have not requested specific relief in their pleadings. When specific monetary demands are made, they are often set just below a state court jurisdictional limit in order to seek the maximum amount available in state court, regardless of the specifics of the case, while still avoiding the risk of removal to federal court. In Allstate’s experience, monetary demands in pleadings bear little relation to the ultimate loss, if any, to the Company.
In connection with regulatory examinations and proceedings, government authorities may seek various forms of relief, including penalties, restitution, and changes in business practices. The Company may not be advised of the nature and extent of relief sought until the final stages of the examination or proceeding.
Accrual and disclosure policy The Company reviews its lawsuits, regulatory inquiries, and other legal proceedings on an ongoing basis and follows appropriate accounting guidance when making accrual and disclosure decisions. The Company establishes accruals for such matters at management’s best estimate when the Company assesses that it is probable that a loss has been incurred and the amount of the loss can be reasonably estimated. The Company does not establish accruals for such matters when the Company does not believe both that it is probable that a loss has been incurred and the amount of the loss can be reasonably estimated. The Company’s assessment of whether a loss is reasonably possible, or probable, is based on its assessment of the ultimate outcome of the matter following all appeals. The Company does not include potential recoveries in its estimates of reasonably possible or probable losses. Legal fees are expensed as incurred.
The Company continues to monitor its lawsuits, regulatory inquiries, and other legal proceedings for further developments that would make the loss contingency both probable and estimable, and accordingly accruable, or that could affect the amount of accruals that have been previously established. There may continue to be exposure to loss in excess of any amount accrued. Disclosure of the nature and amount of an accrual is made when there have been sufficient legal and factual developments such that the Company’s ability to resolve the matter would not be impaired by the disclosure of the amount of accrual.
When the Company assesses it is reasonably possible or probable that a loss has been incurred, it discloses the matter. When it is possible to estimate the reasonably possible loss or range of loss above the amount accrued, if any, for the matters disclosed, that estimate is aggregated and disclosed. Disclosure is not required when an estimate of the reasonably possible loss or range of loss cannot be made.
For certain of the matters described below in the “Claims related proceedings” and “Other proceedings” subsections, the Company is able to estimate the reasonably possible loss or range of loss above the amount accrued, if any. In determining whether it is possible to estimate the reasonably possible loss or range of loss, the Company reviews and evaluates the disclosed matters, in conjunction with counsel, in light of potentially relevant factual and legal developments.
These developments may include information learned through the discovery process, rulings on dispositive motions, settlement discussions, information obtained from other sources, experience from managing these and other matters, and other rulings by courts, arbitrators or others. When the Company possesses sufficient appropriate information to develop an estimate of the reasonably possible loss or range of loss above the amount accrued, if any, that estimate is aggregated and disclosed below. There may be other disclosed matters for which a loss is probable or reasonably possible, but such an estimate is not possible. Disclosure of the estimate of the reasonably possible loss or range of loss above the amount accrued, if any, for any individual matter would only be considered when there have been sufficient legal and factual developments such that the Company’s ability to resolve the matter would not be impaired by the disclosure of the individual estimate.
The Company currently estimates that the aggregate range of reasonably possible loss in excess of the amount accrued, if any, for the disclosed matters where such an estimate is possible is zero to $85 million, pre-tax. This disclosure is not an indication of expected loss, if any. Under accounting guidance, an event is “reasonably possible” if “the chance of the future event or events occurring is more than remote but less than likely” and an event is “remote” if “the chance of the future event or events occurring is slight.” This estimate is based upon currently available information and is subject to significant judgment and a variety of assumptions, and known and unknown uncertainties. The matters underlying the estimate will
Notes to Consolidated Financial Statements 2020 Form 10-K
change from time to time, and actual results may vary significantly from the current estimate. The estimate does not include matters or losses for which an estimate is not possible. Therefore, this estimate represents an estimate of possible loss only for certain matters meeting these criteria. It does not represent the Company’s maximum possible loss exposure. Information is provided below regarding the nature of all of the disclosed matters and, where specified, the amount, if any, of plaintiff claims associated with these loss contingencies.
Due to the complexity and scope of the matters disclosed in the “Claims related proceedings” and “Other proceedings” subsections below and the many uncertainties that exist, the ultimate outcome of these matters cannot be predicted and in the Company’s judgment, a loss, in excess of amounts accrued, if any, is not probable. In the event of an unfavorable outcome in one or more of these matters, the ultimate liability may be in excess of amounts currently accrued, if any, and may be material to the Company’s operating results or cash flows for a particular quarterly or annual period. However, based on information currently known to it, management believes that the ultimate outcome of all matters described below, as they are resolved over time, is not likely to have a material effect on the financial position of the Company.
Claims related proceedings The Company is managing various disputes in Florida that raise challenges to the Company’s practices, processes, and procedures relating to claims for personal injury protection benefits under Florida auto policies. Medical providers continue to pursue litigation under various theories that challenge the amounts that the Company pays under the personal injury protection coverage, seeking additional benefit payments, as well as applicable interest, penalties and fees. There are two pending class actions, Pierce v. Allstate Insurance Company, et al. (Broward County, Fla. filed August 2013), the class settlement of which has received final approval, and Revival Chiropractic v. Allstate Insurance Company, et al. (M.D. Fla. filed January 2019), where the court denied class certification and plaintiff’s request to file a renewed motion for class certification. The Company is also defending litigation involving individual plaintiffs. The Company is vigorously asserting both procedural and substantive defenses to these lawsuits.
The Company is defending putative class actions in various courts that raise challenges to the Company’s depreciation practices in homeowner property claims. In these lawsuits, plaintiffs generally allege that, when calculating actual cash value, the costs of “non-materials” such as labor, general contractor’s overhead and profit, and sales tax should not be subject to depreciation. The Company is currently defending the following lawsuits on this issue: Perry v. Allstate Indemnity Company, et al. (N.D. Ohio filed May 2016); Lado v. Allstate Vehicle and Property Insurance Company (S.D. Ohio filed March 2020); Maniaci v. Allstate Insurance Company (N.D. Ohio filed March 2020); Ferguson-Luke et al. v. Allstate Property and Casualty Insurance Company (N.D. Ohio
filed April 2020); Brasher v. Allstate Indemnity Company (N.D. Ala. filed February 2018); Huey v. Allstate Vehicle and Property Insurance Company (N.D. Miss. filed October 2019); Floyd, et al. v. Allstate Indemnity Company et al. (D.S.C. filed January 2020); Clark v. Allstate Vehicle and Property Insurance Company (Circuit Court of Independence Co., Ark. filed February 2016); Thaxton v. Allstate Indemnity Company (Madison Co., Ill. filed July 2020); Hester v. Allstate Vehicle and Property Insurance Company (St. Clair Co., Ill. filed June 2020). The trial court denied class certification in Brasher, and plaintiff’s motion for reconsideration of this ruling was denied. No classes have been certified in any of the other matters.
The Company is defending putative class actions pending in multiple states alleging that the Company underpays total loss vehicle physical damage claims on auto policies. The allegedly systematic underpayments result from one or more of the following theories: (a) the third party valuation tool used by the Company as part of a comprehensive adjustment process is allegedly flawed, biased, or contrary to applicable law; (b) the Company allegedly does not pay sales tax, title fees, registration fees, and/or other specified fees that are allegedly mandatory under policy language or state legal authority; or (c) after paying for the value of the loss vehicle, then the Company allegedly is not entitled to retain the residual salvage value, and the Company allegedly must pay salvage value to the owner (or if the loss vehicle is retained by the owner, then the Company allegedly may not apply any offset for the salvage value).
The following cases are currently pending against the Company: Olberg v. Allstate Insurance Company, Allstate Fire and Casualty Insurance Company, and CCC Information Services, Inc. (W.D. Wash., filed April 2018); Bloomgarden v. Allstate Fire and Casualty Insurance Company (S.D. Fla., filed July 2018, dismissed August 2019, refiled on September 2019, remanded to 17th Judicial Circuit, Broward County October 2020); Erby v. Allstate Fire and Casualty Insurance Company (E.D. Pa., filed October 2018); Kronenberg v. Allstate Insurance Company and Allstate Fire and Casualty Insurance Company (E.D. N.Y., filed December 2018); Ryan v. Allstate Fire and Casualty Insurance Company (7th Judicial Circuit, Volusia County, Fla.; filed May 2019, dismissed and refiled October 2019); Durgin v. Allstate Property and Casualty Insurance Company (W.D. LA, filed June 7, 2019); Anderson v. Allstate Insurance Company (20th Judicial Circuit, Collier County, Fla.; filed August 2019); Cody v. Allstate Fire and Casualty Insurance Company and Allstate County Mutual Insurance Company (N.D. Tex., filed August 2019); Williams v. Esurance Property and Casualty Insurance Company (C.D. Cal,; filed September 2020); Cotton v. Allstate Fire and Casualty Insurance Company (Cir. Ct. of Cook County, Chancery Div., Ill.; filed October 2020); Romaniak v. Esurance Property and Casualty Insurance Company (N.D. Ohio, filed December 2020); Gosa v. Esurance Property and Casualty Insurance Company (S.D. Ill., filed December 2020).
The Allstate Corporation 195
2020 Form 10-K Notes to Consolidated Financial Statements
None of the courts in any of the pending matters has ruled on class certification.
Other proceedings The stockholder derivative actions described below are disclosed pursuant to SEC disclosure requirements for these types of matters. The putative class action alleging violations of the federal securities laws is disclosed because it involves similar allegations to those made in the stockholder derivative actions.
Biefeldt / IBEW Consolidated Action. Two separately filed stockholder derivative actions have been consolidated into a single proceeding that is pending in the Circuit Court for Cook County, Illinois, Chancery Division. The original complaint in the first-filed of those actions, Biefeldt v. Wilson, et al., was filed on August 3, 2017, in that court by a plaintiff alleging that she is a stockholder of the Company. On June 29, 2018, the court granted defendants’ motion to dismiss that complaint for failure to make a pre-suit demand on the Allstate Board but granted plaintiff permission to file an amended complaint. The original complaint in IBEW Local No. 98 Pension Fund v. Wilson, et al., was filed on April 12, 2018, in the same court by another plaintiff alleging to be a stockholder of the Company. After the court issued its dismissal decision in the Biefeldt action, plaintiffs agreed to consolidate the two actions and filed a consolidated amended complaint naming as defendants the Company’s chairman, president and chief executive officer, its former president, and certain present or former members of the board of directors. In that complaint, plaintiffs allege that the directors and officer defendants breached their fiduciary duties to the Company in connection with allegedly material misstatements or omissions concerning the Company’s automobile insurance claim frequency statistics and the reasons for a claim frequency increase for Allstate brand auto insurance between October 2014 and August 3, 2015. The factual allegations are substantially similar to those at issue in In re The Allstate Corp. Securities Litigation. Plaintiffs further allege that a senior officer and several outside directors engaged in stock option exercises allegedly while in possession of material nonpublic information. Plaintiffs seek, on behalf of the Company, an unspecified amount of damages and various forms of equitable relief. Defendants moved to dismiss the consolidated complaint on September 24, 2018 for failure to make a demand on the Allstate Board. On May 14, 2019, the court granted defendants’ motion to dismiss the complaint, but allowed plaintiffs leave to file a second consolidated amended complaint which they filed on September 17, 2019. Defendants moved to dismiss the complaint on November 1, 2019 for failure to make a demand on the Allstate Board. The court subsequently requested supplemental briefing on the motion which concluded on February 1, 2021. A ruling is expected at a status conference scheduled for February 24, 2021.
In Sundquist v. Wilson, et al., another plaintiff alleging to be a stockholder of the Company filed a stockholder derivative complaint in the United States District Court for the Northern District of Illinois on May 21, 2018. Plaintiff seeks, on behalf of the Company, an
unspecified amount of damages and various forms of equitable relief. The complaint names as defendants the Company’s chairman, president and chief executive officer, its former president, its former vice chairman, and certain present or former members of the board of directors.
The complaint alleges breaches of fiduciary duty based on allegations similar to those asserted in In re The Allstate Corp. Securities Litigation as well as state law “misappropriation” claims based on stock option transactions by the Company’s chairman, president and chief executive officer, its former vice chairman, and certain members of the board of directors. Defendants moved to dismiss and/or stay the complaint on August 7, 2018. On December 4, 2018, the court granted defendants’ motion and stayed the case pending the final resolution of the consolidated Biefeldt/IBEW matter.
Mims v. Wilson, et al., is an additional stockholder derivative action filed on February 12, 2020 in the United States District Court for the Northern District of Illinois. Plaintiff alleges that she previously made a demand on the Allstate board of directors and seeks, on behalf of the Company, an unspecified amount of damages and various forms of equitable relief. The complaint names as defendants the Company’s chairman, president and chief executive officer, its former president, its former vice chairman, and certain present or former members of the board of directors. The complaint alleges breaches of fiduciary duty and unjust enrichment based on allegations similar to those asserted in In re The Allstate Corp. Securities Litigation. On February 20, 2020, the Allstate board of directors appointed a special committee to investigate the allegations in plaintiff’s demand. The Company moved to dismiss the complaint on August 24, 2020 and on December 8, 2020, the court granted defendants’ motion, and dismissed the complaint with prejudice. On January 5, 2021, plaintiff filed a motion to alter the judgment and requested leave to file an amended complaint. Briefing is expected to be completed on February 5, 2021.
In re The Allstate Corp. Securities Litigation is a certified class action filed on November 11, 2016 in the United States District Court for the Northern District of Illinois against the Company and two of its officers asserting claims under the federal securities laws. Plaintiffs allege that they purchased Allstate common stock during the class period and suffered damages as the result of the conduct alleged. Plaintiffs seek an unspecified amount of damages, costs, attorney’s fees, and other relief as the court deems appropriate. Plaintiffs allege that the Company and certain senior officers made allegedly material misstatements or omissions concerning claim frequency statistics and the reasons for a claim frequency increase for Allstate brand auto insurance between October 2014 and August 3, 2015.
Plaintiffs further allege that a senior officer engaged in stock option exercises during that time allegedly while in possession of material nonpublic information about Allstate brand auto insurance claim frequency. The Company, its chairman, president and chief executive
Notes to Consolidated Financial Statements 2020 Form 10-K
officer, and its former president are the named defendants. After the court denied their motion to dismiss on February 27, 2018, defendants answered the complaint, denying plaintiffs’ allegations that there was any misstatement or omission or other misconduct. On June 22, 2018, plaintiffs filed their motion for class certification. The court allowed the lead plaintiffs to amend their complaint to add the City of Providence Employee Retirement System as a proposed class representative and on September 12, 2018, the amended complaint was filed. On March 26, 2019, the court granted plaintiffs’ motion for class certification and certified a class consisting of all persons who purchased Allstate common stock between October 29, 2014 and August 3, 2015. On April 9, 2019, defendants filed with the U.S. Court of Appeals for the Seventh Circuit a petition for permission to appeal this ruling and the Seventh Circuit granted that petition on April 25, 2019. On July 16, 2020, the Seventh Circuit vacated the class certification order and remanded the matter for further consideration by the district court. Discovery in this matter concluded on October 5, 2020. On December 21, 2020, the district court again granted plaintiffs’ motion for class certification and certified a class consisting of all persons who purchased Allstate common stock between October 29, 2014 and August 3, 2015. On January 4, 2021, defendants filed with the Seventh Circuit a petition for permission to appeal this ruling. The petition was denied on January 28, 2021.
Asbestos and environmental
Management believes its net loss reserves for asbestos, environmental and other discontinued lines exposures are appropriately established based on available facts, technology, laws and regulations. However, establishing net loss reserves for asbestos, environmental and other discontinued lines claims is subject to uncertainties that are much greater than those presented by other types of claims. The ultimate cost of losses may vary materially from recorded amounts, which are based on management’s best estimate. Among the complications are lack of historical data, long reporting delays, uncertainty as to the number and identity of insureds with potential exposure and unresolved legal issues regarding policy coverage; unresolved legal issues regarding the determination, availability and timing of exhaustion of policy limits; plaintiffs’ evolving and expanding theories of liability; availability and collectability of recoveries from reinsurance; retrospectively determined premiums and other contractual agreements; estimates of the extent and timing of any contractual liability; the impact of bankruptcy protection sought by various asbestos producers and other asbestos defendants; and other uncertainties.
There are also complex legal issues concerning the interpretation of various insurance policy provisions and whether those losses are covered, or were ever intended to be covered, and could be recoverable through retrospectively determined premium, reinsurance or other contractual agreements. Courts have reached different and sometimes inconsistent conclusions as to when losses are deemed to have occurred and which policies provide coverage; what
types of losses are covered; whether there is an insurer obligation to defend; how policy limits are determined; how policy exclusions and conditions are applied and interpreted; and whether clean-up costs represent insured property damage. Further, insurers and claims administrators acting on behalf of insurers are increasingly pursuing evolving and expanding theories of reinsurance coverage for asbestos and environmental losses.
Adjudication of reinsurance coverage is predominately decided in confidential arbitration proceedings which may have limited precedential or predictive value further complicating management’s ability to estimate probable loss for reinsured asbestos and environmental claims. Management believes these issues are not likely to be resolved in the near future, and the ultimate costs may vary materially from the amounts currently recorded resulting in material changes in loss reserves. In addition, while the Company believes that improved actuarial techniques and databases have assisted in its ability to estimate asbestos, environmental, and other discontinued lines net loss reserves, these refinements may subsequently prove to be inadequate indicators of the extent of probable losses. Due to the uncertainties and factors described above, management believes it is not practicable to develop a meaningful range for any such additional net loss reserves that may be required.
The Allstate Corporation 197
2020 Form 10-K Notes to Consolidated Financial Statements
The Company and its domestic subsidiaries file a consolidated federal income tax return. Tax liabilities and benefits realized by the consolidated group are allocated as generated by the respective entities.
Deferred income taxes result from temporary differences between the tax basis of assets and liabilities and their reported amounts in the financial statements that will result in taxable or deductible amounts in future years. Deferred tax assets and liabilities are measured using enacted tax rates expected to apply to taxable income in years in which those temporary differences are expected to be recovered or settled. Deferred tax assets and liabilities are adjusted through income tax expense as changes in tax laws or rates are enacted.
Regulatory tax examinations The Internal Revenue Service (“IRS”) has completed its exam of the
Company’s 2013 through 2016 federal income tax returns. The 2017 and 2018 audit cycle is expected to begin in the first quarter of 2021. Any adjustments that may result from IRS examinations of the Company’s tax returns are not expected to have a material effect on the consolidated financial statements.
Unrecognized tax benefits The Company recognizes tax positions in the consolidated financial statements only when it is more likely than not that the position will be sustained on examination by the relevant taxing authority based on the technical merits of the position. A position that meets this standard is measured at the largest amount of benefit that will more likely than not be realized on settlement. A liability is established for differences between positions taken in a tax return and amounts recognized in the consolidated financial statements.
| | | | | | | | | | | | | | | | | | | | |
Reconciliation of the change in the amount of unrecognized tax benefits |
| | For the years ended December 31, |
| ($ in millions) | | 2020 | | 2019 | | 2018 |
| Balance – beginning of year | | $ | 70 | | | $ | 70 | | | $ | 55 | |
| Increase for tax positions taken in a prior year | | — | | | — | | | 3 | |
| | | | | | |
| Increase for tax positions taken in the current year | | — | | | — | | | 12 | |
| | | | | | |
| Decrease for settlements | | (58) | | | — | | | — | |
| | | | | | |
| Balance – end of year | | $ | 12 | | | $ | 70 | | | $ | 70 | |
The Company believes that the unrecognized tax benefits balance will not materially change within the next twelve months.
| | | | | | | | | | | | | | |
Components of the deferred income tax assets and liabilities |
| | As of December 31, |
| ($ in millions) | | 2020 | | 2019 |
| Deferred tax assets | | | | |
| Unearned premium reserves | | $ | 659 | | | $ | 642 | |
| Pension | | 161 | | | 197 | |
| Accrued compensation | | 139 | | | 147 | |
| Discount on loss reserves | | 79 | | | 78 | |
| | | | |
| Other postretirement benefits | | 36 | | | 49 | |
| Net operating loss carryover | | 23 | | | 26 | |
| Other assets | | 68 | | | 54 | |
| | | | |
| Total deferred tax assets | | 1,165 | | | 1,193 | |
| Deferred tax liabilities | | | | |
| DAC | | (858) | | | (847) | |
| Unrealized net capital gains | | (856) | | | (507) | |
| Investments | | (394) | | | (567) | |
| Life and annuity reserves | | (216) | | | (222) | |
| | | | |
| Intangible assets | | (87) | | | (98) | |
| Other liabilities | | (109) | | | (106) | |
| Total deferred tax liabilities | | (2,520) | | | (2,347) | |
| Net deferred tax liability | | $ | (1,355) | | | $ | (1,154) | |
Although realization is not assured, management believes it is more likely than not that the deferred tax assets will be realized based on the Company’s assessment that the deductions ultimately recognized for tax purposes will be fully utilized. As of December 31, 2020, the Company has U.S. federal and foreign net operating loss carryforwards of $44 million and $68 million, respectively.
The provisions of the Tax Cuts and Jobs Act of 2017 eliminated the 20-year carryforward period and made it indefinite for federal net operating losses generated in tax years after December 31, 2017. For such amounts generated prior to 2018, the 20-year carryforward period continues to apply.
Notes to Consolidated Financial Statements 2020 Form 10-K
| | | | | | | | | | | | | | | | | | | | |
Components of the net operating loss carryforwards as of December 31, 2020 |
| ($ in millions) | | 20-Year Carryforward
Expires in 2025-2037 | | Indefinite Carryforward Period | | Total |
| US Federal | | $ | 36 | | | $ | 8 | | | $ | 44 | |
| Foreign | | — | | | 68 | | | 68 | |
| Total | | $ | 36 | | | $ | 76 | | | $ | 112 | |
| | | | | | | | | | | | | | | | | | | | |
Components of income tax expense |
| | For the years ended December 31, |
| ($ in millions) | | 2020 | | 2019 | | 2018 |
| Current | | $ | 1,499 | | | $ | 991 | | | $ | 704 | |
| Deferred | | (116) | | | 251 | | | (236) | |
| Total income tax expense | | $ | 1,383 | | | $ | 1,242 | | | $ | 468 | |
The Company paid income taxes of $1.48 billion, $648 million and $731 million in 2020, 2019 and 2018, respectively.
The Company had current income tax payable of $84 million and $124 million as of December 31, 2020 and 2019, respectively.
| | | | | | | | | | | | | | | | | | | | | | | | | | | | | |
Reconciliation of the statutory federal income tax rate to the effective income tax rate |
| | For the years ended December 31, |
| ($ in millions) | | 2020 | | 2019 | | 2018 |
| Income before income taxes | | $ | 6,959 | | | | $ | 6,089 | | | | $ | 2,628 | | |
| | | | | | | | | |
| Statutory federal income tax rate on income from operations | | 1,461 | | 21.0 | % | | 1,279 | | 21.0 | % | | 552 | | 21.0 | % |
| Tax credits | | (45) | | (0.7) | | | (33) | | (0.5) | | | (34) | | (1.3) | |
| Share-based payments | | (30) | | (0.4) | | | (24) | | (0.4) | | | (16) | | (0.6) | |
| Tax-exempt income | | (24) | | (0.3) | | | (27) | | (0.4) | | | (24) | | (0.9) | |
| State income taxes | | 35 | | 0.5 | | | 41 | | 0.7 | | | 27 | | 1.0 | |
| Tax Legislation benefit | | — | | — | | | — | | — | | | (29) | | (1.1) | |
| | | | | | | | | |
| | | | | | | | | |
| Other | | (14) | | (0.2) | | | 6 | | — | | | (8) | | (0.3) | |
| Effective income tax rate on income from operations | | $ | 1,383 | | 19.9 | % | | $ | 1,242 | | 20.4 | % | | $ | 468 | | 17.8 | % |
The Allstate Corporation 199
2020 Form 10-K Notes to Consolidated Financial Statements
| | | | | |
| Note 16 | Statutory Financial Information and Dividend Limitations |
Allstate’s domestic property and casualty and life insurance subsidiaries prepare their statutory-basis financial statements in conformity with accounting practices prescribed or permitted by the insurance department of the applicable state of domicile. Prescribed statutory accounting practices include a variety of publications of the National Association of Insurance Commissioners (“NAIC”), as well as state laws, regulations and general administrative rules. Permitted statutory accounting practices encompass all accounting practices not so prescribed.
All states require domiciled insurance companies to prepare statutory-basis financial statements in conformity with the NAIC Accounting Practices and Procedures Manual, subject to any deviations prescribed or permitted by the applicable insurance commissioner or director. Statutory accounting practices differ from GAAP primarily since they require charging policy acquisition and certain sales inducement costs to expense as incurred, establishing life insurance reserves based on different actuarial assumptions, and valuing certain investments and establishing deferred taxes on a different basis.
| | | | | | | | | | | | | | | | | | | | | | | | | | | | | | | | |
Statutory net income (loss) and capital and surplus of Allstate’s domestic insurance subsidiaries |
| | Net income (loss) | | Capital and surplus |
| ($ in millions) | | 2020 | | 2019 | | 2018 | | 2020 | | 2019 |
| Amounts by major business type: | | | | | | | | | | |
| Property and casualty insurance | | $ | 6,232 | | | $ | 3,989 | | | $ | 2,939 | | | $ | 17,128 | | | $ | 16,192 | |
| Life insurance, annuities and voluntary accident and health insurance | | 14 | | | 422 | | | 465 | | | 4,255 | | | 4,208 | |
| Amount per statutory accounting practices | | $ | 6,246 | | | $ | 4,411 | | | $ | 3,404 | | | $ | 21,383 | | | $ | 20,400 | |
Dividend Limitations
There are no regulatory restrictions that limit the payment of dividends by the Corporation, except those generally applicable to corporations incorporated in Delaware. Dividends are payable only out of certain components of shareholders’ equity as permitted by Delaware law. However, the ability of the Corporation to pay dividends is dependent on business conditions, income, cash requirements of the Company, receipt of dividends from AIC and other relevant factors.
The payment of shareholder dividends by AIC without the prior approval of the Illinois Department of Insurance (“IL DOI”) is limited to formula amounts based on net income and capital and surplus, determined in conformity with statutory accounting practices, as well as the timing and amount of dividends paid in the preceding twelve months. AIC paid dividends of $4.44 billion in 2020. The maximum amount of dividends AIC will be able to pay without prior IL DOI approval at a given point in time during 2021 is $5.95 billion, less dividends paid during the preceding twelve months measured at that point in time. The payment of a dividend in excess of this amount requires 30 days advance written notice to the IL DOI. The dividend is deemed approved, unless the IL DOI disapproves it within the 30-day notice period. Additionally, any dividend must be paid out of unassigned surplus excluding unrealized appreciation from investments, which for AIC totaled $13.52 billion as of December 31, 2020, and cannot result in capital and surplus being less than the minimum amount required by law.
Under state insurance laws, insurance companies are required to maintain paid up capital of not less than the minimum capital requirement applicable to the types of insurance they are authorized to write. Insurance companies are also subject to risk-based capital (“RBC”) requirements adopted by state insurance regulators. A company’s “authorized control
level RBC” is calculated using various factors applied to certain financial balances and activity. Companies that do not maintain adjusted statutory capital and surplus at a level in excess of the company action level RBC, which is two times authorized control level RBC, are required to take specified actions. Company action level RBC is significantly in excess of the minimum capital requirements. Total adjusted statutory capital and surplus and authorized control level RBC of AIC were $20.54 billion and $2.92 billion, respectively, as of December 31, 2020. Most of the Corporation’s insurance subsidiaries are subsidiaries of or reinsure all of their business to AIC, including ALIC. AIC’s subsidiaries are included as a component of AIC’s total statutory capital and surplus.
The amount of restricted net assets, as represented by the Corporation’s investment in its insurance subsidiaries, was $31.03 billion as of December 31, 2020.
Intercompany transactions
Notification and approval of intercompany lending activities is also required by the IL DOI for transactions that exceed a level that is based on a formula using statutory admitted assets and statutory surplus.
Notes to Consolidated Financial Statements 2020 Form 10-K
Pension and other postretirement plans
Defined benefit pension plans cover most full-time employees, certain part-time employees and employee-agents. Benefits under the pension plans are based upon the employee’s length of service, eligible annual compensation and, prior to January 1, 2014, either a cash balance or final average pay formula. A cash balance formula applies to all eligible employees hired after August 1, 2002. Eligible employees hired before August 1, 2002 chose between the cash balance formula and the final average pay formula. In July 2013, the Company amended its primary plans effective January 1, 2014 to introduce a new cash balance formula to replace the previous formulas (including the final average pay formula and the previous cash balance formula) under which eligible employees accrue benefits. The Company merged two of its qualified pension plans effective March 31, 2019.
The Company also provides a medical coverage subsidy for eligible employees hired before January 1, 2003, including their eligible dependents, when they retire and certain life insurance benefits for eligible retirees (“postretirement benefits”). In September 2020, the Company announced it will eliminate the medical coverage subsidy effective January 1, 2021 for employees who are not eligible to retire as of December 31, 2020.
Qualified employees may become eligible for a medical subsidy if they retire in accordance with the terms of the applicable plans and are continuously insured under the Company’s group plans or other approved plans in accordance with the plan’s participation requirements. The Company shares the cost of retiree medical benefits with non Medicare-eligible retirees based on years of service, with the Company’s share being subject to a 5% limit on future annual medical cost inflation after retirement. For Medicare-eligible retirees, the Company provides a fixed Company contribution based on years of service and other factors, which is not subject to adjustments for inflation.
In July 2013, the Company amended the plan to eliminate the life insurance benefits effective January 1, 2014 for current eligible employees and effective January 1, 2016 for eligible retirees who retired after 1989. Subject to a court order, the Company paid life insurance premiums for certain retiree plaintiffs until their lawsuit seeking to keep their life insurance benefits intact was resolved. In September 2020, the court entered summary judgment in favor of the Company and dismissed the action, releasing the Company from the order requiring the continued payment of premiums for certain retirees. The judgment in favor of the Company is currently on appeal.
The Company has reserved the right to modify or terminate its benefit plans at any time and for any reason.
Obligations and funded status
The Company calculates benefit obligations based upon generally accepted actuarial methodologies using the projected benefit obligation (“PBO”) for pension plans and the accumulated postretirement benefit obligation (“APBO”) for other postretirement plans. Pension costs and other postretirement obligations are determined using a December 31 measurement date. The benefit obligations represent the actuarial present value of all benefits attributed to employee service rendered as of the measurement date. The PBO is measured using the pension benefit formulas and assumptions. A plan’s funded status is calculated as the difference between the benefit obligation and the fair value of plan assets. The Company’s funding policy for the pension plans is to make contributions at a level in accordance with regulations under the Internal Revenue Code (“IRC”) and generally accepted actuarial principles. The Company’s other postretirement benefit plans are not funded.
The Allstate Corporation 201
2020 Form 10-K Notes to Consolidated Financial Statements
| | | | | | | | | | | | | | | | | | | | | | | | | | |
Change in projected benefit obligation, plan assets and funded status |
| | As of December 31, |
| | Pension benefits | | Postretirement benefits |
| ($ in millions) | | 2020 | | 2019 | | 2020 | | 2019 |
| Change in projected benefit obligation | | | | | | | | |
| Benefit obligation, beginning of year | | $ | 7,139 | | | $ | 6,224 | | | $ | 397 | | | $ | 375 | |
| Service cost | | 104 | | | 117 | | | 4 | | | 8 | |
| Interest cost | | 210 | | | 240 | | | 11 | | | 14 | |
| Participant contributions | | — | | | — | | | 14 | | | 15 | |
| Actuarial losses (gains) | | 813 | | | 927 | | | 22 | | | 19 | |
| Benefits paid | | (522) | | | (356) | | | (37) | | | (39) | |
| Plan amendments | | — | | | — | | | (102) | | | — | |
| Translation adjustment and other | | (1) | | | (13) | | | (1) | | | 5 | |
| Curtailment losses (gains) | | 20 | | | — | | | 10 | | | — | |
| Benefit obligation, end of year | | $ | 7,763 | | | $ | 7,139 | | | $ | 318 | | | $ | 397 | |
| | | | | | | | |
| Change in plan assets | | | | | | | | |
| Fair value of plan assets, beginning of year | | $ | 6,192 | | | $ | 5,299 | | | | | |
| Actual return on plan assets | | 1,300 | | | 1,235 | | | | | |
| Employer contribution | | 18 | | | 27 | | | | | |
| Benefits paid | | (522) | | | (356) | | | | | |
| Translation adjustment and other | | (1) | | | (13) | | | | | |
| Fair value of plan assets, end of year | | $ | 6,987 | | | $ | 6,192 | | | | | |
| | | | | | | | |
Funded status (1) | | $ | (776) | | | $ | (947) | | | $ | (318) | | | $ | (397) | |
| | | | | | | | |
| | | | | | | | |
| | | | | | | | |
| | | | | | | | |
| | | | | | | | |
| | | | | | | | |
| | | | | | | | |
| Amounts recognized in AOCI | | | | | | | | |
| Unamortized pension and other postretirement prior service credit | | $ | (78) | | | $ | (142) | | | $ | (89) | | | $ | (13) | |
(1)The funded status is recorded within other liabilities and accrued expenses on the Consolidated Statements of Financial Position.
| | | | | | | | | | | | | | |
Changes in items not yet recognized as a component of net cost for pension and other postretirement plans |
| ($ in millions) | | Pension benefits | | Postretirement benefits |
| Items not yet recognized as a component of net cost – December 31, 2019 | | $ | (142) | | | $ | (13) | |
| | | | |
| | | | |
| Prior service credit arising during the period | | — | | | (102) | |
| Prior service credit recognized during the period due to curtailment | | 10 | | | 18 | |
| Prior service credit amortized to net cost | | 54 | | | 10 | |
| Translation adjustment and other | | — | | | (2) | |
| Items not yet recognized as a component of net cost – December 31, 2020 | | $ | (78) | | | $ | (89) | |
The prior service credit is recognized as a component of net cost for pension and other postretirement plans amortized over the average remaining service period of active employees expected to receive benefits. The prior service credit that will be amortized to net cost for pension and postretirement plans in 2021 is estimated to be $50 million and $25 million, respectively.
The accumulated benefit obligation (“ABO”) for all defined benefit pension plans was $7.55 billion and $7.02 billion as of December 31, 2020 and 2019, respectively. The ABO is the actuarial present value of all benefits attributed by the pension benefit formula
to employee service rendered at the measurement date. However, it differs from the PBO due to the exclusion of an assumption as to future compensation levels.
The PBO, ABO and fair value of plan assets for the Company’s pension plans with an ABO in excess of plan assets were $7.33 billion, $7.13 billion and $6.56 billion, respectively, as of December 31, 2020 and $6.73 billion, $6.62 billion and $5.79 billion, respectively, as of December 31, 2019. Included in the accrued benefit cost of the pension benefits are certain unfunded non-qualified plans with accrued benefit costs of $139 million and $137 million for 2020 and 2019, respectively.
Notes to Consolidated Financial Statements 2020 Form 10-K
| | | | | | | | | | | | | | | | | | | | | | | | | | | | | | | | | | | | | | | | | | | | | | | | | | | | | | | | |
Components of net cost (benefit) for pension and other postretirement plans |
| | For the years ended December 31, |
| | Pension benefits | | Postretirement benefits | | Total Pension and Postretirement Benefits |
| ($ in millions) | | 2020 | | 2019 | | 2018 | | 2020 | | 2019 | | 2018 | | 2020 | | 2019 | | 2018 |
| Service cost | | $ | 104 | | | $ | 117 | | | $ | 110 | | | $ | 4 | | | $ | 8 | | | $ | 7 | | | $ | 108 | | | $ | 125 | | | $ | 117 | |
| Interest cost | | 210 | | | 240 | | | 255 | | | 11 | | | 14 | | | 15 | | | 221 | | | 254 | | | 270 | |
| Expected return on plan assets | | (414) | | | (403) | | | (427) | | | — | | | — | | | — | | | (414) | | | (403) | | | (427) | |
| Amortization of prior service credit | | (54) | | | (56) | | | (56) | | | (10) | | | (3) | | | (21) | | | (64) | | | (59) | | | (77) | |
| Curtailment losses (gains) | | 10 | | | — | | | — | | | (8) | | | — | | | — | | | 2 | | | — | | | — | |
| Costs and expenses | | (144) | | | (102) | | | (118) | | | (3) | | | 19 | | | 1 | | | (147) | | | (83) | | | (117) | |
| Remeasurement of projected benefit obligation | | 813 | | | 927 | | | (255) | | | 22 | | | 19 | | | (4) | | | 835 | | | 946 | | | (259) | |
| Remeasurement of plan assets | | (886) | | | (832) | | | 727 | | | — | | | — | | | — | | | (886) | | | (832) | | | 727 | |
| Remeasurement (gains) losses | | (73) | | | 95 | | | 472 | | | 22 | | | 19 | | | (4) | | | (51) | | | 114 | | | 468 | |
| Total net (benefit) cost | | $ | (217) | | | $ | (7) | | | $ | 354 | | | $ | 19 | | | $ | 38 | | | $ | (3) | | | $ | (198) | | | $ | 31 | | | $ | 351 | |
The service cost component is the actuarial present value of the benefits attributed by the plans’ benefit formula to services rendered by the employees during the period.
Interest cost is the increase in the PBO in the period due to the passage of time at the discount rate.
Interest cost fluctuates as the discount rate changes and is also impacted by the related change in the size of the PBO.
The expected return on plan assets is determined as the product of the expected long-term rate of return on plan assets and the fair value of plan assets.
Pension and other postretirement service cost,
interest cost, expected return on plan assets, amortization of prior service credit and curtailment gains and losses are reported in property and casualty insurance claims and claims expense, operating costs and expenses, net investment income and (if applicable) restructuring and related charges on the Consolidated Statements of Operations.
Remeasurement gains and losses relate to changes in discount rates, the differences between actual return on plan assets and the expected long-term rate of return on plan assets, and differences between actual plan experience and actuarial assumptions.
| | | | | | | | | | | | | | | | | | | | | | | | | | | | | | | | | | | | | | |
Weighted average assumptions used to determine net pension cost and net postretirement benefit cost |
| | For the years ended December 31, |
| | Pension benefits | | Postretirement benefits |
| | 2020 | | 2019 | | 2018 | | 2020 | | 2019 | | 2018 |
| Discount rate | | 3.00 | % | | 3.70 | % | | 4.06 | % | | 2.99 | % | | 3.61 | % | | 3.95 | % |
| | | | | | | | | | | | |
| Expected long-term rate of return on plan assets | | 7.08 | | | 7.34 | | | 7.33 | | | n/a | | n/a | | n/a |
| | | | | | | | | | | | | | | | | | | | | | | | | | |
Weighted average assumptions used to determine benefit obligations |
| | For the years ended December 31, |
| | Pension benefits | | Postretirement benefits |
| | 2020 | | 2019 | | 2020 | | 2019 |
| Discount rate | | 2.51 | % | | 3.31 | % | | 2.39 | % | | 3.27 | % |
| | | | | | | | |
The weighted average health care cost trend rate used in measuring the accumulated postretirement benefit cost is 6.8% for 2021, gradually declining to 4.5% in 2035 and remaining at that level thereafter.
Pension plan assets In general, the Company’s pension plan assets are managed in accordance with investment policies approved by pension investment committees. The purpose of the policies is to ensure the plans’ long-term ability to meet benefit obligations by prudently investing plan assets and Company contributions, while taking into consideration regulatory and legal requirements and current market conditions. The investment policies are reviewed periodically and specify target plan asset allocation by asset category. In addition, the policies specify various asset allocation and other risk limits. The target asset allocation takes the plans’ funding status into
consideration, among other factors, including anticipated demographic changes or liquidity requirements that may affect the funding status such as the potential impact of lump sum settlements as well as existing or expected market conditions. In general, the allocation has a lower overall investment risk when a plan is in a stronger funded status position since there is less economic incentive to take risk to increase the expected returns on the plan assets. The pension plans’ asset exposure within each asset category is tracked against widely accepted established benchmarks for each asset class with limits on variation from the benchmark established in the investment policy. Pension plan assets are regularly monitored for compliance with these limits and other risk limits specified in the investment policies.
The Allstate Corporation 203
2020 Form 10-K Notes to Consolidated Financial Statements
| | | | | | | | | | | | | | | | | | | | |
Weighted average target asset allocation and actual percentage of plan assets by asset category |
| | As of December 31, 2020 |
| | Target asset allocation (1) | | Actual percentage of plan assets |
| Pension plan’s asset category | | 2020 | | 2020 | | 2019 |
Equity securities (2) | | 43 - 62% | | 50 | % | | 50 | % |
| Fixed income securities | | 33 - 45 | | 38 | | | 38 | |
| Limited partnership interests | | — - 15 | | 10 | | | 10 | |
| Short-term investments and other | | — | | | 2 | | | 2 | |
Total without securities lending (3) | | | | 100 | % | | 100 | % |
(1)The target asset allocation considers risk-based exposure while the actual percentage of plan assets utilizes a financial reporting view excluding exposure provided through derivatives.
(2)The actual percentage of plan assets for equity securities includes zero and 1% of private equity investments in 2020 and 2019, respectively, that are subject to the limited partnership interests target allocation and 1% and zero of fixed income mutual funds in 2020 and 2019, respectively, that are subject to the fixed income securities target allocation.
(3)Securities lending collateral reinvestment of $101 million and $258 million is excluded from the table above in 2020 and 2019, respectively.
The target asset allocation for an asset category may be achieved either through direct investment holdings, through replication using derivative instruments (e.g., futures or swaps) or net of hedges using derivative instruments to reduce exposure to an asset category. The net notional amount of derivatives used for replication and non-hedging strategies is limited to 115% of total plan assets. Market performance of the different asset categories may, from time to time, cause deviation from the target
asset allocation. The asset allocation mix is reviewed on a periodic basis and rebalanced to bring the allocation within the target ranges.
Outside the target asset allocation, the pension plans participate in a securities lending program to enhance returns. As of December 31, 2020, fixed income and equity securities are lent out and cash collateral is invested in short-term investments.
Notes to Consolidated Financial Statements 2020 Form 10-K
| | | | | | | | | | | | | | | | | | | | | | | | | | |
Fair values of pension plan assets as of December 31, 2020 |
| | | | | | | | |
| ($ in millions) | | Quoted prices in active markets for identical assets (Level 1) | | Significant other observable inputs (Level 2) | | Significant unobservable inputs (Level 3) | | Balance as of December 31, 2020 |
| Equity securities | | $ | 227 | | | $ | 42 | | | $ | — | | | $ | 269 | |
| Fixed income securities: | | | | | | | | |
| U.S. government and agencies | | 32 | | | 865 | | | — | | | 897 | |
| | | | | | | | |
| | | | | | | | |
| Corporate | | — | | | 1,709 | | | 2 | | | 1,711 | |
| | | | | | | | |
| Short-term investments | | 210 | | | 35 | | | — | | | 245 | |
| | | | | | | | |
| | | | | | | | |
| | | | | | | | |
| | | | | | | | |
| | | | | | | | |
| Free-standing derivatives: | | | | | | | | |
| Assets | | — | | | 21 | | | — | | | 21 | |
| Liabilities | | (2) | | | (21) | | | — | | | (23) | |
| Other assets | | 2 | | | — | | | — | | | 2 | |
| Total plan assets at fair value | | $ | 469 | | | $ | 2,651 | | | $ | 2 | | | 3,122 | |
| % of total plan assets at fair value | | 15.0 | % | | 84.9 | % | | 0.1 | % | | 100.0 | % |
| | | | | | | | |
| Investments measured using the net asset value practical expedient | | | | | | | | 3,908 | |
Securities lending obligation (1) | | | | | | | | (101) | |
| Derivatives counterparty and cash collateral netting | | | | | | | | (19) | |
Other net plan assets (2) | | | | | | | | 77 | |
| Total reported plan assets | | | | | | | | $ | 6,987 | |
(1)The securities lending obligation represents the plan’s obligation to return securities lending collateral received under a securities lending program. The terms of the program allow both the plan and the counterparty the right and ability to redeem/return the securities loaned on short notice. Due to its relatively short-term nature, the outstanding balance of the obligation approximates fair value.
(2)Other net plan assets represent cash and cash equivalents, interest and dividends receivable and net receivables related to settlements of investment transactions, such as purchases and sales.
| | | | | | | | | | | | | | | | | | | | | | | | | | |
Fair values of pension plan assets as of December 31, 2019 |
| | | | | | | | |
| ($ in millions) | | Quoted prices in active markets for identical assets (Level 1) | | Significant other observable inputs (Level 2) | | Significant unobservable inputs (Level 3) | | Balance as of December 31, 2019 |
| Equity securities | | $ | 216 | | | $ | 45 | | | $ | — | | | $ | 261 | |
| Fixed income securities: | | | | | | | | |
| U.S. government and agencies | | 237 | | | 1,096 | | | — | | | 1,333 | |
| | | | | | | | |
| | | | | | | | |
| Corporate | | — | | | 1,060 | | | — | | | 1,060 | |
| | | | | | | | |
| Short-term investments | | 128 | | | 252 | | | — | | | 380 | |
| | | | | | | | |
| | | | | | | | |
| | | | | | | | |
| | | | | | | | |
| | | | | | | | |
| Free-standing derivatives: | | | | | | | | |
| Assets | | — | | | 5 | | | — | | | 5 | |
| Liabilities | | (2) | | | (17) | | | — | | | (19) | |
| Total plan assets at fair value | | $ | 579 | | | $ | 2,441 | | | $ | — | | | 3,020 | |
| % of total plan assets at fair value | | 19.2 | % | | 80.8 | % | | — | % | | 100.0 | % |
| | | | | | | | |
| Investments measured using the net asset value practical expedient | | | | | | | | 3,418 | |
| Securities lending obligation | | | | | | | | (272) | |
| Derivatives counterparty and cash collateral netting | | | | | | | | 9 | |
| Other net plan assets | | | | | | | | 17 | |
| Total reported plan assets | | | | | | | | $ | 6,192 | |
The fair values of pension plan assets are estimated using the same methodologies and inputs as those used to determine the fair values for the respective asset category of the Company. These methodologies and inputs are disclosed in Note 6.
The Allstate Corporation 205
2020 Form 10-K Notes to Consolidated Financial Statements
| | | | | | | | | | | | | | | | | | | | | | | | | | | | | | | | | | | | | | |
Rollforward of Level 3 plan assets during December 31, 2020 |
| | | | Actual return on plan assets: | | | | | | |
| ($ in millions) | | Balance as of December 31, 2019 | | Relating to assets sold during the period | | Relating to assets still held at the reporting date | | Purchases, sales and settlements, net | | Net transfers in (out) of Level 3 | | Balance as of December 31, 2020 |
| | | | | | | | | | | | |
| Fixed income securities: | | | | | | | | | | | | |
| | | | | | | | | | | | |
| Corporate | | $ | — | | | $ | — | | | $ | — | | | $ | 2 | | | $ | — | | | $ | 2 | |
| | | | | | | | | | | | |
| | | | | | | | | | | | |
| | | | | | | | | | | | |
| | | | | | | | | | | | |
| Total Level 3 plan assets | | $ | — | | | $ | — | | | $ | — | | | $ | 2 | | | $ | — | | | $ | 2 | |
| | | | | | | | | | | | | | | | | | | | | | | | | | | | | | | | | | | | | | |
Rollforward of Level 3 plan assets during December 31, 2019 |
| | | | Actual return on plan assets: | | | | | | |
| ($ in millions) | | Balance as of December 31, 2018 | | Relating to assets sold during the period | | Relating to assets still held at the reporting date | | Purchases, sales and settlements, net | | Net transfers in (out) of Level 3 | | Balance as of December 31, 2019 |
| | | | | | | | | | | | |
| Fixed income securities: | | | | | | | | | | | | |
| | | | | | | | | | | | |
| Corporate | | $ | 5 | | | $ | — | | | $ | — | | | $ | (5) | | | $ | — | | | $ | — | |
| | | | | | | | | | | | |
| | | | | | | | | | | | |
| | | | | | | | | | | | |
| | | | | | | | | | | | |
| Total Level 3 plan assets | | $ | 5 | | | $ | — | | | $ | — | | | $ | (5) | | | $ | — | | | $ | — | |
| | | | | | | | | | | | | | | | | | | | | | | | | | | | | | | | | | | | | | |
| Rollforward of Level 3 plan assets during December 31, 2018 |
| | | | Actual return on plan assets: | | | | | | |
| ($ in millions) | | Balance as of December 31, 2017 | | Relating to assets sold during the period | | Relating to assets still held at the reporting date | | Purchases, sales and settlements, net | | Net transfers in (out) of Level 3 | | Balance as of December 31, 2018 |
| Equity securities | | $ | 29 | | | $ | — | | | $ | 3 | | | $ | — | | | $ | (32) | | | $ | — | |
| Fixed income securities: | | | | | | | | | | | | |
| | | | | | | | | | | | |
| Corporate | | 10 | | | — | | | — | | | (5) | | | — | | | 5 | |
| | | | | | | | | | | | |
| | | | | | | | | | | | |
| | | | | | | | | | | | |
| | | | | | | | | | | | |
| Total Level 3 plan assets | | $ | 39 | | | $ | — | | | $ | 3 | | | $ | (5) | | | $ | (32) | | | $ | 5 | |
The expected long-term rate of return on plan assets reflects the average rate of earnings expected on plan assets. The Company’s assumption for the expected long-term rate of return on plan assets is evaluated annually giving consideration to appropriate data including, but not limited to, the plan asset allocation, forward-looking expected returns for the period over which benefits will be paid, historical returns on plan assets and other relevant market data. Given the long-term forward-looking nature of this assumption, the actual returns in any one year do not immediately result in a change to the expected long-term rate of return on plan assets. In consideration of the targeted plan asset allocation, the Company evaluated expected returns using sources including historical average asset class returns from independent nationally recognized providers of this type of data blended together using the asset allocation policy weights for the Company’s pension plans; asset class return forecasts developed by employees with relevant expertise in such forecasts and who are independent from those charged with managing the pension plan assets; and expected portfolio returns from a proprietary simulation methodology of a widely recognized external
investment consulting firm that performs asset allocation and actuarial services for corporate pension plan sponsors. The above sources support the Company’s weighted average long-term rate of return on plan assets assumption of 7.08% used for 2020 and an estimate of 7.06% that will be used for 2021. As of the 2020 measurement date, the arithmetic average of the annual actual return on plan assets for the most recent 10 and 5 years was 11.1% and 14.4%, respectively.
Cash flows There was no required cash contribution necessary to satisfy the minimum funding requirement under the IRC for the tax qualified pension plan for the year ended December 31, 2020.
The Company currently plans to contribute $24 million to its unfunded non-qualified plans and zero and $4 million to its primary and other qualified funded pension plans, respectively, in 2021.
The Company contributed $23 million and $24 million to the postretirement benefit plans in 2020 and 2019, respectively. Contributions by participants were $14 million and $15 million in 2020 and 2019, respectively.
Notes to Consolidated Financial Statements 2020 Form 10-K
| | | | | | | | | | | | | | |
Estimated future benefit payments expected to be paid in the next 10 years |
| | As of December 31, 2020 |
| ($ in millions) | | Pension benefits | | Postretirement benefits |
| 2021 | | $ | 710 | | | $ | 25 | |
| 2022 | | 741 | | | 27 | |
| 2023 | | 733 | | | 27 | |
| 2024 | | 726 | | | 27 | |
| 2025 | | 694 | | | 26 | |
| 2026-2030 | | 2,320 | | | 98 | |
| Total benefit payments | | $ | 5,924 | | | $ | 230 | |
Allstate 401(k) Savings Plan
Employees of the Company, with the exception of those employed by the Company’s international, SquareTrade and InfoArmor subsidiaries, are eligible to become members of the Allstate 401(k) Savings Plan (“Allstate Plan”). The Company’s contributions are based on the Company’s matching obligation. The Company is responsible for funding its contribution to the Allstate Plan.
The Company’s contribution to the Allstate Plan was $103 million, $93 million and $89 million in 2020, 2019 and 2018, respectively. In 2019 and 2018, these amounts were reduced by $41 million and $2 million of ESOP benefit, respectively.
Prior to 2020, the Allstate Plan had a leveraged ESOP to fund a portion of the anticipated contribution. The ESOP note matured on December 31, 2019 and the remaining principal balance of $2 million was repaid and all shares held by the ESOP have been released.
Allstate’s Canadian, SquareTrade and InfoArmor subsidiaries sponsor defined contribution plans for their eligible employees. Effective January 1, 2020 and July 10, 2020, Answer Financial and Esurance employees are included in the Allstate Plan, respectively. Expense for subsidiary sponsored defined contribution plans was $13 million, $15 million and $15 million in 2020, 2019 and 2018, respectively.
The Allstate Corporation 207
2020 Form 10-K Notes to Consolidated Financial Statements
| | | | | |
| Note 18 | Equity Incentive Plans |
The Company currently has equity incentive plans under which it grants nonqualified stock options, restricted stock units and performance stock awards to certain employees and directors of the Company.
| | | | | | | | | | | | | | | | | | | | |
Equity awards |
| ($ in millions) | | 2020 | | 2019 | | 2018 |
| Compensation expense | | $ | 124 | | | $ | 105 | | | $ | 125 | |
| Income tax benefits | | 18 | | | 17 | | | 22 | |
| Cash received from exercise of options | | 111 | | | 154 | | | 92 | |
| Tax benefit realized on options exercised and release of stock restrictions | | 53 | | | 43 | | | 28 | |
| | | | | | |
The Company records compensation expense related to awards under these plans over the shorter of the period in which the requisite service is rendered or retirement eligibility is attained. Compensation expense for performance stock awards with no market condition is based on the probable number of awards expected to vest using the performance level most likely to be achieved at the end of the performance period. Compensation expense for performance stock awards with a market condition is based on the number of awards expected to vest as estimated at the grant date and does not change if the market condition is not met.
| | | | | | | | | | | | | | | | |
Nonvested awards as of December 31, 2020 |
| ($ in millions) | | Unrecognized compensation | | Weighted average vesting period | | |
| Nonqualified stock options | | $ | 21 | | | 1.49 years | | |
| Restricted stock units | | 33 | | | 1.85 years | | |
| Performance stock awards | | 28 | | | 1.44 years | | |
| Total | | $ | 82 | | | | | |
Options are granted to employees with exercise prices equal to the closing share price of the Company’s common stock on the applicable grant date. Options granted to employees on or after February 18, 2014 vest ratably over a three-year period. Options granted prior to February 18, 2014 vest 50% on the second anniversary of the grant date and 25% on each of the third and fourth anniversaries of the grant date. Vesting is subject to continued service, except for employees who are retirement eligible and in certain other limited circumstances. Options may be exercised once vested and will expire no later than ten years after the date of grant.
Restricted stock units for directors vest immediately and convert into shares of stock on the earlier of the day of the third anniversary of the grant
date or the date the director’s service terminates, unless a deferred period of restriction is elected. Restricted stock units granted to directors prior to June 1, 2016 convert upon leaving the board. Restricted stock units granted to employees prior to February 19, 2020 vest on the day prior to the third anniversary of the grant date. Restricted stock units granted to employees on or after February 19, 2020 vest ratably over a three-year period. Restricted stock units granted to employees subsequently convert into shares of stock on the day of the respective anniversary of the grant date. Vesting is subject to continued service, except for employees who are retirement eligible and in certain other limited circumstances.
Performance stock awards vest into shares of stock based on achieving established company-specific performance goals. Performance stock awards granted prior to February 19, 2020 vest into shares of stock on the day prior to the third anniversary of the grant date. Performance stock awards granted on or after February 19, 2020 vest into shares of stock on the third anniversary of the grant date.
The numbers of shares earned upon vesting of the performance stock awards is based on the attainment of performance goals for each of the performance periods, subject to continued service, except for employees who are retirement eligible and in certain other limited circumstances.
Since 2001, a total of 110.8 million shares of common stock were authorized to be used for awards under the plans, subject to adjustment in accordance with the plans’ terms. As of December 31, 2020, 20.9 million shares were reserved and remained available for future issuance under these plans. The Company uses its treasury shares for these issuances.
The fair value of each option grant is estimated on the date of grant using a binomial lattice model. The Company uses historical data to estimate option exercise and employee termination within the valuation model. In addition, separate groups of employees that have similar historical exercise behavior are considered separately for valuation purposes. The expected term of options granted is derived from the output of the binomial lattice model and represents the period of time that options granted are expected to be outstanding. The expected volatility of the price of the underlying shares is implied based on traded options and historical volatility of the Company’s common stock. The expected dividends were based on the current dividend yield of the Company’s stock as of the date of the grant. The risk-free rate for periods within the contractual life of the option is based on the U.S. Treasury yield curve in effect at the time of grant.
Notes to Consolidated Financial Statements 2020 Form 10-K
| | | | | | | | | | | | | | | | | | | | |
Option grant assumptions |
| | 2020 | | 2019 | | 2018 |
| Weighted average expected term | | 6.1 years | | 5.8 years | | 5.7 years |
| Expected volatility | | 16.3% - 37.1% | | 15.6% - 28.9% | | 15.6% - 30.7% |
| Weighted average volatility | | 17.6 | % | | 18.4 | % | | 19.8 | % |
| Expected dividends | | 1.6% - 2.4% | | 1.9% - 2.2% | | 1.5% - 2.2% |
| Weighted average expected dividends | | 1.8 | % | | 2.2 | % | | 2.0 | % |
| Risk-free rate | | 0.1% - 1.8% | | 1.3% - 2.7% | | 1.3% - 3.2% |
| | | | | | | | | | | | | | | | | | | | | | | | | | |
Summary of option activity |
| | For the year ended December 31, 2020 |
| | Number (in 000s) | | Weighted average exercise price | | Aggregate intrinsic value (in 000s) | | Weighted average remaining contractual term (years) |
| Outstanding as of January 1, 2020 | | 11,671 | | | $ | 73.40 | | | | | |
| Granted | | 1,555 | | | 123.43 | | | | | |
| Exercised | | (2,201) | | | 53.75 | | | | | |
| Forfeited | | (394) | | | 104.18 | | | | | |
| Expired | | (14) | | | 81.21 | | | | | |
| Outstanding as of December 31, 2020 | | 10,617 | | | 83.65 | | | $ | 298,537 | | | 6.1 |
| Outstanding, net of expected forfeitures | | 10,543 | | | 83.46 | | | 297,990 | | | 6.1 |
| Outstanding, exercisable (“vested”) | | 6,907 | | | 72.51 | | | 258,510 | | | 5.0 |
The weighted average grant date fair value of options granted was $18.17, $14.96 and $17.03 during 2020, 2019 and 2018, respectively. The intrinsic value, which is the difference between the fair value and the exercise price, of options exercised was $119 million, $114 million and $72 million during 2020, 2019 and 2018, respectively.
| | | | | | | | | | | | | | |
Changes in restricted stock units |
| | For the year ended December 31, 2020 |
| | Number (in 000s) | | Weighted average grant date fair value |
| Nonvested as of January 1, 2020 | | 877 | | | $ | 83.87 | |
| Granted | | 407 | | | 118.61 | |
| Vested | | (278) | | | 80.10 | |
| Forfeited | | (58) | | | 105.03 | |
| Nonvested as of December 31, 2020 | | 948 | | | 98.61 | |
The fair value of restricted stock units is based on the market value of the Company’s stock as of the date of the grant. The market value in part reflects the payment of future dividends expected. The weighted average grant date fair value of restricted stock units granted was $118.61, $92.97 and $93.16 during 2020, 2019 and 2018, respectively. The total fair value of restricted stock units vested was $32 million, $29 million and $47 million during 2020, 2019 and 2018, respectively.
The Allstate Corporation 209
2020 Form 10-K Notes to Consolidated Financial Statements
| | | | | | | | | | | | | | |
Changes in performance stock awards |
| | For the year ended December 31, 2020 |
| | Number (in 000s) | | Weighted average grant date fair value |
| Nonvested as of January 1, 2020 | | 1,181 | | | $ | 87.78 | |
| Granted | | 282 | | | 123.48 | |
| Adjustment for performance achievement | | 408 | | | 78.49 | |
| Vested | | (816) | | | 78.49 | |
| Forfeited | | (104) | | | 101.10 | |
| Nonvested as of December 31, 2020 | | 951 | | | 100.89 | |
The change in performance stock awards comprises those initially granted in 2020 and the adjustment to previously granted performance stock awards for performance achievement.
The fair value of performance stock awards that do not include a market condition is based on the market value of the Company’s stock as of the date of the grant.
Starting with the February 2020 award, the fair value of performance stock awards includes a component with market-based condition measured on the grant date using a Monte Carlo simulation model. Market-based condition measures the Company’s total shareholder return (“TSR”) relative to the TSR of peer companies, expressed in terms of the Company’s TSR percentile rank among the peer companies, over a three-calendar-year performance period. The Monte Carlo simulation model uses a risk-neutral framework to model future stock price movements based upon the risk-free rate of return at the time of grant,
volatilities of the Company and the peer companies, and expected term assumed to be equal to the remaining measurement period. The market value in part reflects the payment of future dividends expected.
For the year ended December 31, 2020, the 2020 performance stock awards with market-based condition assumes a risk-free rate of 1.4%, volatility of 16.9%, average peer volatility of 35.1% and an expected term of 2.9 years.
The weighted average grant date fair value of performance stock awards granted was $123.48, $92.49 and $92.88 during 2020, 2019 and 2018, respectively. The total fair value of performance stock awards vested was $101 million, $65 million and $15 million during 2020, 2019 and 2018, respectively.
The Company recognizes all tax effects related to share-based payments at settlement or expiration through the income statement.
| | | | | |
| Note 19 | Supplemental Cash Flow Information |
Non-cash investing activities include $61 million, $198 million and $94 million related to mergers and exchanges completed with equity securities, fixed income securities and limited partnerships, and modifications of certain mortgage loans and other investments in 2020, 2019 and 2018, respectively.
Non-cash financing activities include $56 million, $50 million and $32 million related to the issuance of Allstate common shares for vested equity awards in 2020, 2019 and 2018, respectively.
Cash flows used in operating activities in the Consolidated Statements of Cash Flows include cash paid for operating leases related to amounts included in the measurement of lease liabilities of $156 million and $155 million for the twelve months ended December 31, 2020 and 2019, respectively. Non-cash operating activities include $51 million and $604 million
related to ROU assets obtained in exchange for lease obligations for the twelve months ended December 31, 2020 and 2019, respectively. Non-cash operating activities related to ROU assets obtained in exchange for lease obligations for twelve months ended December 31, 2019 include the impact of $488 million related to the adoption of the accounting for leases standard.
Liabilities for collateral received in conjunction with the Company’s securities lending program and OTC and cleared derivatives are reported in other liabilities and accrued expenses or other investments. The accompanying cash flows are included in cash flows from operating activities in the Consolidated Statements of Cash Flows along with the activities resulting from management of the proceeds as follows:
Notes to Consolidated Financial Statements 2020 Form 10-K
| | | | | | | | | | | | | | | | | | | | |
| | For the years ended December 31, |
| ($ in millions) | | 2020 | | 2019 | | 2018 |
| | | | | | |
| Net change in proceeds managed | | | | | | |
| Net change in fixed income securities | | $ | — | | | $ | 80 | | | $ | 234 | |
| Net change in short-term investments | | 592 | | | (451) | | | (568) | |
| Operating cash flow provided (used) | | 592 | | | (371) | | | (334) | |
| Net change in cash | | (12) | | | — | | | — | |
| Net change in proceeds managed | | $ | 580 | | | $ | (371) | | | $ | (334) | |
| | | | | | |
| | | | | | |
| Net change in liabilities | | | | | | |
| Liabilities for collateral, beginning of year | | $ | (1,829) | | | $ | (1,458) | | | $ | (1,124) | |
| Liabilities for collateral, end of year | | (1,249) | | | (1,829) | | | (1,458) | |
| Operating cash flow (used) provided | | $ | (580) | | | $ | 371 | | | $ | 334 | |
| | | | | |
| Note 20 | Other Comprehensive Income |
| | | | | | | | | | | | | | | | | | | | | | | | | | | | | | | | | | | | | | | | | | | | | | | | | | | | | | | | |
Components of other comprehensive income (loss) on a pre-tax and after-tax basis |
| | For the years ended December 31, |
| | 2020 | | 2019 | | 2018 |
| ($ in millions) | | Pre-tax | | Tax | | After-tax | | Pre-tax | | Tax | | After-tax | | Pre-tax | | Tax | | After-tax |
| Unrealized net holding gains and losses arising during the period, net of related offsets | | $ | 2,512 | | | $ | (532) | | | $ | 1,980 | | | $ | 2,807 | | | $ | (592) | | | $ | 2,215 | | | $ | (1,142) | | | $ | 241 | | | $ | (901) | |
| Less: reclassification adjustment of realized capital gains and losses | | 870 | | | (183) | | | 687 | | | 413 | | | (87) | | | 326 | | | (186) | | | 39 | | | (147) | |
| Unrealized net capital gains and losses | | 1,642 | | | (349) | | | 1,293 | | | 2,394 | | | (505) | | | 1,889 | | | (956) | | | 202 | | | (754) | |
| Unrealized foreign currency translation adjustments | | 66 | | | (14) | | | 52 | | | (13) | | | 3 | | | (10) | | | (61) | | | 13 | | | (48) | |
| | | | | | | | | | | | | | | | | | |
| | | | | | | | | | | | | | | | | | |
Unamortized pension and other postretirement prior service credit (1) | | 12 | | | (3) | | | 9 | | | (59) | | | 12 | | | (47) | | | (77) | | | 18 | | | (59) | |
| Other comprehensive income (loss) | | $ | 1,720 | | | $ | (366) | | | $ | 1,354 | | | $ | 2,322 | | | $ | (490) | | | $ | 1,832 | | | $ | (1,094) | | | $ | 233 | | | $ | (861) | |
(1)Represents prior service credits reclassified out of other comprehensive income and amortized into operating costs and expenses.
| | | | | |
| Note 21 | Quarterly Results (unaudited) |
| | | | | | | | | | | | | | | | | | | | | | | | | | | | | | | | | | | | | | | | | | | | | | | | | | |
| | First Quarter | | Second Quarter | | Third Quarter | | Fourth Quarter |
| ($ in millions, except per share data) | | 2020 | | 2019 | | 2020 | | 2019 | | 2020 | | 2019 | | 2020 | | 2019 |
| Revenues | | $ | 10,076 | | | $ | 10,990 | | | $ | 11,197 | | | $ | 11,144 | | | $ | 11,500 | | | $ | 11,069 | | | $ | 12,018 | | | $ | 11,472 | |
| Net income (loss) applicable to common shareholders | | 513 | | | 1,261 | | | 1,224 | | | 821 | | | 1,126 | | | 889 | | | 2,598 | | | 1,707 | |
| Earnings per common share - Basic | | 1.62 | | | 3.79 | | | 3.90 | | | 2.47 | | | 3.62 | | | 2.71 | | | 8.54 | | | 5.32 | |
| Earnings per common share - Diluted | | 1.59 | | | 3.74 | | | 3.86 | | | 2.44 | | | 3.58 | | | 2.67 | | | 8.45 | | | 5.23 | |
| | | | | | | | | | | | | | | | |
| | | | | | | | |
| | | | | | | | | | | | | | | | |
| | | | | | | | | | | | | | | | |
| | | | | | | | | | | | | | | | |
| | | | | | | | | | | | | | | | |
| | | | | | | | | | | | | | | | |
| | | | | | | | | | | | | | | | |
| | | | | | | | | | | | | | | | |
| | | | | | | | |
| | | | | | | | | | | | | | | | |
| | | | | | | | | | | | | | | | |
| | | | | | | | | | | | | | | | |
| | | | | | | | | | | | | | | | |
| | | | | | | | | | | | | | | | |
The Allstate Corporation 211
Report of Independent Registered Public Accounting Firm
To the Board of Directors and Shareholders of
The Allstate Corporation
Northbrook, Illinois 60062
Opinions on the Financial Statements and Internal Control over Financial Reporting
We have audited the accompanying Consolidated Statements of Financial Position of The Allstate Corporation and subsidiaries (the “Company”) as of December 31, 2020 and 2019, the related Consolidated Statements of Operations, Comprehensive Income, Shareholders’ Equity, and Cash Flows for each of the three years in the period ended December 31, 2020, and the related notes and the schedules listed in the Index at Item 15 (collectively referred to as the "financial statements"). We also have audited the Company’s internal control over financial reporting as of December 31, 2020, based on criteria established in Internal Control – Integrated Framework (2013) issued by the Committee of Sponsoring Organizations of the Treadway Commission (“COSO”).
In our opinion, the financial statements referred to above present fairly, in all material respects, the financial position of the Company as of December 31, 2020 and 2019, and the results of its operations and its cash flows for each of the three years in the period ended December 31, 2020, in conformity with accounting principles generally accepted in the United States of America. Also, in our opinion, the Company maintained, in all material respects, effective internal control over financial reporting as of December 31, 2020, based on criteria established in Internal Control - Integrated Framework (2013) issued by the COSO.
Basis for Opinions
The Company’s management is responsible for these financial statements, for maintaining effective internal control over financial reporting, and for its assessment of the effectiveness of internal control over financial reporting, included in the accompanying Item 9A. Controls and Procedures. Our responsibility is to express an opinion on these financial statements and an opinion on the Company’s internal control over financial reporting based on our audits. We are a public accounting firm registered with the Public Company Accounting Oversight Board (United States) (“PCAOB”) and are required to be independent with respect to the Company in accordance with the U.S. federal securities laws and the applicable rules and regulations of the Securities and Exchange Commission and the PCAOB.
We conducted our audits in accordance with the standards of the PCAOB. Those standards require that we plan and perform the audits to obtain reasonable assurance about whether the financial statements are free of material misstatement, whether due to error or fraud, and whether effective internal control over financial reporting was maintained in all material respects.
Our audits of the financial statements included performing procedures to assess the risks of material misstatement of the financial statements, whether due to error or fraud, and performing procedures to respond to those risks. Such procedures included examining, on a test basis, evidence regarding the amounts and disclosures in the financial statements. Our audits also included evaluating the accounting principles used and significant estimates made by management, as well as evaluating the overall presentation of the financial statements. Our audit of internal control over financial reporting included obtaining an understanding of internal control over financial reporting, assessing the risk that a material weakness exists, and testing and evaluating the design and operating effectiveness of internal control based on the assessed risk. Our audits also included performing such other procedures as we considered necessary in the circumstances. We believe that our audits provide a reasonable basis for our opinions.
Definition and Limitations of Internal Control over Financial Reporting
A company’s internal control over financial reporting is a process designed to provide reasonable assurance regarding the reliability of financial reporting and the preparation of financial statements for external purposes in accordance with generally accepted accounting principles. A company’s internal control over financial reporting includes those policies and procedures that (1) pertain to the maintenance of records that, in reasonable detail, accurately and fairly reflect the transactions and dispositions of the assets of the company; (2) provide reasonable assurance that transactions are recorded as necessary to permit preparation of financial statements in accordance with generally accepted accounting principles, and that receipts and expenditures of the company are being made only in accordance with authorizations of management and directors of the company; and (3) provide reasonable assurance regarding prevention or timely detection of unauthorized acquisition, use, or disposition of the company’s assets that could have a material effect on the financial statements.
Because of its inherent limitations, internal control over financial reporting may not prevent or detect misstatements. Also, projections of any evaluation of effectiveness to future periods are subject to the risk that controls may become inadequate because of changes in conditions, or that the degree of compliance with the policies or procedures may deteriorate.
Critical Audit Matters
The critical audit matters communicated below are matters arising from the current-period audit of the financial statements that were communicated or required to be communicated to the audit committee and that (1) relate to accounts or disclosures that are material to the financial statements and (2) involved our especially challenging, subjective, or complex judgments. The communication of critical audit matters does not alter in any way our opinion on the financial statements, taken as a whole, and we are not, by communicating the critical audit matters below, providing separate opinions on the critical audit matters or on the accounts or disclosures to which they relate.
Reserve for Property and Casualty Insurance Claims and Claims Expense - Refer to Notes 2 and 8 to the Financial Statements
Critical Audit Matter Description
As of December 31, 2020, the reserve for property and casualty insurance claims and claims expense was $27.6 billion. The Company establishes reserves for property and casualty insurance claims and claims expense on reported and unreported claims of insured losses. Using established industry and actuarial best practices as well as the Company’s historical claims experience, the reserve for property and casualty insurance claims and claims expense is estimated based on (i) claims reported, (ii) claims incurred but not reported, and (iii) projections of claim payments to be made in the future.
Given the subjectivity of estimating claims incurred but not reported and projections of claim payments to be made in the future, particularly those with payout requirements over a longer period of time, the related audit effort in evaluating the reserve for property and casualty insurance claims and claims expense required a high degree of auditor judgment and an increased extent of effort, including involvement of our actuarial specialists.
How the Critical Audit Matter Was Addressed in the Audit
Our principal audit procedures related to the reserve for property and casualty insurance claims and claims expense included the following:
•We tested the effectiveness of controls related to the reserve for property and casualty insurance claims and claims expense, including those over the Company’s estimates and projections.
•We evaluated the methods and assumptions used by the Company to estimate the reserve for property and casualty insurance claims and claims expense by:
–Testing the underlying data that served as the basis for the actuarial analysis, including historical claims, to test that the inputs to the actuarial estimate were complete and accurate.
–Comparing the Company’s prior year assumptions of expected development and ultimate loss to actual losses incurred during the year to assess the reasonableness of those assumptions, including consideration of potential bias, in the determination of the reserve for property and casualty claims and claims expense.
–With the assistance of our actuarial specialists, we developed independent estimates for the reserve for property and casualty insurance claims and claims expense, particularly related to those with payout requirements over a longer period of time, utilizing loss data and industry claim development factors, and compared our estimates to management’s estimates.
Reserve for Life-Contingent Contract Benefits and Premium Deficiency Reserve for Life-Contingent Immediate Annuities - Refer to Notes 2 and 9 to the Financial Statements.
Critical Audit Matter Description
As of December 31, 2020, the reserve for life-contingent contract benefits for Life-Contingent Immediate Annuities was $8.9 billion. Due to the long-term nature of life-contingent immediate annuities, benefits are payable over many years. The Company establishes reserves as the present value of future expected benefits to be paid, reduced by the present value of future expected net premiums. Long-term actuarial assumptions, such as future investment yields and mortality, are used when establishing the reserve. These assumptions are established at the time the contract is issued and are generally not changed during the life of the contract. The Company periodically performs a gross premium valuation (“GPV”) analysis to review the adequacy of reserves using actual experience and current assumptions. If actual experience and current assumptions are adverse compared to the original assumptions and a premium deficiency is determined to exist, any remaining unamortized deferred acquisition costs (“DAC”) balance would be expensed to the extent not recoverable, and the establishment of a premium deficiency reserve may be required for any remaining deficiency. During the year ended December 31, 2020, annuitants living longer than originally anticipated and lower long-term investment yield assumptions resulted in a premium deficiency. The deficiency was recognized as an increase in the reserve for life-contingent contract benefits and life contract benefits
The Allstate Corporation 213
of $225 million. The original assumptions used to establish reserves were updated to reflect current assumptions and the primary changes included mortality expectations and long-term investment yields.
The Company also reviews these policies for circumstances where projected profits would be recognized in early years followed by projected losses in later years through a profits followed by losses (“PFBL”) analysis. If this circumstance exists, the Company will accrue a liability, during the period of profits, to offset the losses at such time as the future losses are expected to commence using a method updated prospectively over time. The Company’s analyses did not indicate periods of profits followed by periods of losses; therefore, the Company has not established a PFBL reserve as of December 31, 2020.
Given the subjectivity involved in selecting the current assumptions for projected investment yields and mortality, the sensitivity of the estimate to these assumptions, and the establishment of a premium deficiency reserve, the related audit effort to evaluate the reserve for life-contingent contract benefits, the GPV, the resulting premium deficiency reserve, and the PFBL analysis for life-contingent immediate annuities required a high degree of auditor judgment and an increased extent of effort, including involvement of our actuarial specialists.
How the Critical Audit Matter Was Addressed in the Audit
Our principal audit procedures related to the reserve for life-contingent contract benefits and the premium deficiency reserve, including the GPV and PFBL analysis for life-contingent immediate annuities, included the following:
•We tested the effectiveness of controls over management’s reserve for life-contingent contract benefits, premium deficiency reserve, GPV, and PFBL analysis, including those over the Company’s selection of assumptions.
•With the assistance of our actuarial specialists, we evaluated the reasonableness of assumptions and their incorporation into the projection model used by the Company to perform its analysis by:
–Testing the underlying data that served as the basis for the assumptions setting and the underlying data used in the projection model to ensure the inputs were complete and accurate.
–Comparing mortality assumptions selected to actual historical experience.
–Comparing projected investment yields selected to historical portfolio returns, evaluating for consistency with current investment portfolio yields and the Company’s long-term reinvestment strategy, and comparing to independently obtained market data.
•With the assistance of our actuarial specialists, we independently calculated the GPV reserves from the Company’s projection model for a sample of contracts and compared our estimates to management’s estimates.
•With the assistance of our actuarial specialists, we evaluated the reasonableness of the total GPV reserve at the date the premium deficiency was determined by the Company and at year-end based on known changes to long-term investment yield assumptions and current market data.
•We agreed the recorded premium deficiency reserve amount to the Company’s GPV analysis.
•With the assistance of our actuarial specialists, we evaluated the aggregate cash flows generated through the Company’s premium deficiency reserve testing for evidence of potential PFBL scenarios that would require the accrual of additional reserves to cover such future losses.
/s/ Deloitte & Touche LLP
Chicago, Illinois
February 19, 2021
We have served as the Company's auditor since 1992.
Item 9. Changes in and Disagreements with Accountants on Accounting and Financial Disclosure
None.
Item 9A. Controls and Procedures
Evaluation of Disclosure Controls and Procedures. We maintain disclosure controls and procedures as defined in Rule 13a-15(e) under the Securities Exchange Act of 1934. Under the supervision and with the participation of our management, including our principal executive officer and principal financial officer, we conducted an evaluation of the effectiveness of our disclosure controls and procedures as of the end of the period covered by this report. Based upon this evaluation, the principal executive officer and the principal financial officer concluded that our disclosure controls and procedures are effective in providing reasonable assurance that material information required to be disclosed in our reports filed with or submitted to the Securities and Exchange Commission under the Securities Exchange Act is recorded, processed, summarized and reported within the time periods specified by the Securities Exchange Act and made known to management, including the principal executive officer and the principal financial officer, as appropriate to allow timely decisions regarding required disclosure.
Management’s Report on Internal Control over Financial Reporting. Management is responsible for establishing and maintaining adequate internal control over financial reporting as defined in Rule 13a-15(f) under the Securities Exchange Act of 1934.
Under the supervision and with the participation of our management, including our principal executive officer and principal financial officer, we conducted an evaluation of the effectiveness of our internal control over financial reporting as of December 31, 2020 based on the criteria related to internal control over financial reporting described in “Internal Control – Integrated Framework (2013)” issued by the Committee of Sponsoring Organizations of the Treadway Commission. Based on our evaluation, management concluded that our internal control over financial reporting was effective as of December 31, 2020.
Deloitte & Touche LLP, the independent registered public accounting firm that audited the consolidated financial statements included in this Form 10-K, has issued their attestation report on the Company’s internal control over financial reporting, which is included herein.
Changes in Internal Control over Financial Reporting. During the fiscal quarter ended December 31, 2020, there have been no changes in our internal control over financial reporting that have materially affected, or are reasonably likely to materially affect, our internal control over financial reporting.
Item 9B. Other Information
None.
The Allstate Corporation 215
Part III
Item 10. Directors, Executive Officers and Corporate Governance
Information regarding directors of The Allstate Corporation standing for election at the 2021 annual stockholders meeting is incorporated in this Item 10 by reference to the descriptions in the Proxy Statement under the caption “Corporate Governance – Director Nominees.”
Information regarding our audit committee and audit committee financial experts is incorporated in this Item 10 by reference to the information under the caption “Corporate Governance – Board Meetings and Committees” in the Proxy Statement.
Information regarding executive officers of The Allstate Corporation is incorporated in this Item 10 by reference to Part I, Item 1 of this report under the caption “Information about our Executive Officers.”
We have adopted a Global Code of Business Conduct that applies to all of our directors and employees, including our principal executive officer, principal financial officer and controller and principal accounting officer. The text of our Global Code of Business Conduct is posted on our website, www.allstateinvestors.com. We intend to satisfy the disclosure requirements, regarding amendments to, and waiver from, the provisions of our Global Code of Business Conduct by posting such information on the same website pursuant to applicable NYSE and SEC rules.
Item 11. Executive Compensation
Information required for Item 11 is incorporated by reference to the sections of the Proxy Statement with the following captions:
•Corporate Governance – Director Compensation
•Executive Compensation
Item 12. Security Ownership of Certain Beneficial Owners and Management and Related Stockholder Matters
Information regarding security ownership of certain beneficial owners and management is incorporated in this Item 12 by reference to the sections of the Proxy Statement with the following captions:
•Stock Ownership Information – Security Ownership of Directors and Executive Officers
•Stock Ownership Information – Security Ownership of Certain Beneficial Owners
| | | | | | | | | | | | | | | | | | | | | | | |
| Equity compensation plan information |
The following table includes information as of December 31, 2020, with respect to The Allstate Corporation’s equity compensation plans: |
| Plan Category | | Number of Securities to be Issued upon Exercise of Outstanding Options, Warrants and Rights | | Weighted-Average Exercise Price of Outstanding Options, Warrants and Rights | | Number of Securities Remaining Available for Future Issuance under Equity Compensation Plans (Excluding Securities Reflected in Column (a)) | |
| | (a) | | (b) | | (c) | |
Equity Compensation Plans Approved by Security Holders (1) | | 13,467,667 | | (2) | $ | 83.65 | | (3) | 18,860,595 | | (4) |
| Total | | 13,467,667 | | (2) | $ | 83.65 | | (3) | 18,860,595 | | (4) |
(1)Consists of the 2019 Equity Incentive Plan, which amended and restated the 2013 Equity Incentive Plan; the 2017 Equity Compensation Plan for Non-Employee Directors; the 2006 Equity Compensation Plan for Non-Employee Directors; and the Equity Incentive Plan for Non-Employee Directors (the equity plan for non-employee directors prior to 2006). The Corporation does not maintain any equity compensation plans not approved by stockholders.
(2)As of December 31, 2020, 948,256 restricted stock units (“RSUs”) and 1,902,902 performance stock awards (“PSAs”) were outstanding. PSAs are reported at the maximum potential amount awarded for incomplete performance periods and the amount earned for the 2018 PSA grant, reduced for forfeitures. For incomplete performance periods, the actual number of shares earned may be less and are based upon measures achieved at the end of the three-year performance period for those PSAs granted in 2019 and 2020.
(3)The weighted-average exercise price of outstanding options, warrants, and rights does not take into account RSUs and PSAs, which have no exercise price.
(4)Includes 18,527,692 shares that may be issued in the form of stock options, unrestricted stock, restricted stock, restricted stock units, stock appreciation rights, performance units, performance stock, and stock in lieu of cash under the 2019 Equity Incentive Plan; and 332,903 shares that may be issued in the form of stock options, unrestricted stock, restricted stock, restricted stock units, and stock in lieu of cash compensation under the 2017 Equity Compensation Plan for Non-Employee Directors.
Asset managers, such as those that manage mutual funds and exchange traded funds, principally on behalf of third-party investors, at times acquire sufficient voting ownership interests in Allstate to require disclosure. State Street Corp. manages an investment portfolio of $3.87 billion on behalf of participants in Allstate’s 401(k) Savings Plan and $2.32 billion on behalf of the Allstate domestic qualified pension plan. The terms of these arrangements are customary, and the aggregate related fees are not material.
Item 13. Certain Relationships and Related Transactions, and Director Independence
Information required for Item 13 is incorporated by reference to the material in the Proxy Statement under the captions “Corporate Governance – Board Independence and Related Person Transactions - Nominee Independence Determinations," “Corporate Governance – Board Independence and Related Person Transactions - Related Person Transactions” and “Other Information - Appendix B – Categorical Standards of Independence.”
Item 14. Principal Accounting Fees and Services
Information required for Item 14 is incorporated by reference to the material in the Proxy Statement under
the caption “Audit Committee Matters – Proposal 3 Ratification of Deloitte & Touche LLP as the Independent Registered Public Accountant for 2021.”
The Allstate Corporation 217
Part IV
Item 15. (a) (1) Exhibits and Financial Statement Schedules.
The following consolidated financial statements, notes thereto and related information of The Allstate Corporation (the “Company”) are included in Item 8.
•Consolidated Statements of Operations
•Consolidated Statements of Comprehensive Income
•Consolidated Statements of Financial Position
•Consolidated Statements of Shareholders’ Equity
•Consolidated Statements of Cash Flows
•Notes to the Consolidated Financial Statements
•Report of Independent Registered Public Accounting Firm
Item 15. (a) (2)
The following additional financial statement schedules are furnished herewith pursuant to the requirements of Form 10-K.
| | | | | | | | | | | | | | |
| The Allstate Corporation | | Page |
| | | | |
| Schedules required to be filed under the provisions of Regulation S-X Article 7: |
| | | | |
| | | | |
| | | | |
| | | | |
| | | | |
| | | | |
| | | | |
| | |
All other schedules are omitted because they are not applicable, or not required, or because the required information is included in the Consolidated Financial Statements or notes thereto.
Item 15. (a) (3)
The following is a list of the exhibits filed as part of this Form 10-K. The exhibit numbers followed by an asterisk (*) indicate exhibits that are management contracts or compensatory plans or arrangements.
| | | | | | | | | | | | | | | | | | | | |
| | Incorporated by Reference | |
Exhibit Number | Exhibit Description | Form | File Number | Exhibit | Filing Date | Filed or Furnished Herewith |
| 2.1 | | 8-K | 1-11840 | 2.1 | July 8, 2020 | |
| 2.2 | | 8-K | 1-11840 | 2.1 | January 27, 2021 | |
| 3.1 | | 8-K | 1-11840 | 3(i) | May 23, 2012 | |
| 3.2 | | 8-K | 1-11840 | 3.1 | November 19, 2015 | |
| 3.3 | | 8-K | 1-11840 | 3.1 | March 29, 2018 | |
| 3.4 | | 8-K | 1-11840 | 3.1 | August 5, 2019 | |
| | | | | | | | | | | | | | | | | | | | |
| | Incorporated by Reference | |
Exhibit Number | Exhibit Description | Form | File Number | Exhibit | Filing Date | Filed or Furnished Herewith |
| 3.5 | | 8-K | 1-11840 | 3.1 | November 8, 2019 | |
| 3.6 | | 10-K | 1-11840 | 3.6 | February 21, 2020 | |
| 4.1 | The Allstate Corporation hereby agrees to furnish to the Commission, upon request, the instruments defining the rights of holders of each issue of long-term debt of it and its consolidated subsidiaries | | | | | |
| 4.2 | | | | | | X |
| 4.3 | | 8-K | 1-11840 | 4.1 | March 29, 2018 | |
| 4.4 | | 8-K | 1-11840 | 4.2 | March 29, 2018 | |
| 4.5 | Form of Depositary Receipt, Series G (included as Exhibit A to Exhibit 4.3 above) | 8-K | 1-11840 | 4.3 | March 29, 2018 | |
| 4.6 | | 8-K | 1-11840 | 4.1 | August 8, 2019 | |
| 4.7 | | 8-K | 1-11840 | 4.2 | August 8, 2019 | |
| 4.8 | Form of Depositary Receipt, Series H (included as Exhibit A to Exhibit 4.6 above) | 8-K | 1-11840 | 4.3 | August 8, 2019 | |
| 4.9 | | 8-K | 1-11840 | 4.1 | November 8, 2019 | |
| 4.10 | | 8-K | 1-11840 | 4.2 | November 8, 2019 | |
| 4.11 | Form of Depositary Receipt, Series I (included as Exhibit A to Exhibit 4.9 above) | 8-K | 1-11840 | 4.3 | November 8, 2019 | |
| 10.1 | Credit Agreement dated November 16, 2020, among The Allstate Corporation, Allstate Insurance Company, and Allstate Life Insurance Company, as Borrowers; the lenders party thereto, Wells Fargo Bank, National Association, as Syndication Agent; Bank of America, N.A., Barclays Bank PLC, Credit Suisse AG, New York Branch, Goldman Sachs Bank USA, Morgan Stanley MUFG Loan Partners, LLC, and U.S. Bank National Association, as Documentation Agents; and JPMorgan Chase Bank, N.A., as Administrative Agent. | 8-K | 1-11840 | 10.1 | November 17, 2020 | |
| 10.2* | | | | | | X |
| 10.3* | | S-8 | 1-11840 | 4 | November 20, 2018 | |
| 10.4* | | 10-Q | 1-11840 | 10.1 | May 5, 2020 | |
| 10.5 | | 10-Q | 1-11840 | 10.6 | May 5, 2020 | |
| 10.6* | | 10-Q | 1-11840 | 10.5 | May 5, 2020 | |
The Allstate Corporation 219
| | | | | | | | | | | | | | | | | | | | |
| | Incorporated by Reference | |
Exhibit Number | Exhibit Description | Form | File Number | Exhibit | Filing Date | Filed or Furnished Herewith |
| 10.7* | | 10-Q | 1-11840 | 10.2 | May 1, 2018 | |
| 10.8* | | 10-Q | 1-11840 | 10.4 | May 2, 2012 | |
| 10.9* | | 10-Q | 1-11840 | 10.3 | May 5, 2020 | |
| 10.10* | | 10-Q | 1-11840 | 10.3 | May 1, 2018 | |
| 10.11* | | 10-Q | 1-11840 | 10.3 | May 2, 2012 | |
| 10.12* | | 8-K | 1-11840 | 10.2 | December 28, 2011 | |
| 10.13* | | 10-Q | 1-11840 | 10.3 | April 27, 2011 | |
| 10.14* | | 8-K/A | 1-11840 | 10.3 | May 20, 2009 | |
| 10.15* | | 10-Q | 1-11840 | 10.4 | May 5, 2020 | |
| 10.16* | | 10-Q | 1-11840 | 10.4 | May 1, 2018 | |
| 10.17* | | 10-Q | 1-11840 | 10.2 | May 2, 2012 | |
| 10.18* | | 10-K | 1-11840 | 10.16 | February 15, 2019 | |
| 10.19* | | 8-K | 1-11840 | 10.1 | December 28, 2011 | |
| 10.20* | | 8-K | 1-11840 | 10.7 | September 19, 2008 | |
| 10.21* | | 8-K | 1-11840 | 10.5 | September 19, 2008 | |
| 10.22* | | 8-K | 1-11840 | 10.6 | September 19, 2008 | |
| 10.23* | | Proxy | 1-11840 | App. D | April 12, 2017 | |
| 10.24* | | 8-K | 1-11840 | 10.8 | September 19, 2008 | |
| | | | | | | | | | | | | | | | | | | | |
| | Incorporated by Reference | |
Exhibit Number | Exhibit Description | Form | File Number | Exhibit | Filing Date | Filed or Furnished Herewith |
| 10.25* | | 8-K | 1-11840 | 10.9 | September 19, 2008 | |
| 10.26* | | 10-Q | 1-11840 | 10.2 | August 3, 2016 | |
| 10.27* | | 10-Q | 1-11840 | 10.2 | August 1, 2017 | |
| 10.28* | | 10-Q | 1-11840 | 10.2 | August 1, 2007 | |
| 10.29* | | 10-K | 1-11840 | 10.24 | February 17, 2017 | |
| 10.30* | | 10-K | 1-11840 | 10.29 | February 15, 2019 | |
| 10.31 | | 8-K | 1-11840 | 10.1 | April 7, 2014 | |
| 10.32* | | 10-Q | 1-11840 | 10.1 | May 1, 2018 | |
| 10.33* | | 10-Q | 1-11840 | 10.1 | May 1, 2019 | |
| 21 | | | | | | X |
| 23 | | | | | | X |
| 31(i) | | | | | | X |
| 31(i) | | | | | | X |
| 32 | | | | | | X |
| 101.INS | Inline XBRL Instance Document (the instance document does not appear in the Interactive Data File because its XBRL tags are embedded within the Inline XBRL document | | | | | X |
| 101.SCH | Inline XBRL Taxonomy Extension Schema | | | | | X |
| 101.CAL | Inline XBRL Taxonomy Extension Calculation Linkbase | | | | | X |
| 101.DEF | Inline XBRL Taxonomy Extension Definition Linkbase | | | | | X |
| 101.LAB | Inline XBRL Taxonomy Extension Label Linkbase | | | | | X |
| 101.PRE | Inline XBRL Taxonomy Extension Presentation Linkbase | | | | | X |
| 104 | Cover Page Interactive Data File (formatted as inline XBRL and contained in Exhibit 101) | | | | | X |
Item 15. (b)
The exhibits are listed in Item 15. (a)(3) above.
Item 15. (c)
The financial statement schedules are listed in Item 15. (a)(2) above.
Item 16.
None.
The Allstate Corporation 221
Signatures
Pursuant to the requirements of Section 13 or 15(d) of the Securities Exchange Act of 1934, the registrant has duly caused this report to be signed on its behalf by the undersigned, thereunto duly authorized.
| | | | | | | | |
| | The Allstate Corporation (Registrant) |
| | |
| | /s/ John C. Pintozzi |
| | By: John C. Pintozzi |
| | Senior Vice President, Controller and Chief Accounting Officer |
| | (Principal Accounting Officer) |
| | February 19, 2021 |
Pursuant to the requirements of the Securities Exchange Act of 1934, this report has been signed below by the following persons on behalf of the registrant and in the capacities and on the dates indicated.
| | | | | | | | | | | | | | |
| Signature | | Title | | Date |
| | | | |
| /s/ Thomas J. Wilson | | Chairman of the Board, President, Chief Executive Officer and a Director (Principal Executive Officer) | | February 19, 2021 |
| Thomas J. Wilson | | |
| | | | |
| /s/ Mario Rizzo | | Executive Vice President and Chief Financial Officer (Principal Financial Officer) | | February 19, 2021 |
| Mario Rizzo | | |
| | | | |
| /s/ John C. Pintozzi | | Senior Vice President, Controller and Chief Accounting Officer (Principal Accounting Officer) | | February 19, 2021 |
| John C. Pintozzi | | |
| | | | |
| /s/ Donald E. Brown | | Director | | February 19, 2021 |
| Donald E. Brown | | |
| | | | |
| /s/ Kermit R. Crawford | | Director | | February 19, 2021 |
| Kermit R. Crawford | | |
| | | | |
| /s/ Michael L. Eskew | | Director | | February 19, 2021 |
| Michael L. Eskew | | |
| | | | |
| /s/ Richard T. Hume | | Director | | February 19, 2021 |
| Richard T. Hume | | |
| | | | |
| /s/ Margaret M. Keane | | Director | | February 19, 2021 |
| Margaret M. Keane | | |
| | | | |
| /s/ Siddharth N. Mehta | | Director | | February 19, 2021 |
| Siddharth N. Mehta | | |
| | | | |
| /s/ Jacques P. Perold | | Director | | February 19, 2021 |
| Jacques P. Perold | | |
| | | | |
| /s/ Andrea Redmond | | Director | | February 19, 2021 |
| Andrea Redmond | | |
| | | | |
| | | | |
| | |
| | | | |
| /s/ Gregg M. Sherrill | | Director | | February 19, 2021 |
| Gregg M. Sherrill | | |
| | | | |
| /s/ Judith A. Sprieser | | Lead Director | | February 19, 2021 |
| Judith A. Sprieser | | |
| | | | |
| | | | |
| | |
| | | | |
| /s/ Perry M. Traquina | | Director | | February 19, 2021 |
| Perry M. Traquina | | |
The Allstate Corporation and Subsidiaries
Schedule I — Summary of Investments Other than Investments in Related Parties
| | | | | | | | | | | | | | | | | | | | |
| | As of December 31, 2020 |
| ($ in millions) | | Cost/amortized cost, net | | Fair value (if applicable) | | Amount shown in the Balance Sheet |
| Type of investment | | | | | | |
| Fixed maturities: | | | | | | |
| Bonds: | | | | | | |
| United States government, government agencies and authorities | | $ | 3,129 | | | $ | 3,222 | | | $ | 3,222 | |
| States, municipalities and political subdivisions | | 8,752 | | | 9,587 | | | 9,587 | |
| Foreign governments | | 1,013 | | | 1,055 | | | 1,055 | |
| Public utilities | | 5,948 | | | 6,564 | | | 6,564 | |
| | | | | | |
| All other corporate bonds | | 41,278 | | | 44,578 | | | 44,578 | |
| Asset-backed securities | | 1,260 | | | 1,270 | | | 1,270 | |
| Mortgage-backed securities | | 71 | | | 78 | | | 78 | |
| | | | | | |
| | | | | | |
| | | | | | |
| Total fixed maturities | | 61,451 | | | 66,354 | | | 66,354 | |
| | | | | | |
| Equity securities: | | | | | | |
| Common stocks: | | | | | | |
| Public utilities | | 34 | | | 46 | | | 46 | |
| Banks, trusts and insurance companies | | 174 | | | 255 | | | 255 | |
| Industrial, miscellaneous and all other | | 3,393 | | | 4,087 | | | 4,087 | |
| Nonredeemable preferred stocks | | 252 | | | 322 | | | 322 | |
| Total equity securities | | 3,853 | | | 4,710 | | | 4,710 | |
| | | | | | |
| Mortgage loans on real estate | | 4,075 | | | 4,348 | | | 4,075 | |
| Real estate (none acquired in satisfaction of debt) | | 974 | | | | | 974 | |
| Policy loans | | 754 | | | | | 754 | |
| Derivative instruments | | 204 | | | 204 | | | 204 | |
| Limited partnership interests | | 7,609 | | | | | 7,609 | |
| Other long-term investments | | 1,757 | | | | | 1,757 | |
| Short-term investments | | 7,800 | | | 7,800 | | | 7,800 | |
| Total investments | | $ | 88,477 | | | | | $ | 94,237 | |
The Allstate Corporation and Subsidiaries
Schedule II — Condensed Financial Information of Registrant Statement of Operations
| | | | | | | | | | | | | | | | | | | | |
| | Year Ended December 31, |
| ($ in millions) | | 2020 | | 2019 | | 2018 |
| Revenues | | | | | | |
| Investment income, less investment expense | | $ | 12 | | | $ | 35 | | | $ | 25 | |
| Realized capital gains (losses) | | 33 | | | 9 | | | (10) | |
| Other income | | — | | | 41 | | | 3 | |
| Total revenues | | 45 | | | 85 | | | 18 | |
| | | | | | |
| Expenses | | | | | | |
| Interest expense | | 328 | | | 355 | | | 337 | |
| | | | | | |
| Pension and other postretirement remeasurement (gains) losses | | (73) | | | 103 | | | 454 | |
| Pension and other postretirement benefit | | (168) | | | (122) | | | (116) | |
| Other operating expenses | | 73 | | | 49 | | | 50 | |
| Total expenses | | 160 | | | 385 | | | 725 | |
| | | | | | |
| Loss from operations before income tax benefit and equity in net income of subsidiaries | | (115) | | | (300) | | | (707) | |
| | | | | | |
| Income tax benefit | | (26) | | | (75) | | | (136) | |
| Loss before equity in net income of subsidiaries | | (89) | | | (225) | | | (571) | |
| | | | | | |
| Equity in net income of subsidiaries | | 5,665 | | | 5,072 | | | 2,731 | |
| Net income | | 5,576 | | | 4,847 | | | 2,160 | |
| | | | | | |
| Preferred stock dividends | | 115 | | | 169 | | | 148 | |
| | | | | | |
| Net income applicable to common shareholders | | 5,461 | | | 4,678 | | | 2,012 | |
| | | | | | |
| Other comprehensive income (loss), after-tax | | | | | | |
| Changes in: | | | | | | |
| Unrealized net capital gains and losses | | 1,293 | | | 1,889 | | | (754) | |
| Unrealized foreign currency translation adjustments | | 52 | | | (10) | | | (48) | |
| Unamortized pension and other postretirement prior service credit | | 9 | | | (47) | | | (59) | |
| Other comprehensive income (loss), after-tax | | 1,354 | | | 1,832 | | | (861) | |
| Comprehensive income | | $ | 6,930 | | | $ | 6,679 | | | $ | 1,299 | |
See accompanying notes to condensed financial information and notes to consolidated financial statements.
The Allstate Corporation S-2
The Allstate Corporation and Subsidiaries
Schedule II (Continued) — Condensed Financial Information of Registrant Statement of Financial Position
| | | | | | | | | | | | | | |
| | December 31, |
| ($ in millions, except par value data) | | 2020 | | 2019 |
| Assets | | | | |
| Investments in subsidiaries | | $ | 35,603 | | | $ | 33,428 | |
Fixed income securities, at fair value (amortized cost, net zero and $458) | | — | | | 466 | |
Short-term investments, at fair value (amortized cost, net $4,479 and $702) | | 4,479 | | | 702 | |
| Cash | | — | | | 2 | |
| Receivable from subsidiaries | | 524 | | | 448 | |
| | | | |
| Deferred income taxes | | 187 | | | 230 | |
| Other assets | | 87 | | | 86 | |
| Total assets | | $ | 40,880 | | | $ | 35,362 | |
| | | | |
| Liabilities | | | | |
| | | | |
| Long-term debt | | $ | 7,825 | | | $ | 6,631 | |
| Pension and other postretirement benefit obligations | | 874 | | | 1,081 | |
| Deferred compensation | | 351 | | | 327 | |
| Payable to subsidiaries | | — | | | 14 | |
| Notes due to subsidiaries | | 1,250 | | | 1,000 | |
| Dividends payable to shareholders | | 201 | | | 199 | |
| | | | |
| Other liabilities | | 162 | | | 112 | |
| Total liabilities | | 10,663 | | | 9,364 | |
| | | | |
| Shareholders’ equity | | | | |
Preferred stock and additional capital paid-in, $1 par value, 25 million shares authorized, 81.0 thousand and 92.5 thousand shares issued and outstanding, $2,025 and $2,313 aggregate liquidation preference | | 1,970 | | | 2,248 | |
Common stock, $.01 par value, 2.0 billion shares authorized and 900 million issued, 304 million and 319 million shares outstanding | | 9 | | | 9 | |
| Additional capital paid-in | | 3,498 | | | 3,463 | |
| Retained income | | 52,767 | | | 48,074 | |
| | | | |
Treasury stock, at cost (596 million and 581 million shares) | | (31,331) | | | (29,746) | |
| Accumulated other comprehensive income: | | | | |
| Unrealized net capital gains and losses | | 3,180 | | | 1,887 | |
| Unrealized foreign currency translation adjustments | | (7) | | | (59) | |
| Unamortized pension and other postretirement prior service credit | | 131 | | | 122 | |
| Total accumulated other comprehensive income | | 3,304 | | | 1,950 | |
| Total shareholders’ equity | | 30,217 | | | 25,998 | |
| Total liabilities and shareholders’ equity | | $ | 40,880 | | | $ | 35,362 | |
See accompanying notes to condensed financial information and notes to consolidated financial statements.
The Allstate Corporation and Subsidiaries
Schedule II (Continued) — Condensed Financial Information of Registrant Statement of Cash Flows
| | | | | | | | | | | | | | | | | | | | |
| | Years Ended December 31, |
| ($ in millions) | | 2020 | | 2019 | | 2018 |
| Cash flows from operating activities | | | | | | |
| Net income | | $ | 5,576 | | | $ | 4,847 | | | $ | 2,160 | |
| Adjustments to reconcile net income to net cash provided by operating activities: | | | | | | |
| Equity in net income of subsidiaries | | (5,665) | | | (5,072) | | | (2,731) | |
| Dividends received from subsidiaries | | 4,157 | | | 2,434 | | | 2,059 | |
| Realized capital (gains) losses | | (33) | | | (9) | | | 10 | |
| | | | | | |
| Pension and other postretirement remeasurement (gains) losses | | (73) | | | 103 | | | 454 | |
| Changes in: | | | | | | |
| Pension and other postretirement benefits | | (168) | | | (122) | | | (116) | |
| Income taxes | | 54 | | | 13 | | | (28) | |
| Operating assets and liabilities | | 110 | | | 111 | | | 160 | |
| Net cash provided by operating activities | | 3,958 | | | 2,305 | | | 1,968 | |
| | | | | | |
| Cash flows from investing activities | | | | | | |
| Proceeds from sales of investments | | 1,251 | | | 1,094 | | | 1,370 | |
| Proceeds from sales of investments to subsidiaries | | — | | | — | | | 390 | |
| Investment purchases | | (402) | | | (892) | | | (1,037) | |
| Investment collections | | 16 | | | 65 | | | 108 | |
| Capital contribution or return of capital from subsidiaries | | 251 | | | 43 | | | (975) | |
| | | | | | |
| Change in short-term investments, net | | (3,777) | | | (417) | | | (115) | |
| Net cash used in investing activities | | (2,661) | | | (107) | | | (259) | |
| | | | | | |
| Cash flows from financing activities | | | | | | |
| Proceeds from borrowings from subsidiaries | | 1,250 | | | 1,000 | | | 1,250 | |
| Repayment of notes due to subsidiaries | | (1,000) | | | (1,250) | | | (250) | |
| Proceeds from issuance of long-term debt | | 1,189 | | | 491 | | | 498 | |
| Redemption of preferred stock | | (288) | | | (1,132) | | | (385) | |
| Redemption and repayment of long-term debt | | — | | | (317) | | | (400) | |
| Proceeds from issuance of preferred stock | | — | | | 1,414 | | | 557 | |
| Dividends paid on common stock | | (668) | | | (653) | | | (614) | |
| Dividends paid on preferred stock | | (108) | | | (134) | | | (134) | |
| Treasury stock purchases | | (1,737) | | | (1,735) | | | (2,303) | |
| Shares reissued under equity incentive plans, net | | 63 | | | 120 | | | 73 | |
| | | | | | |
| Other | | — | | | — | | | (1) | |
| Net cash used in financing activities | | (1,299) | | | (2,196) | | | (1,709) | |
| | | | | | |
| Net (decrease) increase in cash | | (2) | | | 2 | | | — | |
| Cash at beginning of year | | 2 | | | — | | | — | |
| Cash at end of year | | $ | — | | | $ | 2 | | | $ | — | |
See accompanying notes to condensed financial information and notes to consolidated financial statements.
The Allstate Corporation S-4
The Allstate Corporation and Subsidiaries
Schedule II (Continued) — Condensed Financial Information of Registrant
Notes to Condensed Financial Information
1. General
Pursuant to rules and regulations of the SEC, the unconsolidated condensed financial statements of the Parent Company do not reflect all of the information and notes normally included with financial statements prepared in accordance with GAAP. Therefore, these condensed financial statements of the Registrant should be read in conjunction with the consolidated financial statements and notes thereto included in Item 8.
The long-term debt presented in Note 12 “Capital Structure” are direct obligations of the Registrant. A majority of the pension and other postretirement benefits plans presented in Note 17 “Benefit Plans” are direct obligations of the Registrant.
Participating subsidiaries fund the pension plans contributions under a master services cost sharing agreement. In addition, as a result of joint and several pension liability rules under the Internal Revenue Code and the Employee Retirement Income Security Act of 1974, as amended, many liabilities that arise in connection with pension plans are joint and several across all members of a controlled group of entities.
2. Notes due to subsidiaries
On June 18, 2020 and December 29, 2020, the Registrant issued $1.00 billion and $250 million notes, with rates of 0.43% and 0.33%, due on June 18, 2021 and December 29, 2021, respectively, to Kennett Capital Inc. The proceeds of these issuances were used for cash management purposes.
On June 19, 2019, the Registrant issued a $1.00 billion note, with a rate of 2.63% due on June 19, 2020 to Kennett Capital Inc. The proceeds of this issuance were used for cash management purposes. On June 18, 2020, the Registrant repaid $1.00 billion to Kennett Capital Inc.
3. Supplemental Disclosures of Cash Flow Information
The Registrant paid $311 million, $312 million and $330 million of interest on debt in 2020, 2019 and 2018, respectively.
The Allstate Corporation and Subsidiaries
Schedule III — Supplementary Insurance Information
| | | | | | | | | | | | | | | | | | | | | | | | | | | | | | | | | | | | | | | | | | | | | | | | | | | | | | | | |
| ($ in millions) | | As of December 31, | | For the years ended December 31, |
| Segment | | Deferred policy acquisition costs | | Reserves for claims and claims expense, contract benefits and contractholder funds | | Unearned premiums | | Premium revenue and contract charges | | Net investment income (1) | | Claims and claims expense, contract benefits and interest credited to contractholders | | Amortization of deferred policy acquisition costs | | Other operating costs and expenses | | Premiums written (excluding life) |
| 2020 | | | | | | | | | | | | | | | | | | |
| Property-Liability | | | | | | | | | | | | | | | | | | |
| Allstate Protection | | $ | 1,608 | | | $ | 25,679 | | | $ | 12,772 | | | $ | 35,580 | | | | | $ | 21,485 | | | $ | 4,642 | | | $ | 5,623 | | | $ | 35,768 | |
| Discontinued Lines and Coverages | | — | | | 1,888 | | | — | | | — | | | | | 141 | | | — | | | 3 | | | — | |
| Total Property-Liability | | 1,608 | | | 27,567 | | | 12,772 | | | 35,580 | | | $ | 1,421 | | | 21,626 | | | 4,642 | | | 5,626 | | | 35,768 | |
Protection Services (2) | | 1,696 | | | 43 | | | 3,167 | | | 1,640 | | | 44 | | | 386 | | | 658 | | | 760 | | | 1,890 | |
| Allstate Life | | 909 | | | 10,768 | | | 3 | | | 1,340 | | | 502 | | | 1,293 | | | 149 | | | 335 | | | — | |
| Allstate Benefits | | 470 | | | 1,885 | | | 7 | | | 1,094 | | | 78 | | | 549 | | | 177 | | | 323 | | | 926 | |
| Allstate Annuities | | 17 | | | 17,328 | | | — | | | 10 | | | 761 | | | 1,039 | | | 4 | | | 27 | | | — | |
| Corporate and Other | | — | | | — | | | — | | | — | | | 47 | | | — | | | — | | | 389 | | | — | |
Intersegment Eliminations (2) | | — | | | — | | | — | | | (147) | | | — | | | (11) | | | — | | | (136) | | | — | |
| Total | | $ | 4,700 | | | $ | 57,591 | | | $ | 15,949 | | | $ | 39,517 | | | $ | 2,853 | | | $ | 24,882 | | | $ | 5,630 | | | $ | 7,324 | | | $ | 38,584 | |
| 2019 | | | | | | | | | | | | | | | | | | |
| Property-Liability | | | | | | | | | | | | | | | | | | |
| Allstate Protection | | $ | 1,624 | | | $ | 25,843 | | | $ | 12,567 | | | $ | 34,843 | | | | | $ | 23,517 | | | $ | 4,649 | | | $ | 4,506 | | | $ | 35,419 | |
| Discontinued Lines and Coverages | | — | | | 1,818 | | | — | | | — | | | | | 105 | | | — | | | 3 | | | — | |
| Total Property-Liability | | 1,624 | | | 27,661 | | | 12,567 | | | 34,843 | | | $ | 1,533 | | | 23,622 | | | 4,649 | | | 4,509 | | | 35,419 | |
Protection Services (2) | | 1,449 | | | 51 | | | 2,765 | | | 1,387 | | | 42 | | | 363 | | | 543 | | | 838 | | | 1,535 | |
| Allstate Life | | 1,079 | | | 10,541 | | | 3 | | | 1,343 | | | 514 | | | 1,154 | | | 173 | | | 356 | | | — | |
| Allstate Benefits | | 527 | | | 1,950 | | | 8 | | | 1,145 | | | 83 | | | 635 | | | 161 | | | 285 | | | 988 | |
| Allstate Annuities | | 20 | | | 17,501 | | | — | | | 13 | | | 917 | | | 890 | | | 7 | | | 30 | | | — | |
| Corporate and Other | | — | | | — | | | — | | | — | | | 70 | | | — | | | — | | | 531 | | | — | |
Intersegment Eliminations (2) | | — | | | — | | | — | | | (154) | | | — | | | (9) | | | — | | | (145) | | | — | |
| Total | | $ | 4,699 | | | $ | 57,704 | | | $ | 15,343 | | | $ | 38,577 | | | $ | 3,159 | | | $ | 26,655 | | | $ | 5,533 | | | $ | 6,404 | | | $ | 37,942 | |
| 2018 | | | | | | | | | | | | | | | | | | |
| Property-Liability | | | | | | | | | | | | | | | | | | |
| Allstate Protection | | $ | 1,618 | | | $ | 25,495 | | | $ | 11,953 | | | $ | 32,950 | | | | | $ | 22,348 | | | $ | 4,475 | | | $ | 4,522 | | | $ | 33,555 | |
| Discontinued Lines and Coverages | | — | | | 1,864 | | | — | | | — | | | | | 87 | | | — | | | 3 | | | — | |
| Total Property-Liability | | 1,618 | | | 27,359 | | | 11,953 | | | 32,950 | | | $ | 1,464 | | | 22,435 | | | 4,475 | | | 4,525 | | | 33,555 | |
Protection Services (2) | | 1,290 | | | 64 | | | 2,546 | | | 1,220 | | | 27 | | | 350 | | | 463 | | | 603 | | | 1,431 | |
| Allstate Life | | 1,300 | | | 10,333 | | | 3 | | | 1,315 | | | 505 | | | 1,094 | | | 132 | | | 364 | | | — | |
| Allstate Benefits | | 549 | | | 1,905 | | | 8 | | | 1,135 | | | 77 | | | 630 | | | 145 | | | 278 | | | 980 | |
| Allstate Annuities | | 27 | | | 18,341 | | | — | | | 15 | | | 1,096 | | | 903 | | | 7 | | | 31 | | | — | |
| Corporate and Other | | — | | | — | | | — | | | — | | | 71 | | | — | | | — | | | 880 | | | — | |
Intersegment Eliminations (2) | | — | | | — | | | — | | | (122) | | | — | | | (7) | | | — | | | (115) | | | — | |
| Total | | $ | 4,784 | | | $ | 58,002 | | | $ | 14,510 | | | $ | 36,513 | | | $ | 3,240 | | | $ | 25,405 | | | $ | 5,222 | | | $ | 6,566 | | | $ | 35,966 | |
(1)A single investment portfolio supports both Allstate Protection and Discontinued Lines and Coverages segments.
(2)Includes intersegment premiums and service fees and the related incurred losses and expenses that are eliminated in the consolidated financial statements.
The Allstate Corporation S-6
The Allstate Corporation and Subsidiaries
Schedule IV — Reinsurance
| | | | | | | | | | | | | | | | | | | | | | | | | | | | | | | | |
| ($ in millions) | | Gross amount | | Ceded to other companies (1) | | Assumed from other companies | | Net amount | | Percentage of amount assumed to net |
| Year ended December 31, 2020 | | | | | | | | | | |
| Life insurance in force | | $ | 208,417 | | | $ | 67,319 | | | $ | 217,020 | | | $ | 358,118 | | | 60.6 | % |
| Premiums and contract charges: | | | | | | | | | | |
| Life insurance | | $ | 1,053 | | | $ | 222 | | | $ | 685 | | | $ | 1,516 | | | 45.2 | % |
| Accident and health insurance | | 948 | | | 20 | | | — | | | 928 | | | — | % |
| Property and casualty insurance | | 38,115 | | | 1,141 | | | 99 | | | 37,073 | | | 0.3 | % |
| Total premiums and contract charges | | $ | 40,116 | | | $ | 1,383 | | | $ | 784 | | | $ | 39,517 | | | 2.0 | % |
| Year ended December 31, 2019 | | | | | | | | | | |
| Life insurance in force | | $ | 219,785 | | | $ | 74,021 | | | $ | 229,419 | | | $ | 375,183 | | | 61.1 | % |
| Premiums and contract charges: | | | | | | | | | | |
| Life insurance | | $ | 1,062 | | | $ | 262 | | | $ | 712 | | | $ | 1,512 | | | 47.1 | % |
| Accident and health insurance | | 1,012 | | | 23 | | | — | | | 989 | | | — | % |
| Property and casualty insurance | | 37,104 | | | 1,122 | | | 94 | | | 36,076 | | | 0.3 | % |
| Total premiums and contract charges | | $ | 39,178 | | | $ | 1,407 | | | $ | 806 | | | $ | 38,577 | | | 2.1 | % |
| Year ended December 31, 2018 | | | | | | | | | | |
| Life insurance in force | | $ | 207,434 | | | $ | 81,186 | | | $ | 243,161 | | | $ | 369,409 | | | 65.8 | % |
| Premiums and contract charges: | | | | | | | | | | |
| Life insurance | | $ | 994 | | | $ | 266 | | | $ | 754 | | | $ | 1,482 | | | 50.9 | % |
| Accident and health insurance | | 1,007 | | | 24 | | | — | | | 983 | | | — | % |
| Property and casualty insurance | | 34,977 | | | 1,016 | | | 87 | | | 34,048 | | | 0.3 | % |
| Total premiums and contract charges | | $ | 36,978 | | | $ | 1,306 | | | $ | 841 | | | $ | 36,513 | | | 2.3 | % |
(1)No reinsurance or coinsurance income was netted against premium ceded in 2020, 2019 or 2018.
The Allstate Corporation and Subsidiaries
Schedule V — Valuation Allowances and Qualifying Accounts
| | | | | | | | | | | | | | | | | | | | | | | | | | | | | | | | |
| ($ in millions) | | | | Additions | | | | |
| Description | | Balance as of beginning of period (1) | | Charged to costs and expenses | | Other additions | | Deductions | | Balance as of end of period |
Year ended December 31, 2020 | | | | | | | | | | |
| Fixed income securities | | $ | — | | | $ | 5 | | | $ | — | | | $ | 2 | | | $ | 3 | |
| Mortgage loans | | 45 | | | 39 | | | — | | | 17 | | | 67 | |
| Other investments | | | | | | | | | | |
| Bank loans | | 53 | | | 28 | | | — | | | 14 | | | 67 | |
| Agent loans | | 5 | | | — | | | — | | | — | | | 5 | |
| Investments | | 103 | | | 72 | | | — | | | 33 | | | 142 | |
| Premium installment receivable | | 91 | | | 223 | | | — | | | 161 | | | 153 | |
| Reinsurance recoverables | | 74 | | | — | | | — | | | — | | | 74 | |
| Other assets | | 18 | | | 5 | | | — | | | — | | | 23 | |
| Assets | | 286 | | | 300 | | | — | | | 194 | | | 392 | |
| Commitments to fund mortgage loans, bank loans and agent loans | | 3 | | | — | | | — | | | 2 | | | 1 | |
| Liabilities | | 3 | | | — | | | — | | | 2 | | | 1 | |
| Total | | $ | 289 | | | $ | 300 | | | $ | — | | | $ | 196 | | | $ | 393 | |
| | | | | | | | | | |
| | | | | | | | | | |
| | | | | | | | | | |
| | | | | | | | | | |
| | | | | | | | | | |
| | | | | | | | | | |
Year ended December 31, 2019 | | | | | | | | | | |
| Reinsurance recoverables | | $ | 65 | | | $ | (2) | | | $ | — | | | $ | — | | | $ | 63 | |
| Premium installment receivable | | 77 | | | 137 | | | — | | | 124 | | | 90 | |
| Deferred tax assets | | — | | | — | | | — | | | — | | | — | |
| Mortgage loans | | 3 | | | — | | | — | | | — | | | 3 | |
| Agent loans | | 2 | | | 1 | | | — | | | — | | | 3 | |
| | | | | | | | | | |
Year ended December 31, 2018 | | | | | | | | | | |
| Reinsurance recoverables | | $ | 70 | | | $ | (5) | | | $ | — | | | $ | — | | | $ | 65 | |
| Premium installment receivable | | 77 | | | 118 | | | — | | | 118 | | | 77 | |
| Deferred tax assets | | — | | | — | | | — | | | — | | | — | |
| Mortgage loans | | 3 | | | — | | | — | | | — | | | 3 | |
| Agent loans | | 2 | | | — | | | — | | | — | | | 2 | |
(1)Effective January 1, 2020, the Company adopted the measurement of credit losses on financial instruments accounting standard that primarily affected mortgage loans, bank loans and reinsurance recoverables. After consideration of existing valuation allowances maintained prior to adopting the new guidance, the Company increased its valuation allowances for credit losses at January 1, 2020 to conform to the new requirements.